Area Chart For PowerPoint Presentation

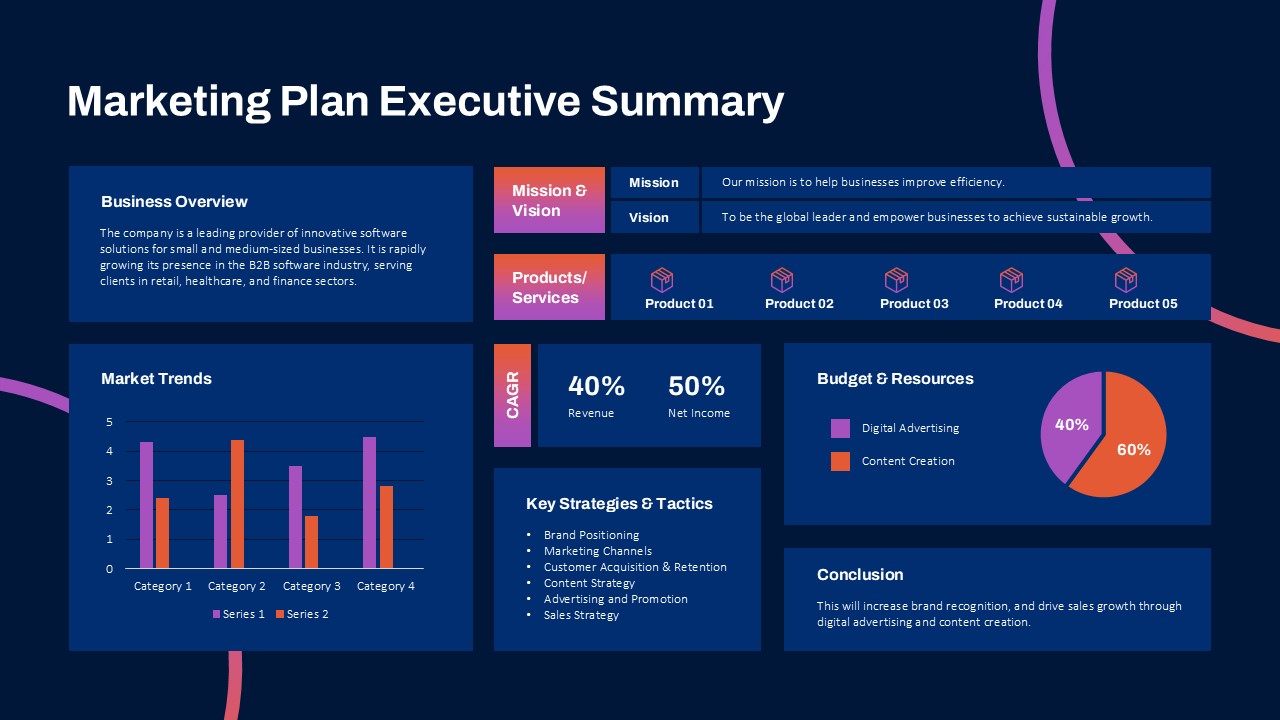
Enhance your data visualization with this Area Chart Infographic Template, designed for PowerPoint and Google Slides. This professional and modern template allows you to represent trends, comparisons, and data progression over time using a visually appealing stacked area chart.
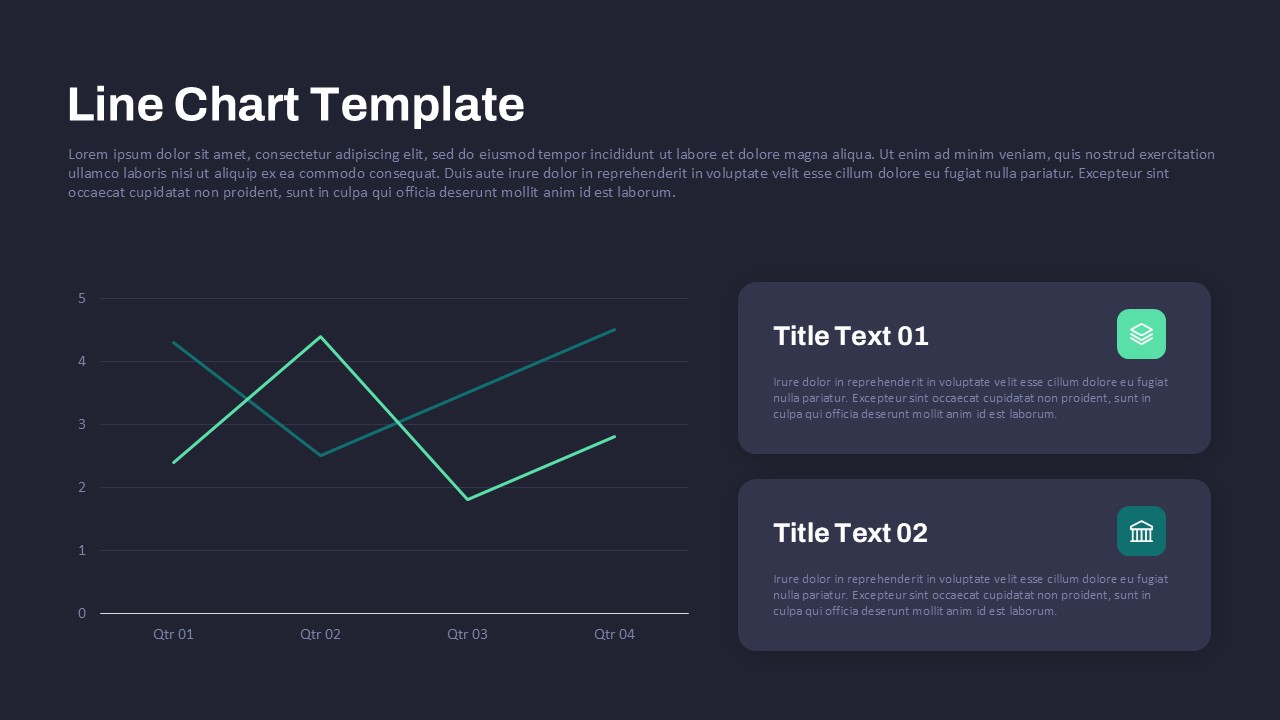
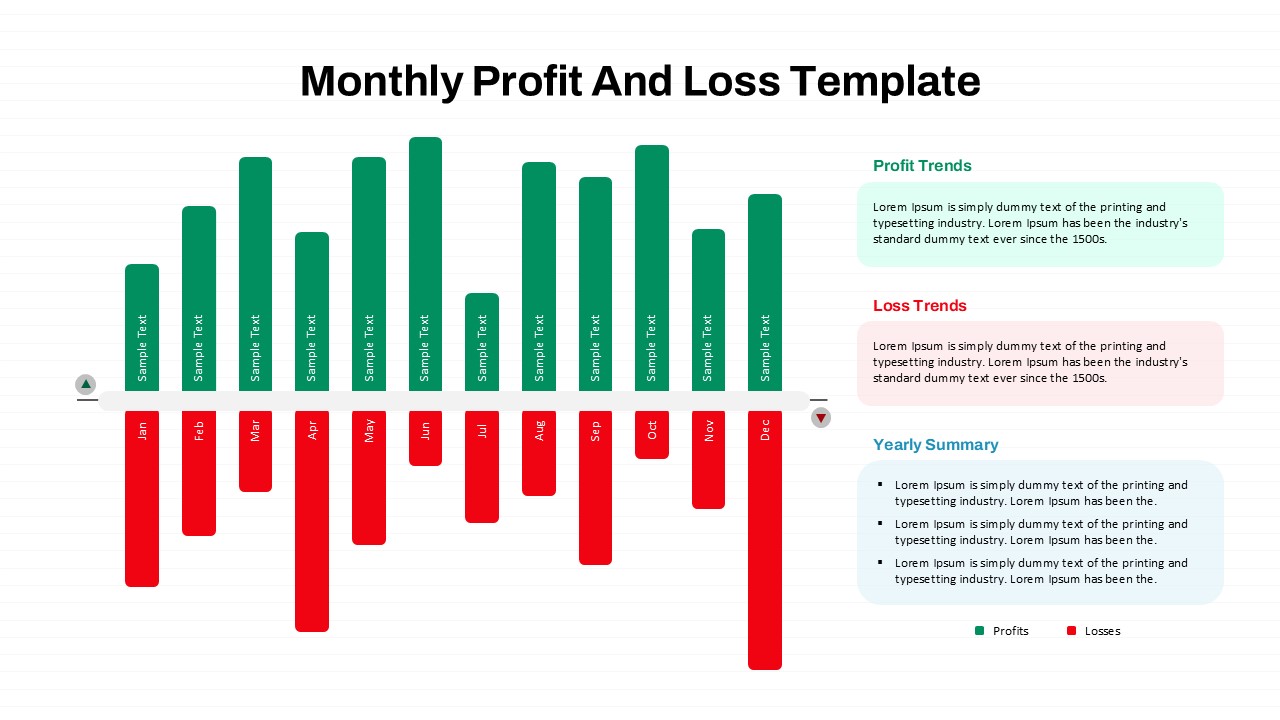
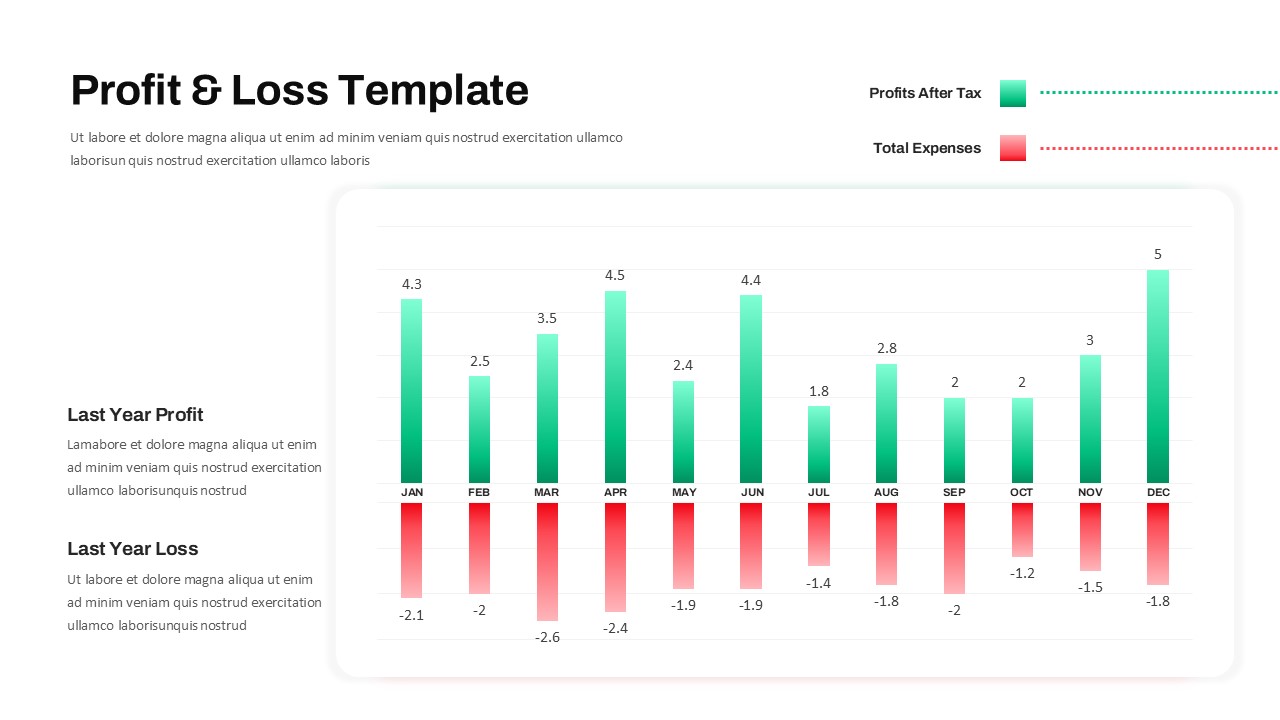
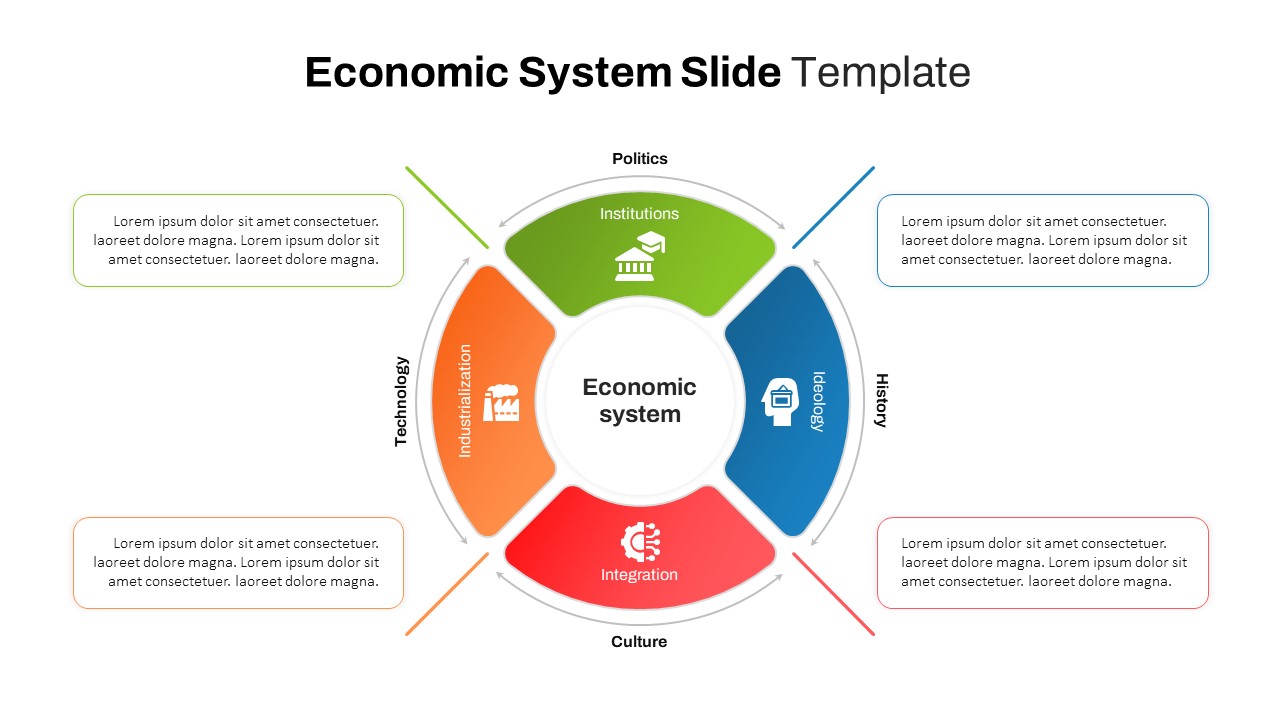
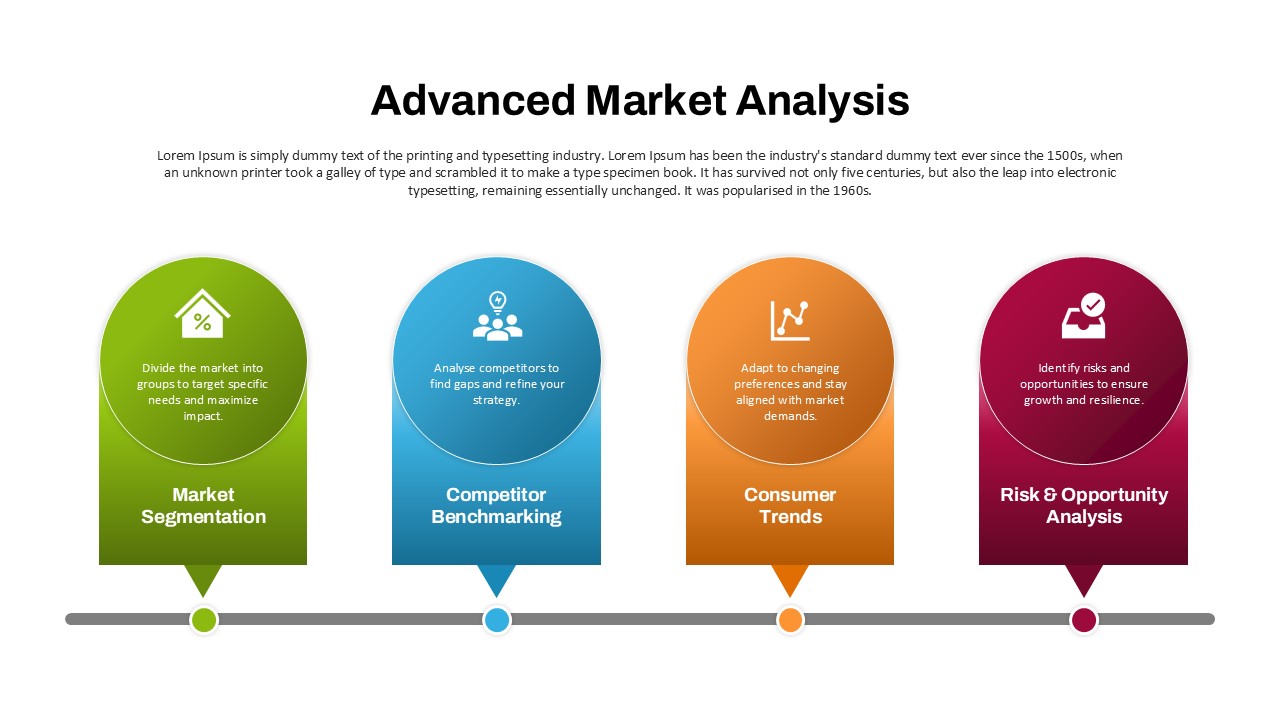
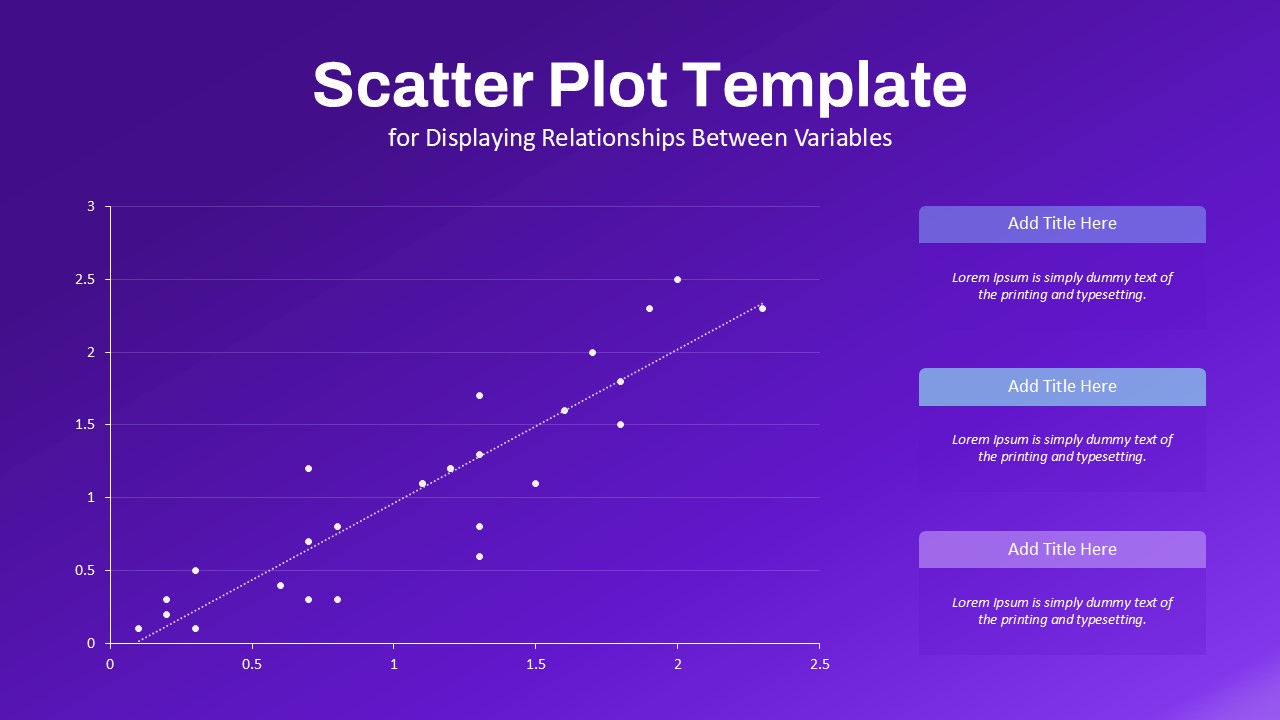
The template features two distinct data series with gradient shading to create an engaging layered effect. It provides clear axis labeling and customizable data points, ensuring easy interpretation of trends and fluctuations. Below the chart, two text boxes allow for detailed explanations of each series, offering context and insights for your audience. The call-to-action buttons for each data series further enhance interactivity, making this template ideal for business reports, market analysis, financial forecasting, and strategic planning.
Designed for business professionals, data analysts, marketers, and educators, this template makes it easy to present financial trends, sales growth, competitive analysis, or performance tracking in an engaging and impactful way. The fully editable format allows customization of colors, text, and data values to align with your branding and presentation needs.
Whether you’re conducting a quarterly business review, analyzing performance metrics, or forecasting future trends, this Area Chart Infographic Template provides the perfect balance of clarity and style for your presentation.
Disclaimer: The Google Slides and PowerPoint versions of this template may appear differently and have varying features due to limitations in Google Slides
See more

Aspect Ratio
16:9Item ID
SKT03010
Features of this template
Other User Cases of the Template
Sales performance reports, financial growth tracking, market trend analysis, project progress visualization, business forecasting, KPI measurement, data analytics presentations, competitive benchmarking, stock market analysis, economic performance reviews.FAQs
You May Also Like These Presentation Templates


- Free
- Free

- Free

- Free

- Free
- Free
- Free
- Free
- Free