Bahamas Country Map PowerPoint and Template
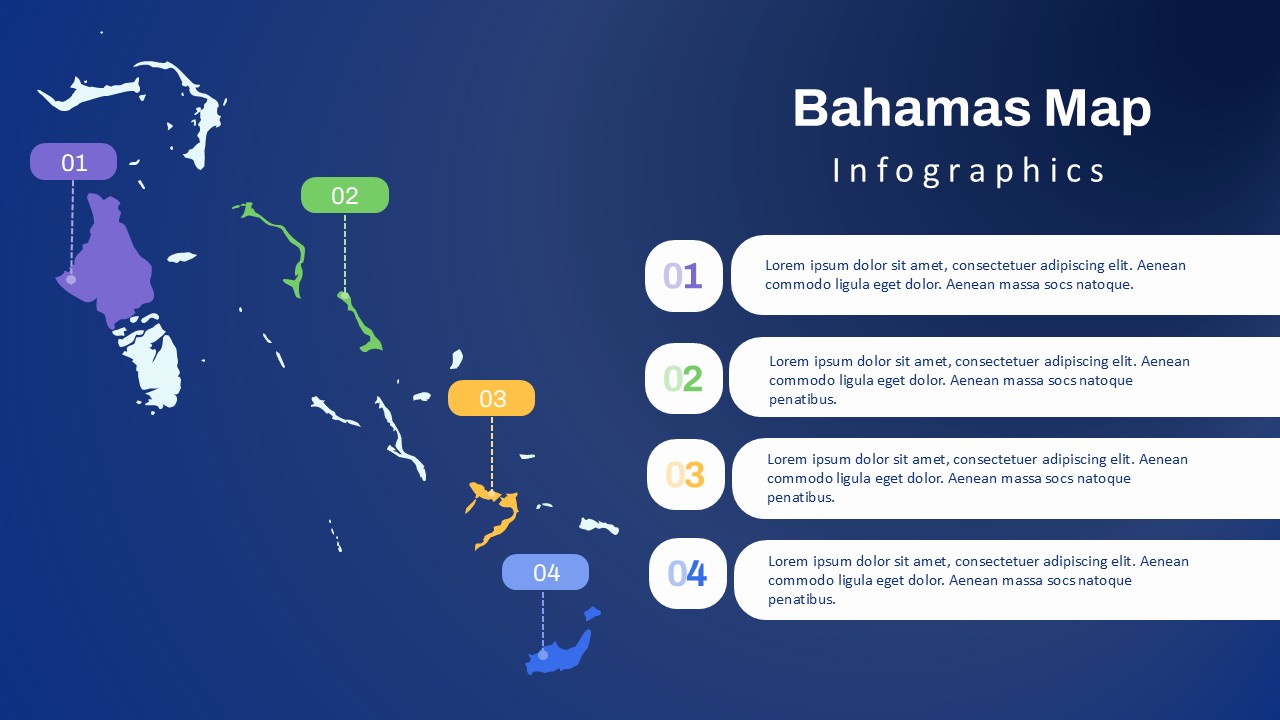
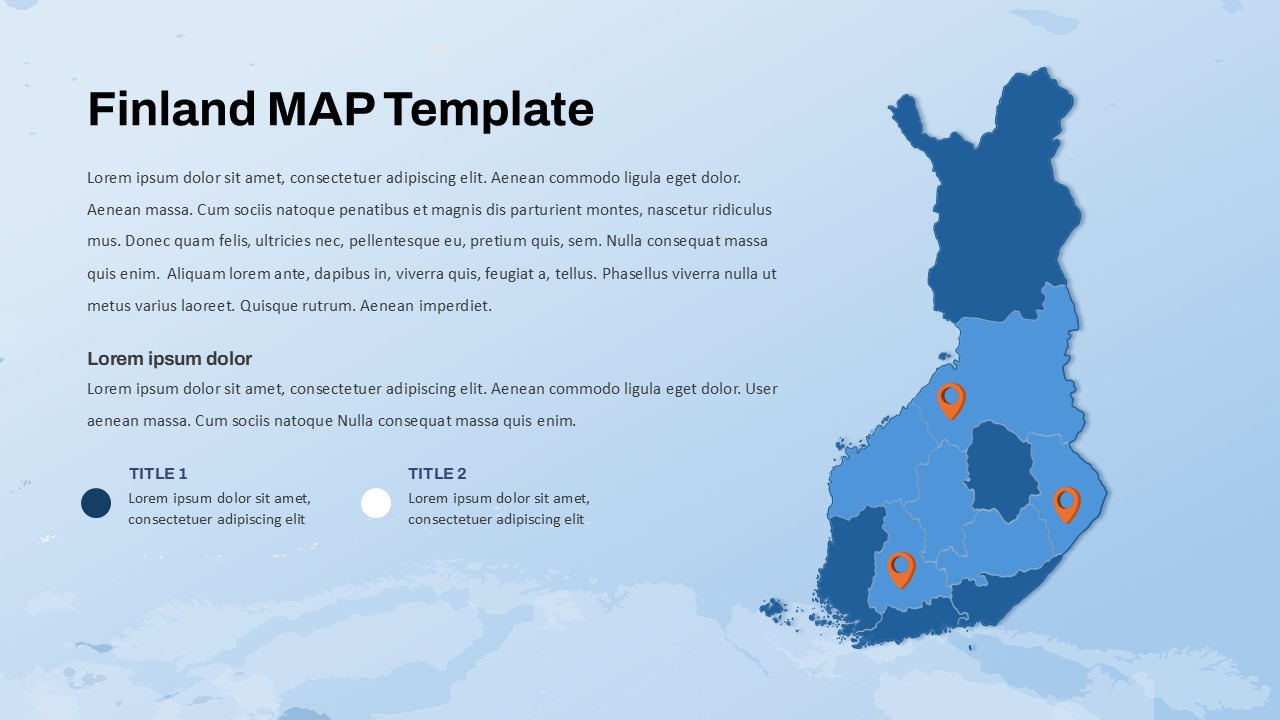
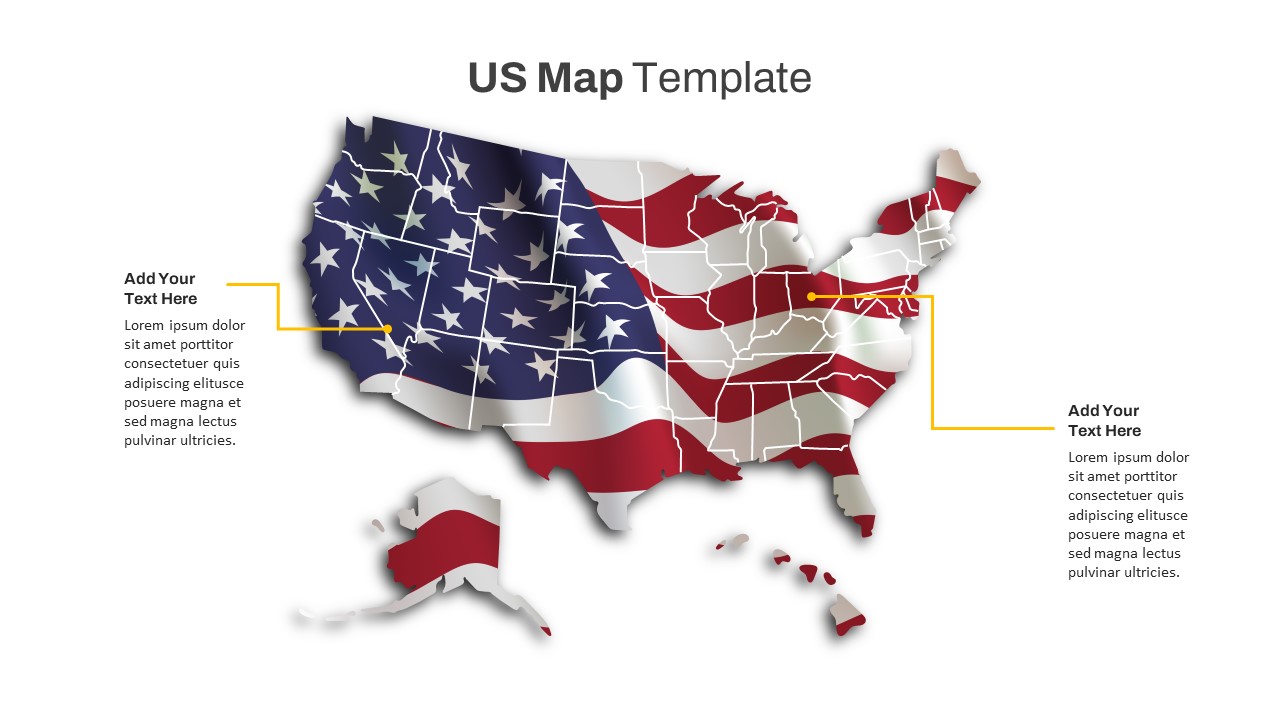
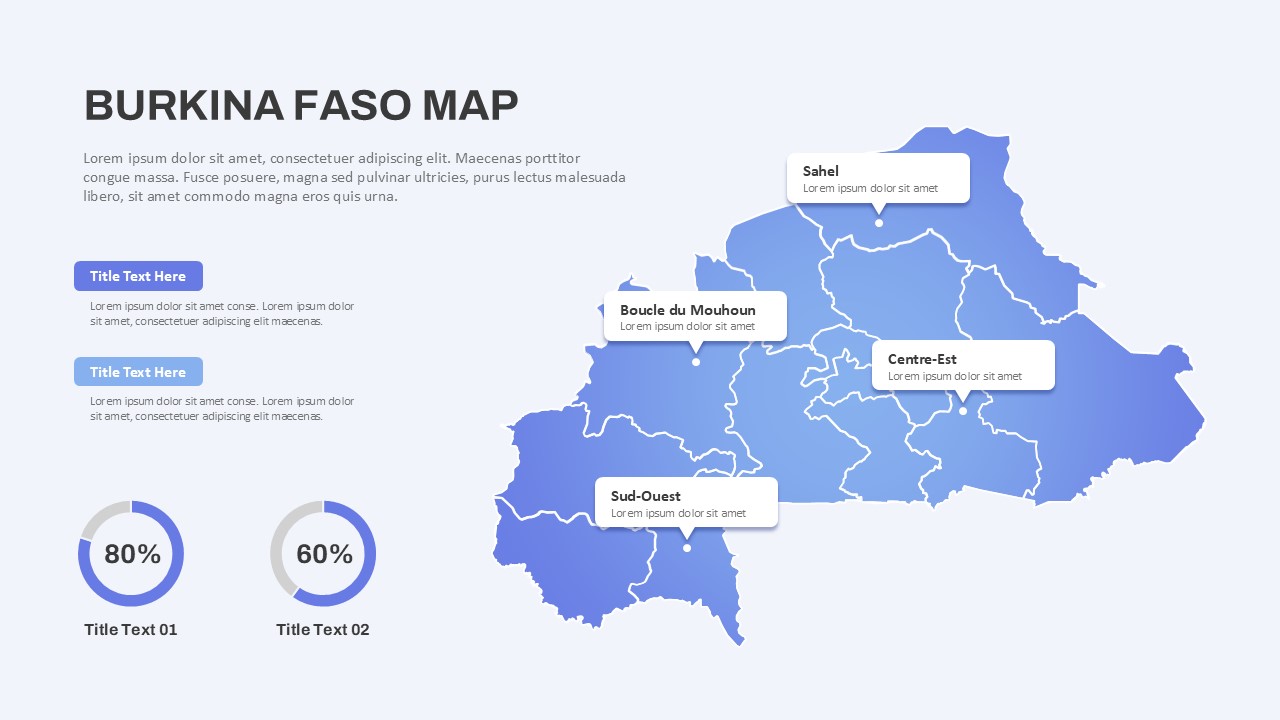
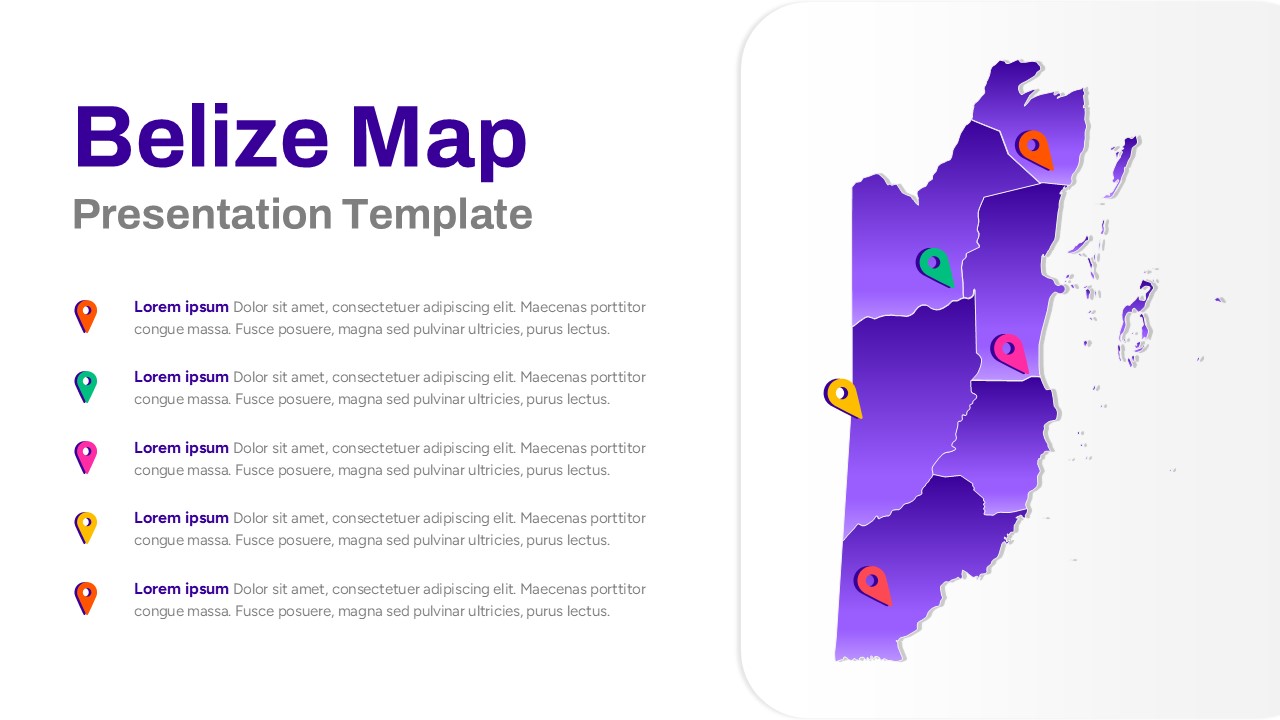
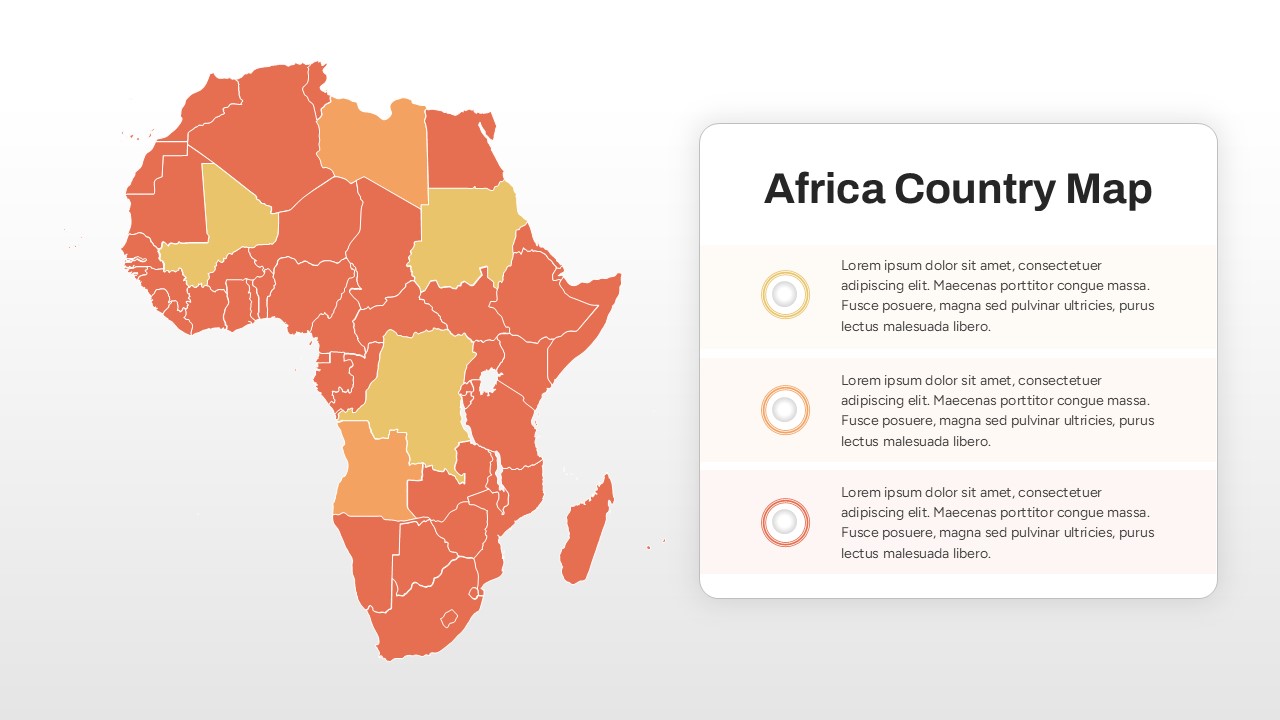
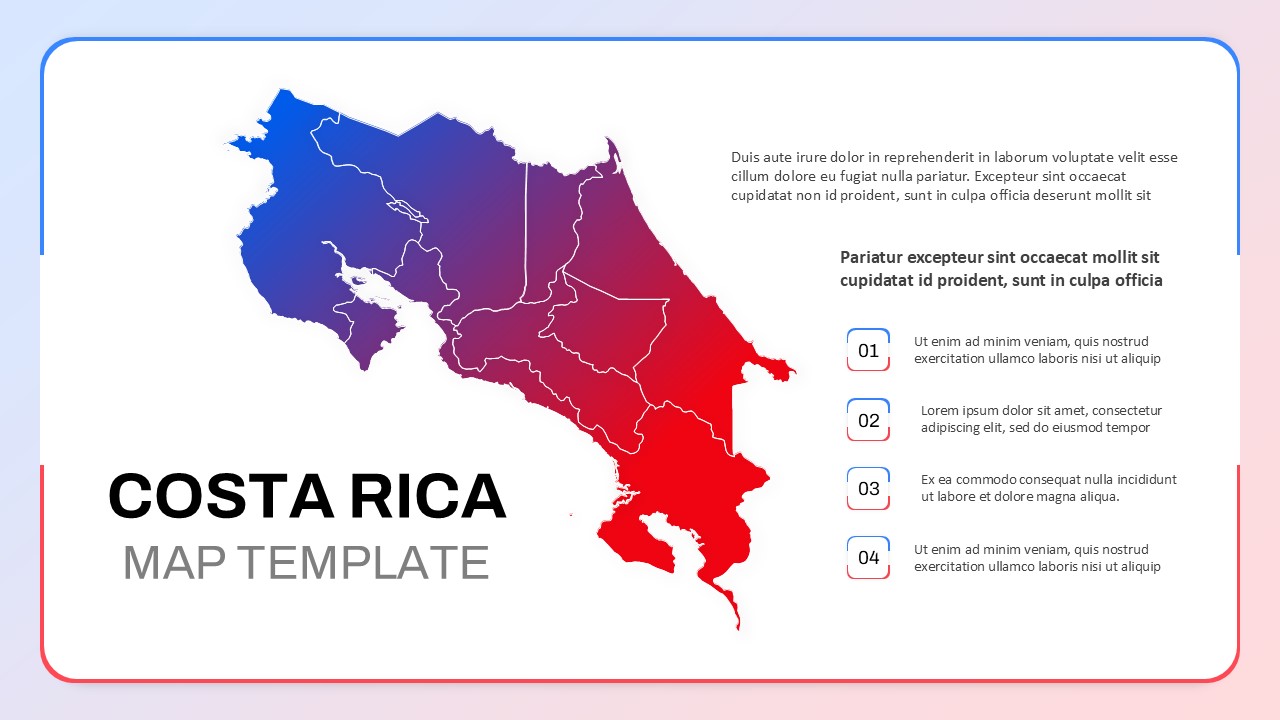
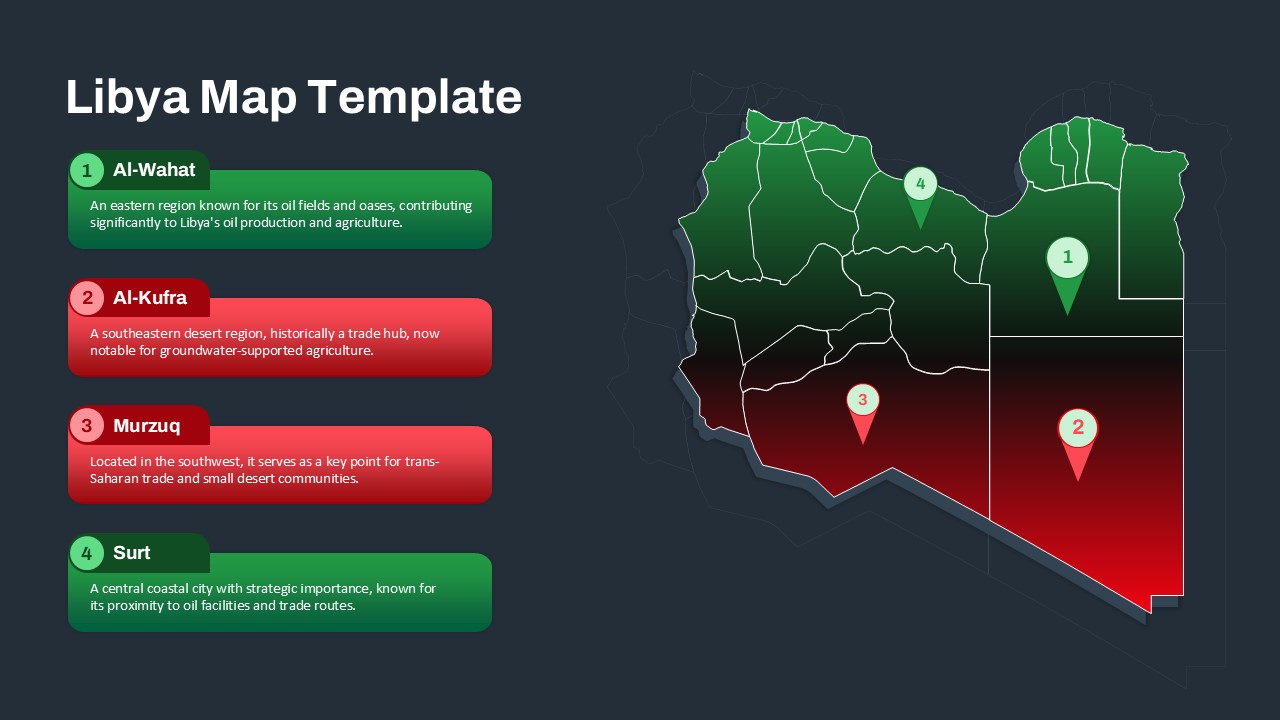
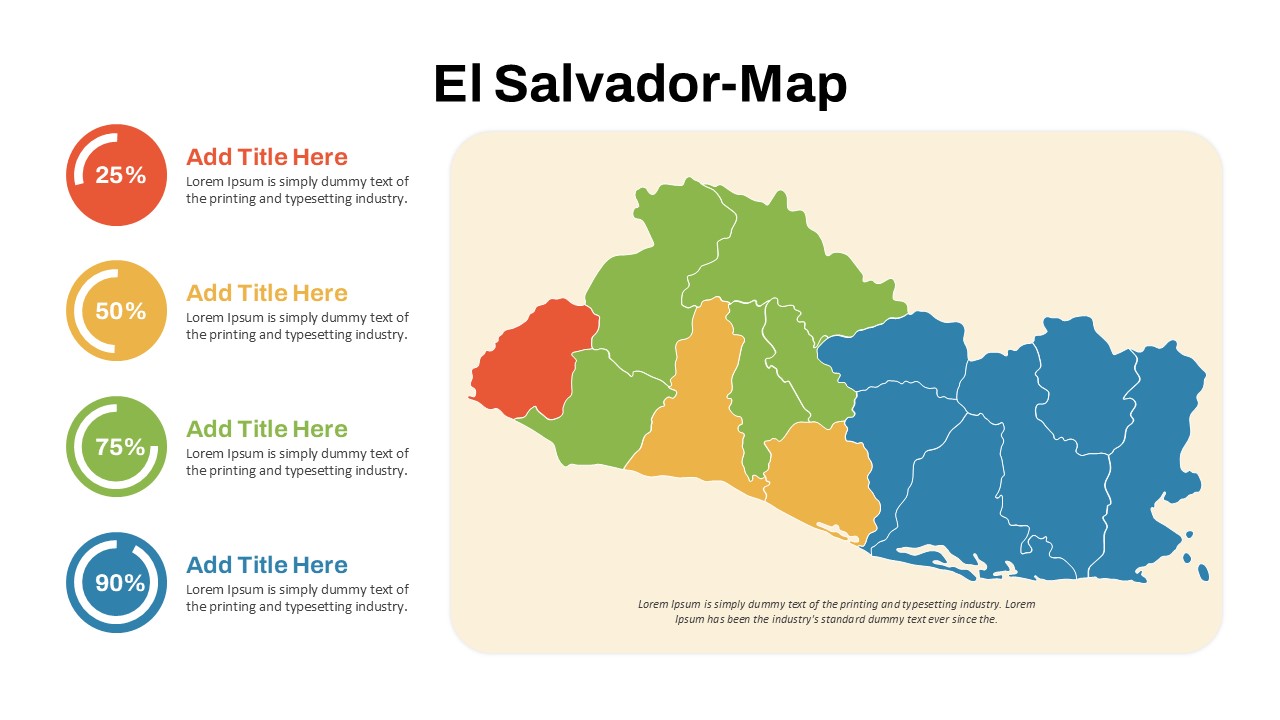
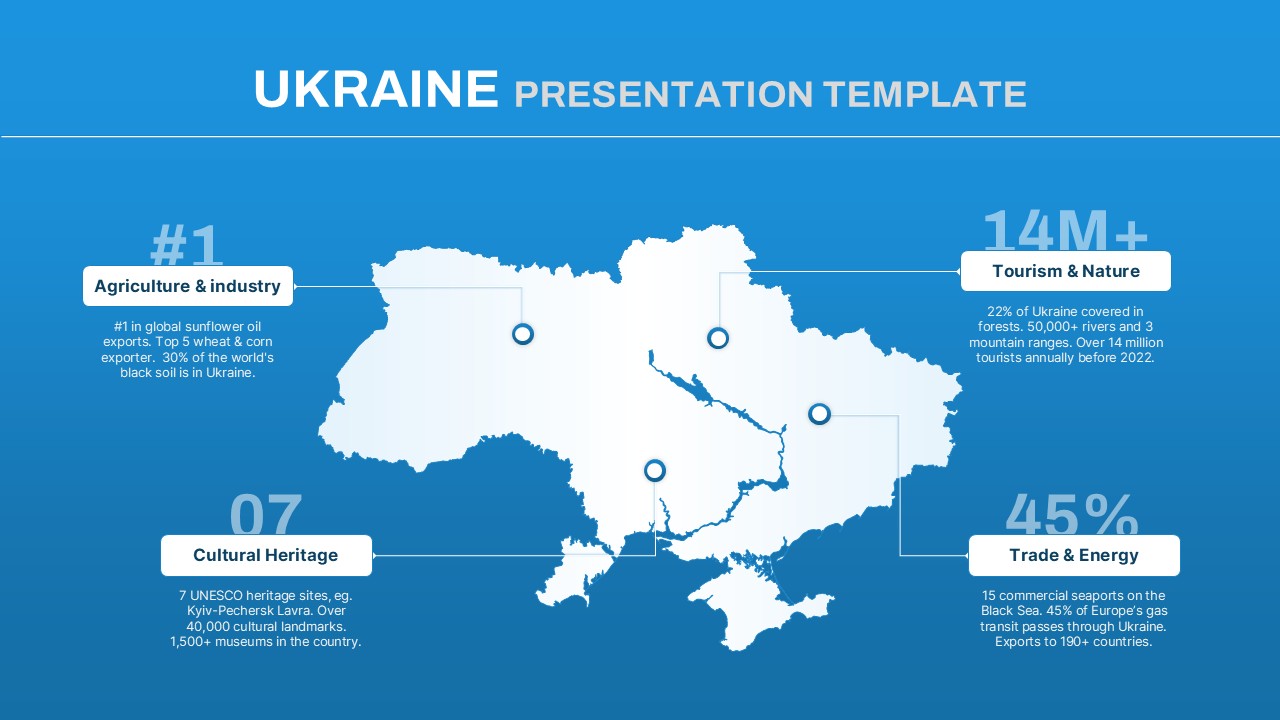
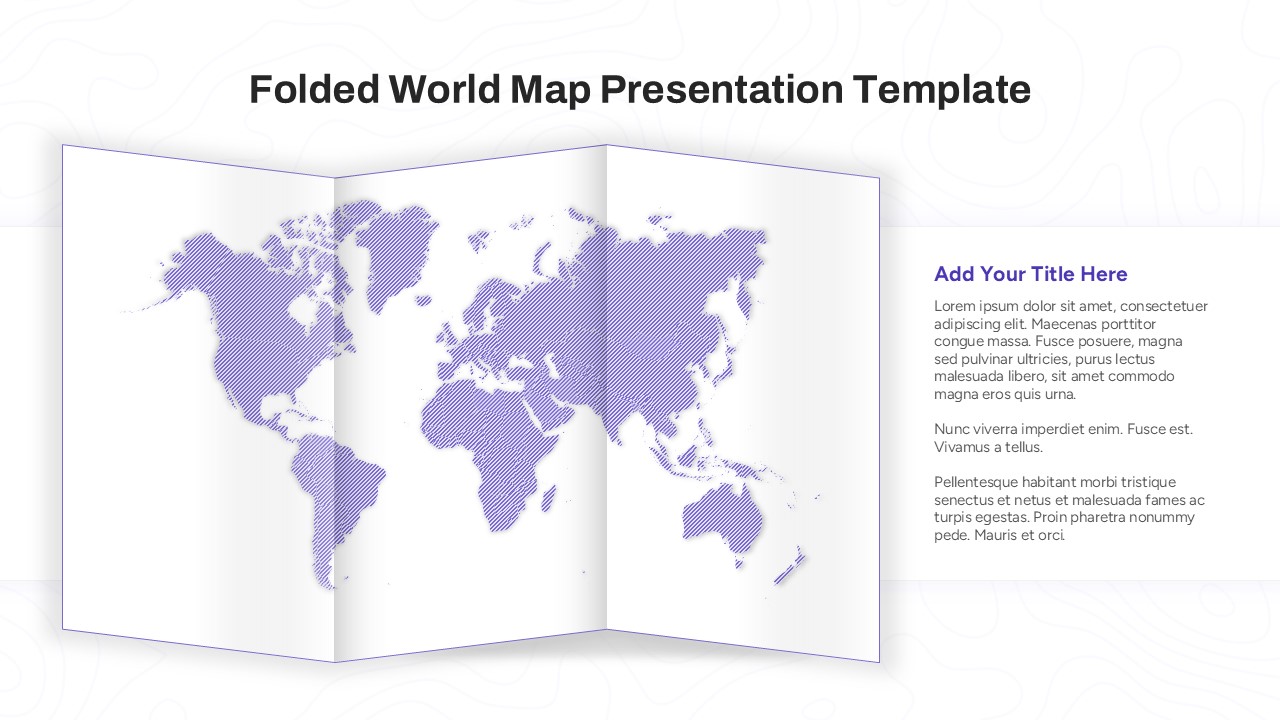
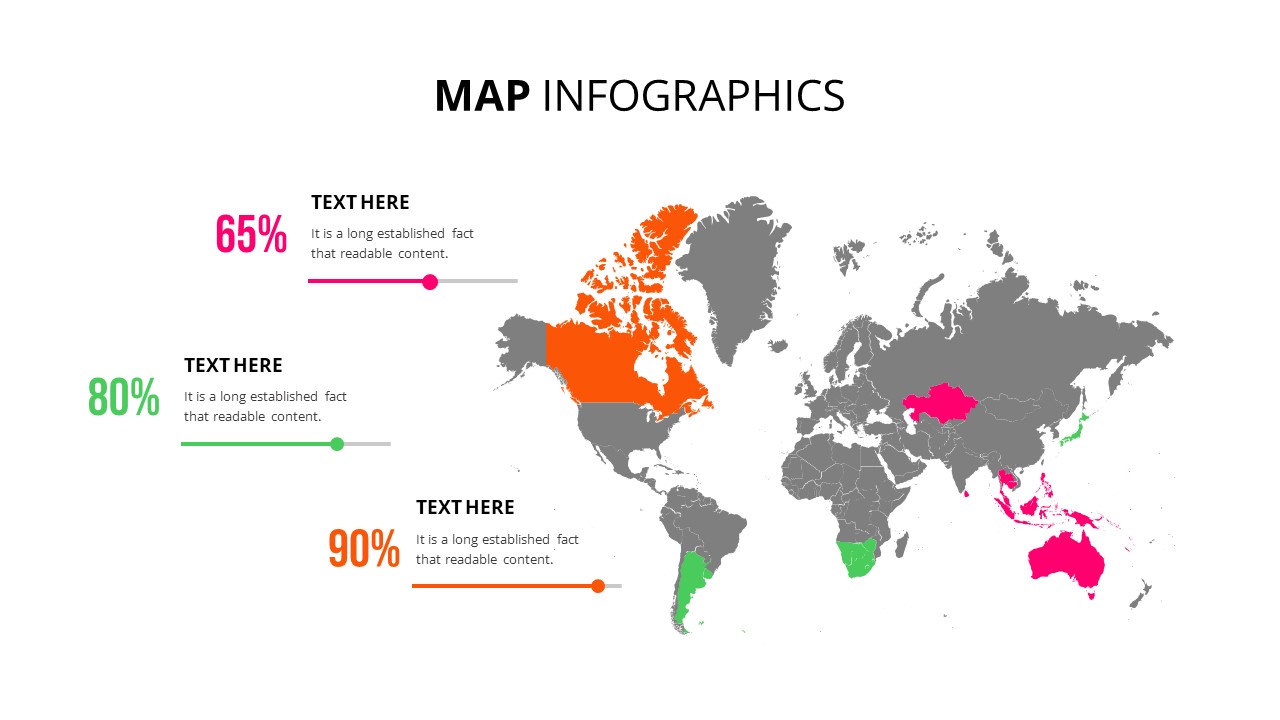
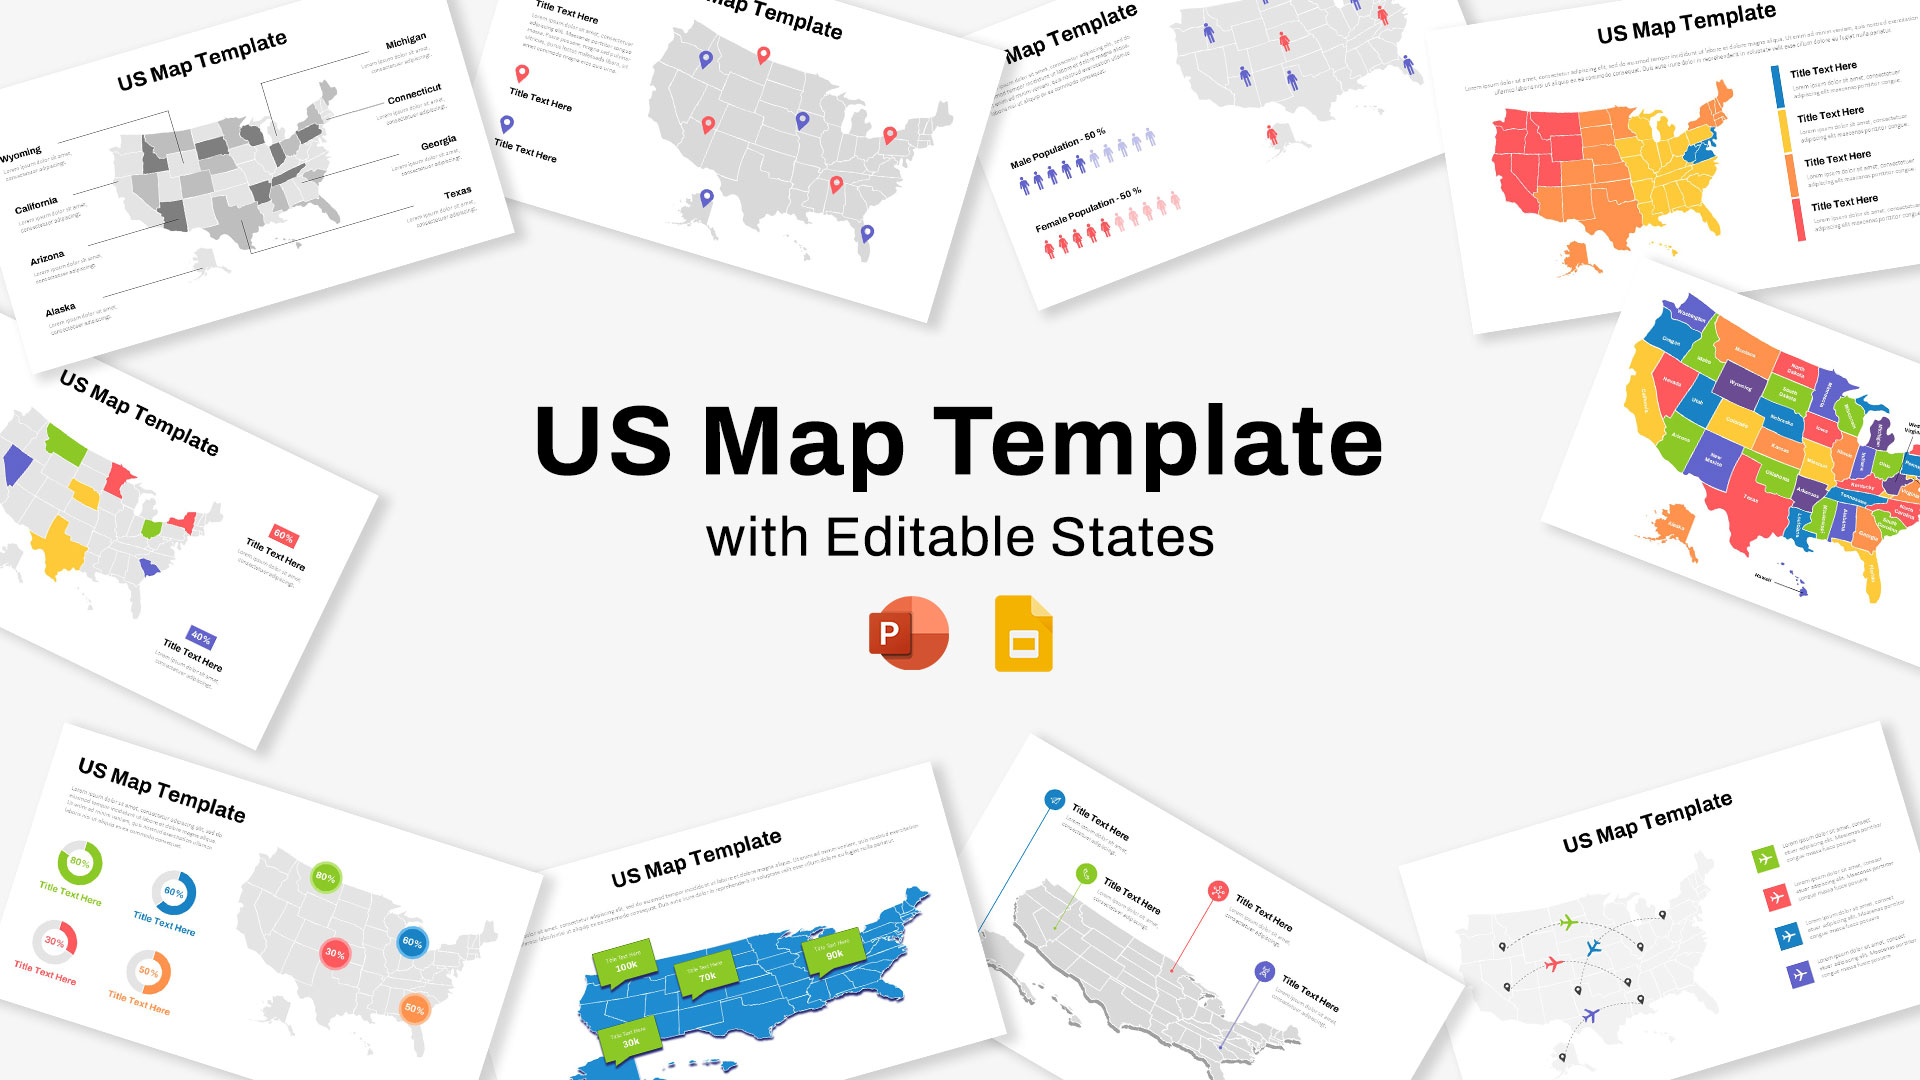
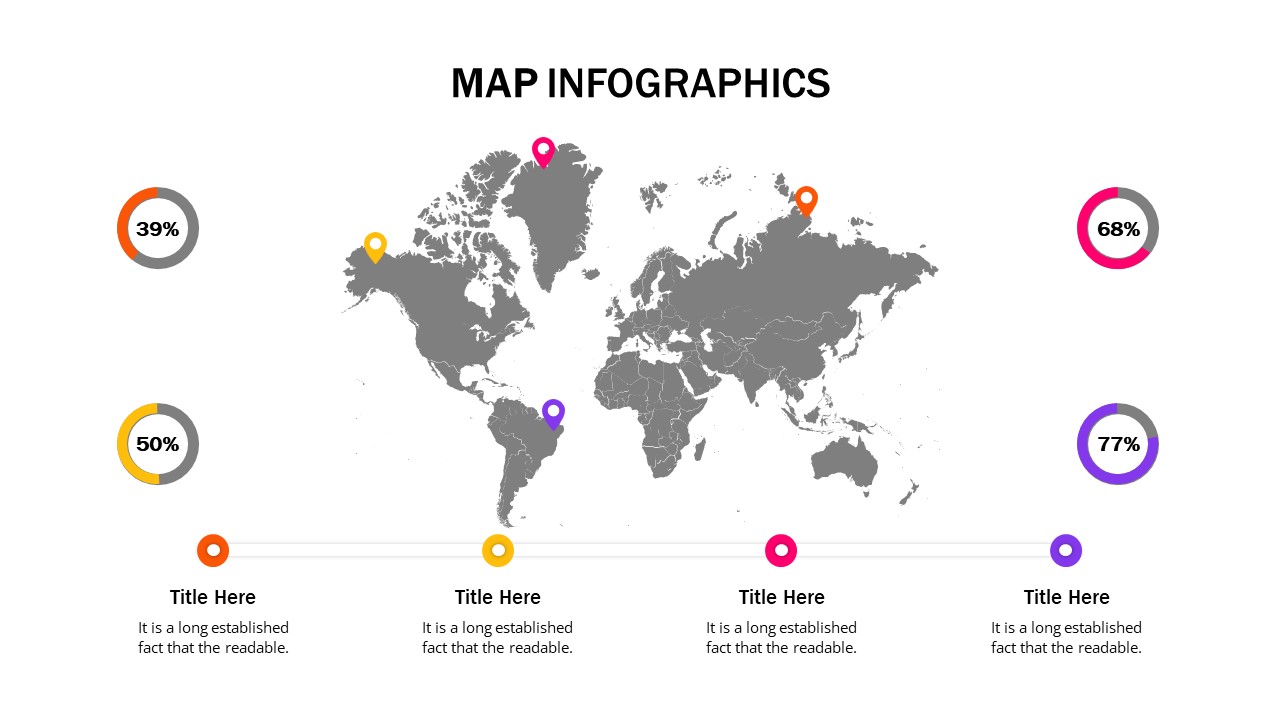
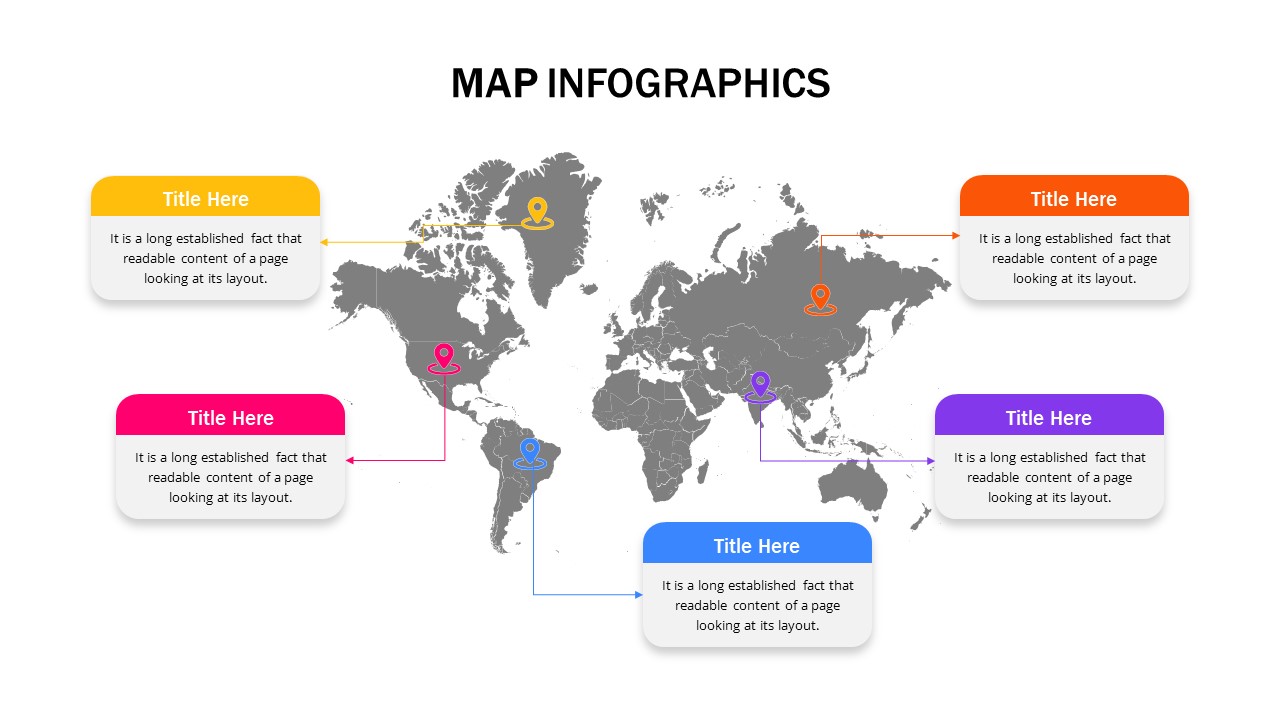
The Bahamas Map Presentation Template is a professional and visually engaging tool designed for geographical analysis, business expansion, tourism insights, and regional data presentation related to the Bahamas. Featuring a color-coded map, this map PowerPoint and Google Slides template highlights different regions with customizable data points, making it ideal for showcasing economic trends, tourism statistics, or market segmentation.
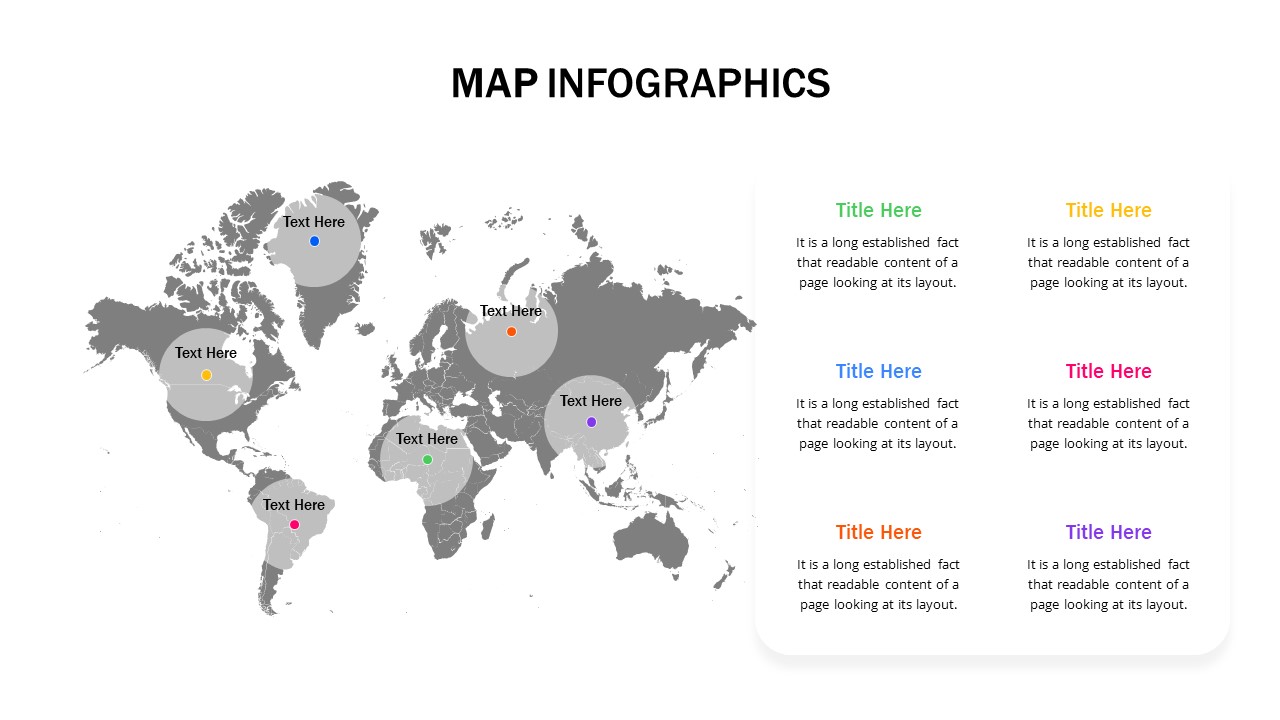
This modern, high-contrast design allows businesses, educators, and policymakers to effectively visualize regional differences while presenting insights on population density, travel hotspots, economic hubs, and strategic opportunities.
Key Features:
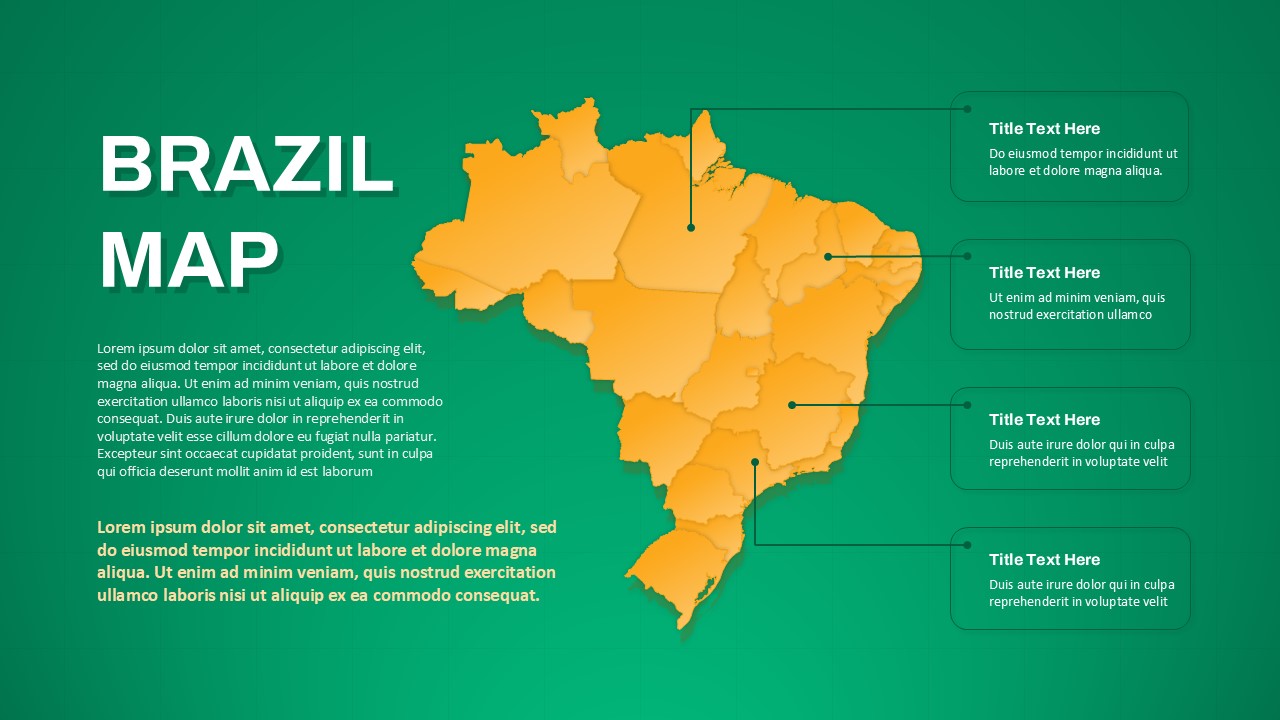
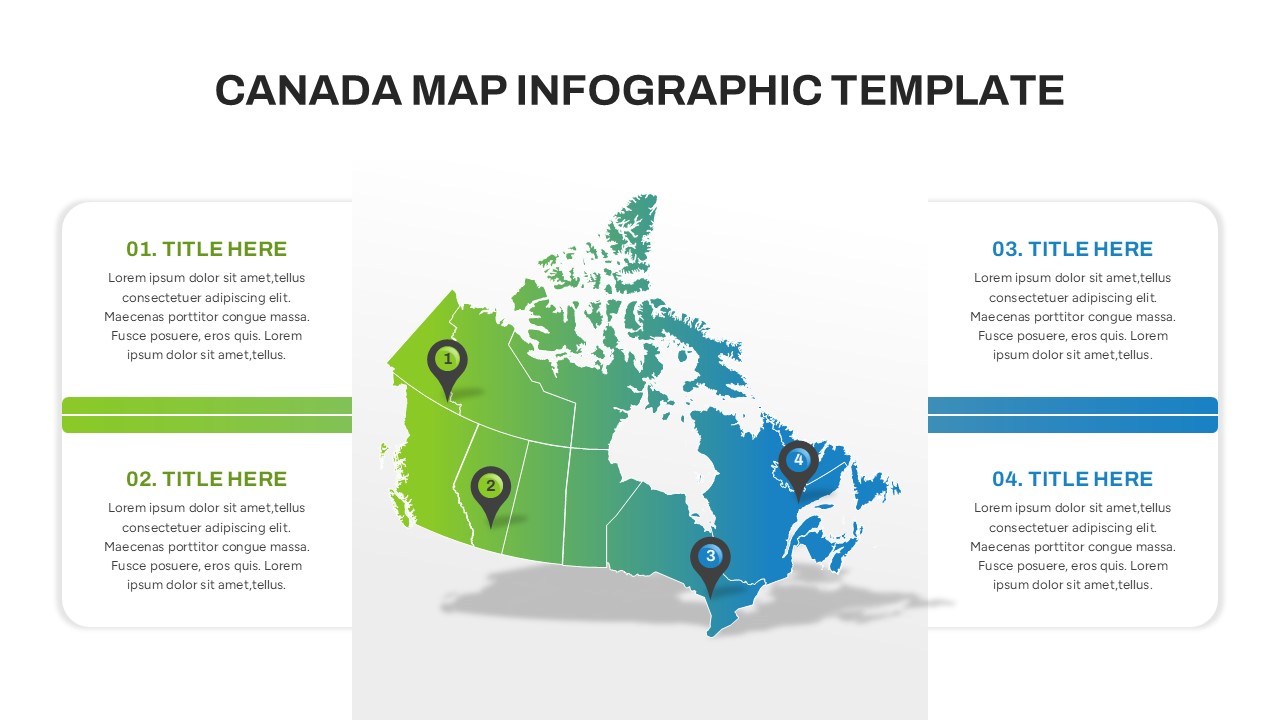
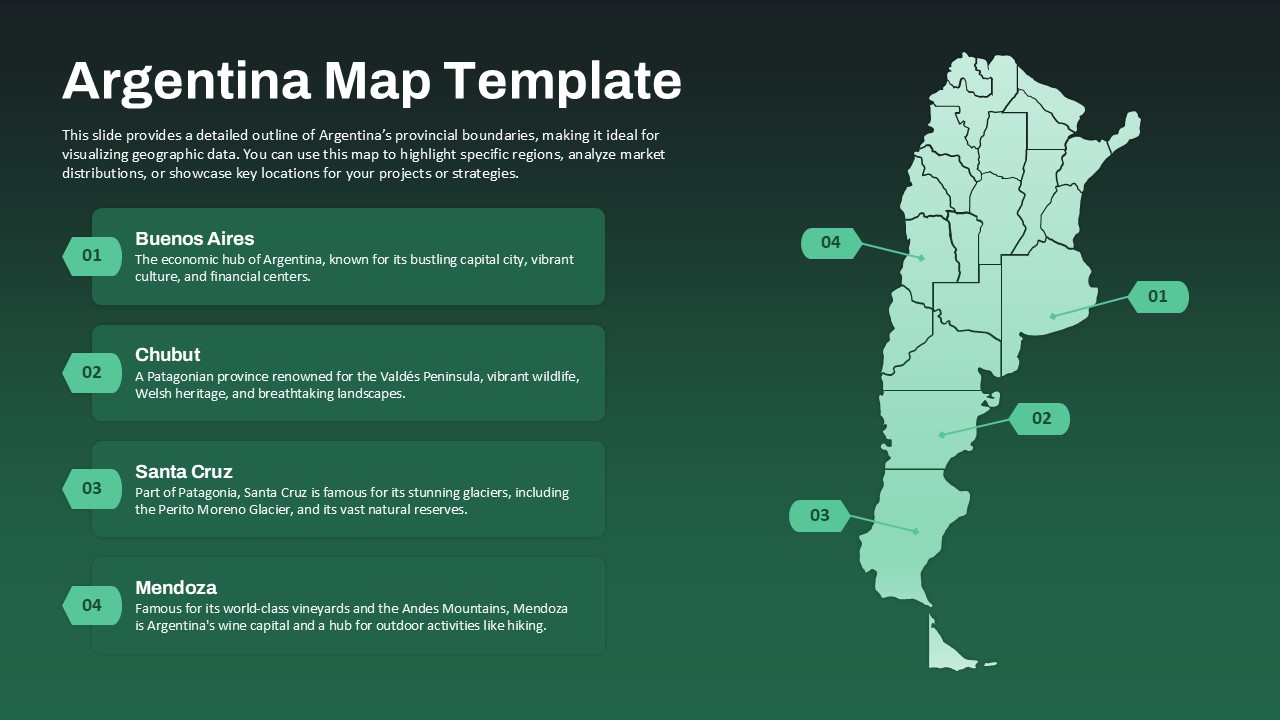
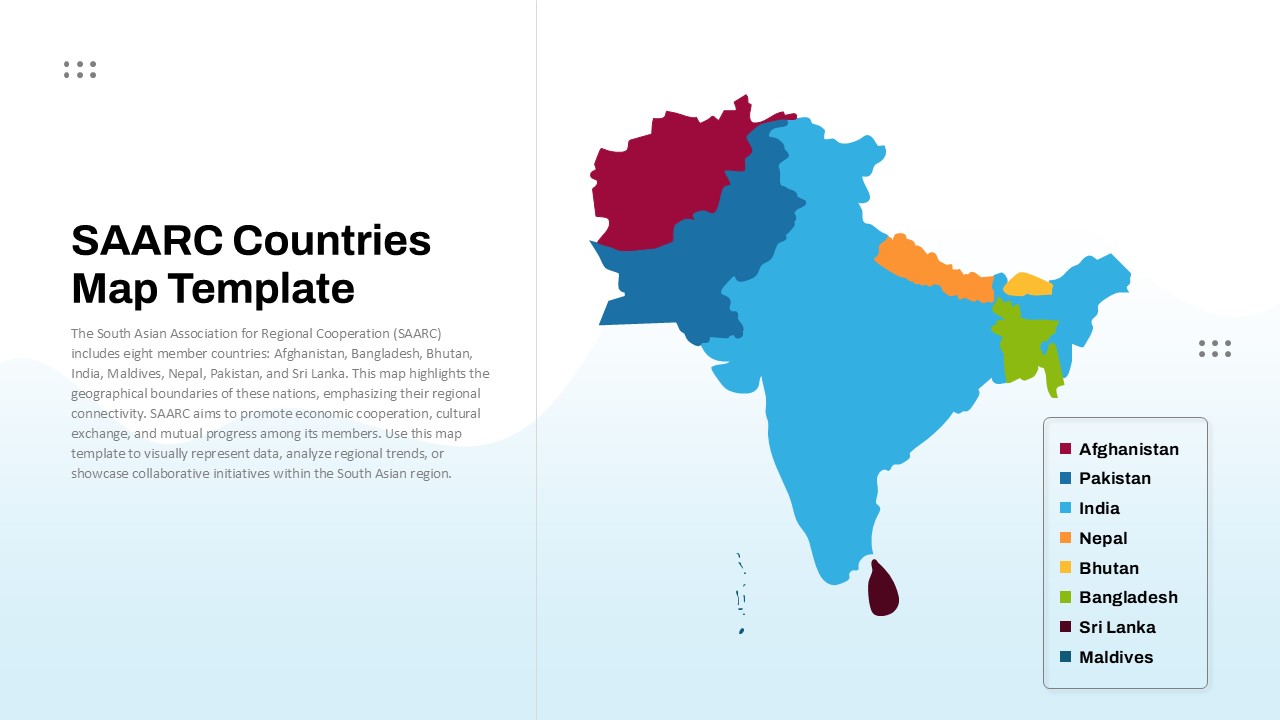
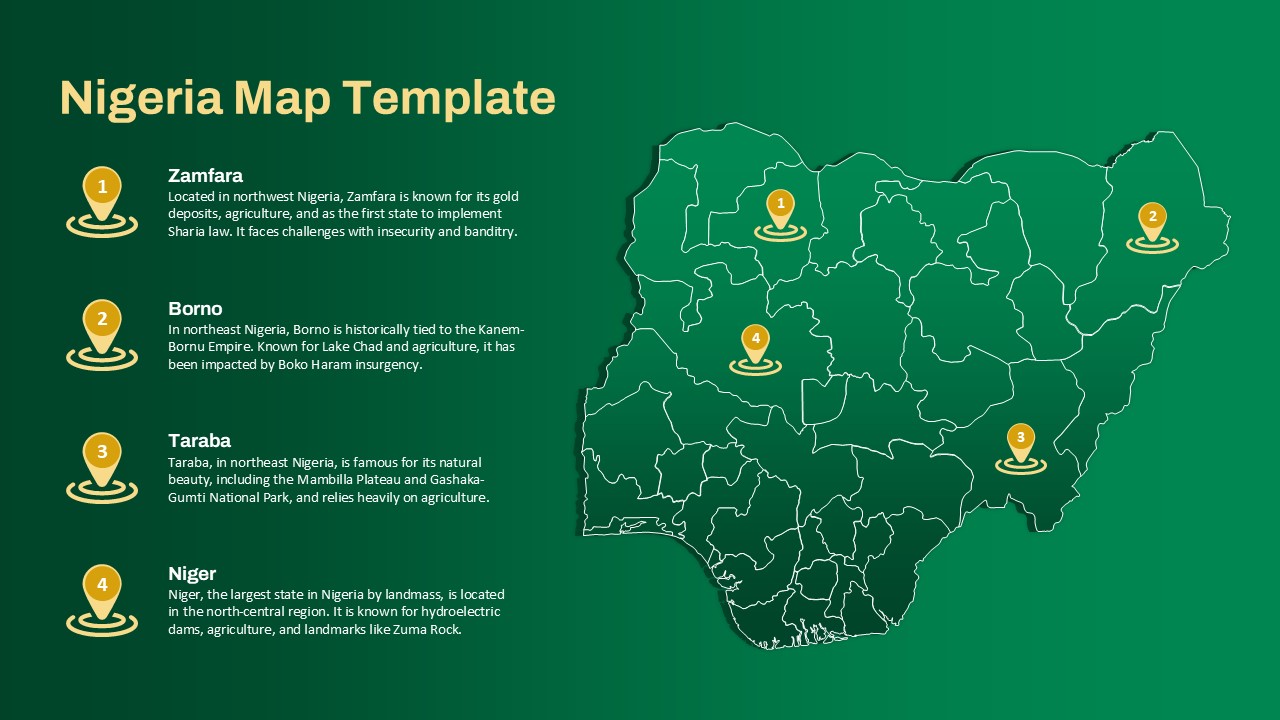
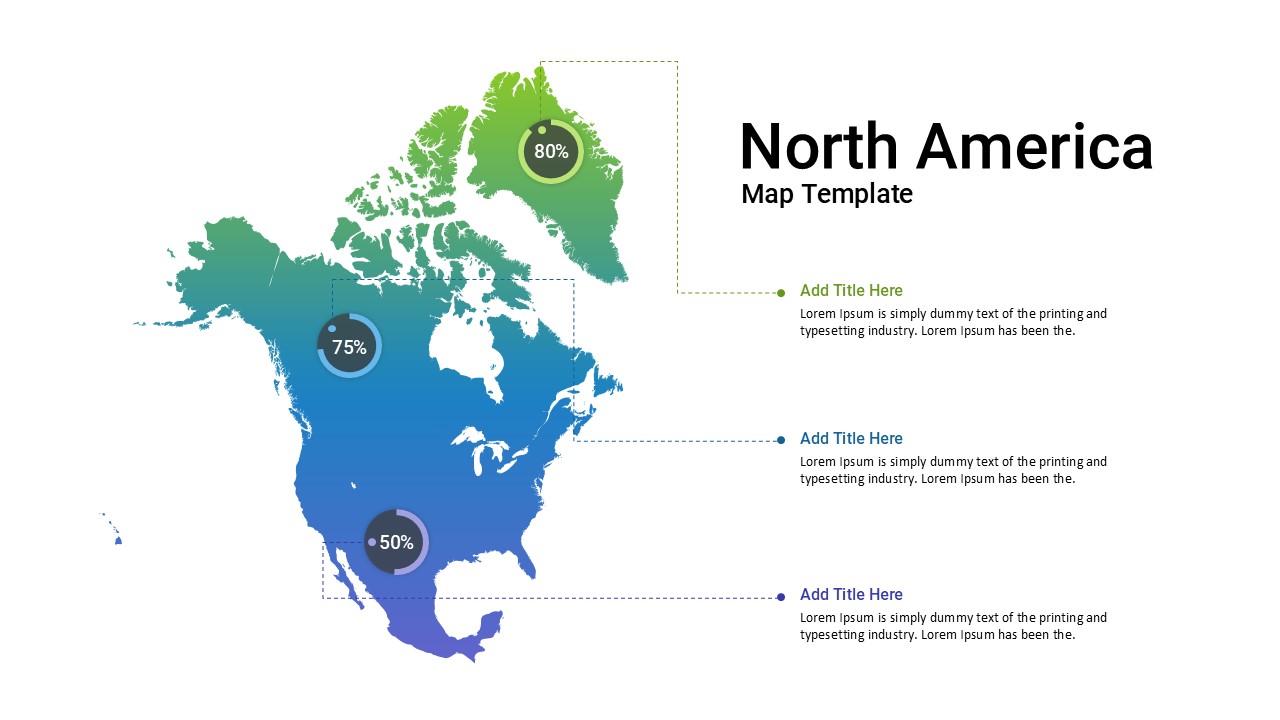
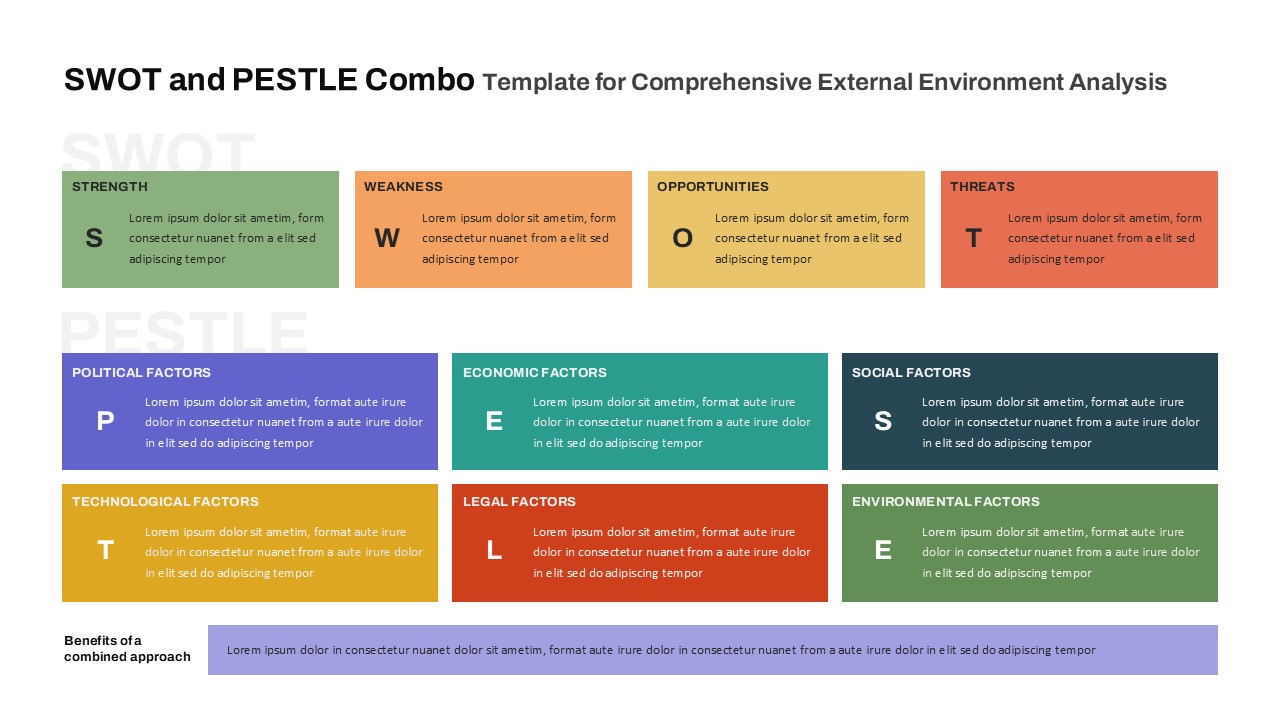
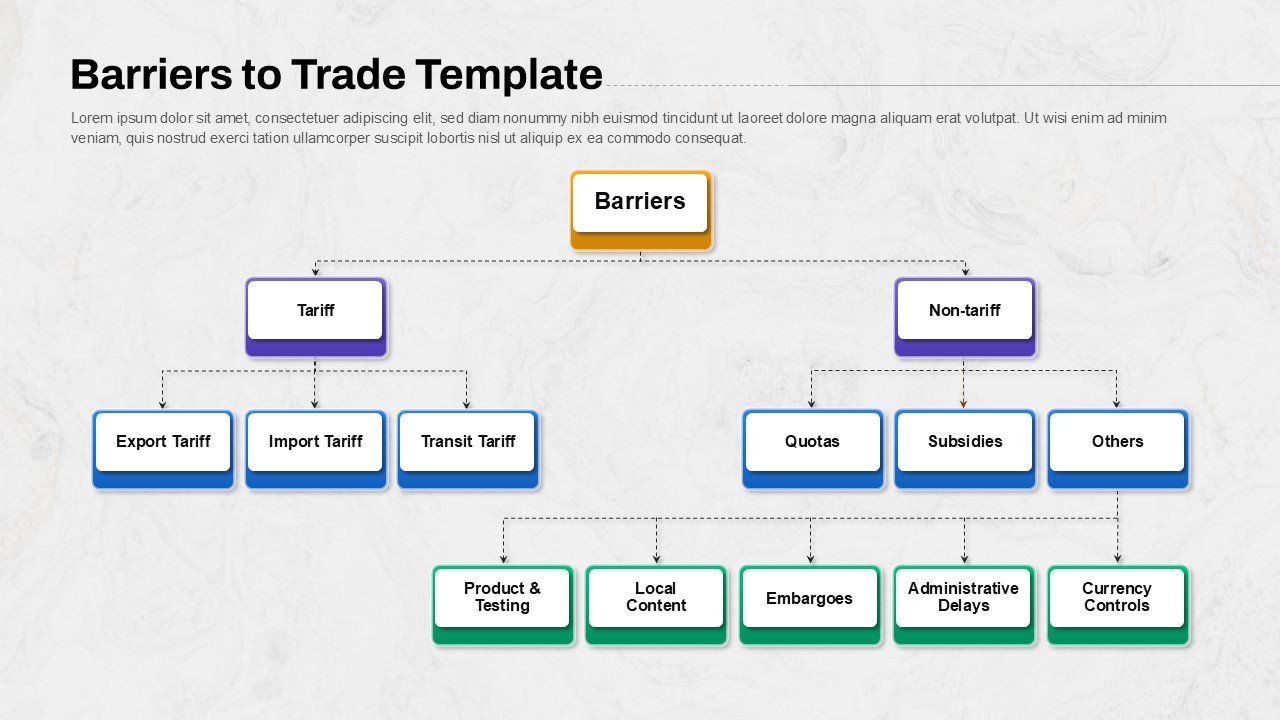
Detailed Bahamas Map with Customizable Regions – Highlight key areas for tourism, business, or economic data
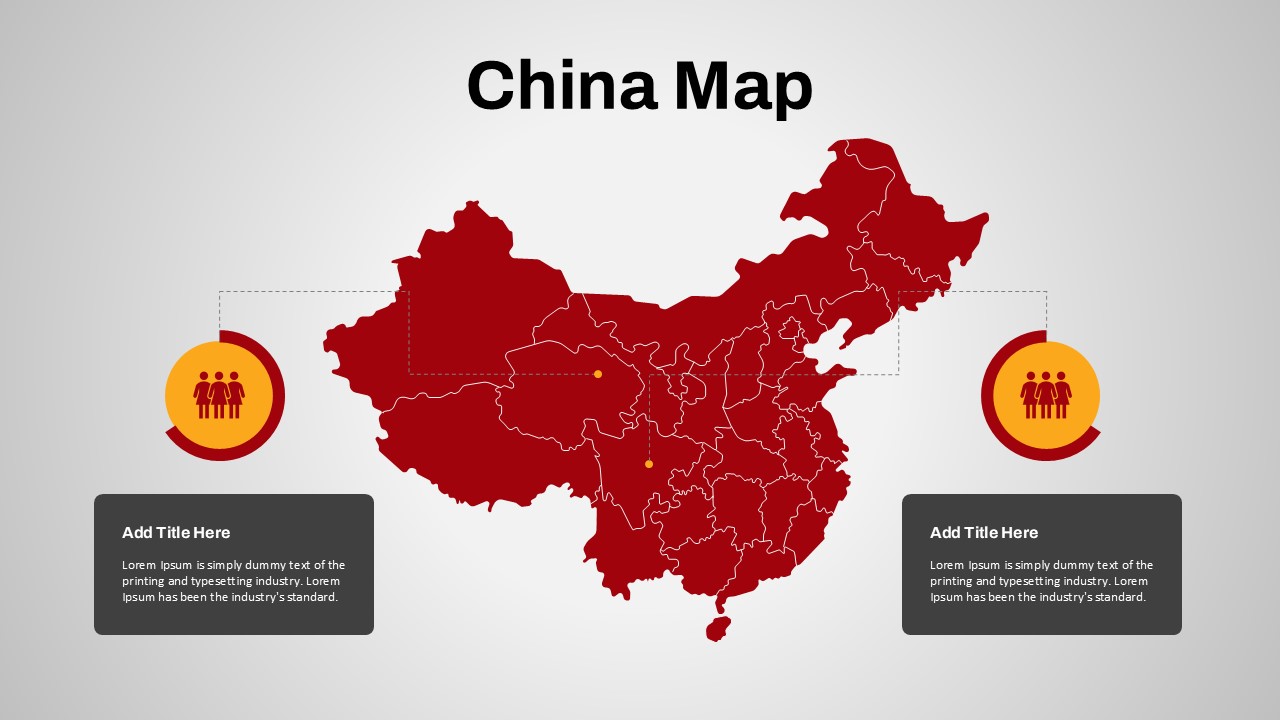
Color-Coded Sections – Clearly differentiate different regions with unique colors
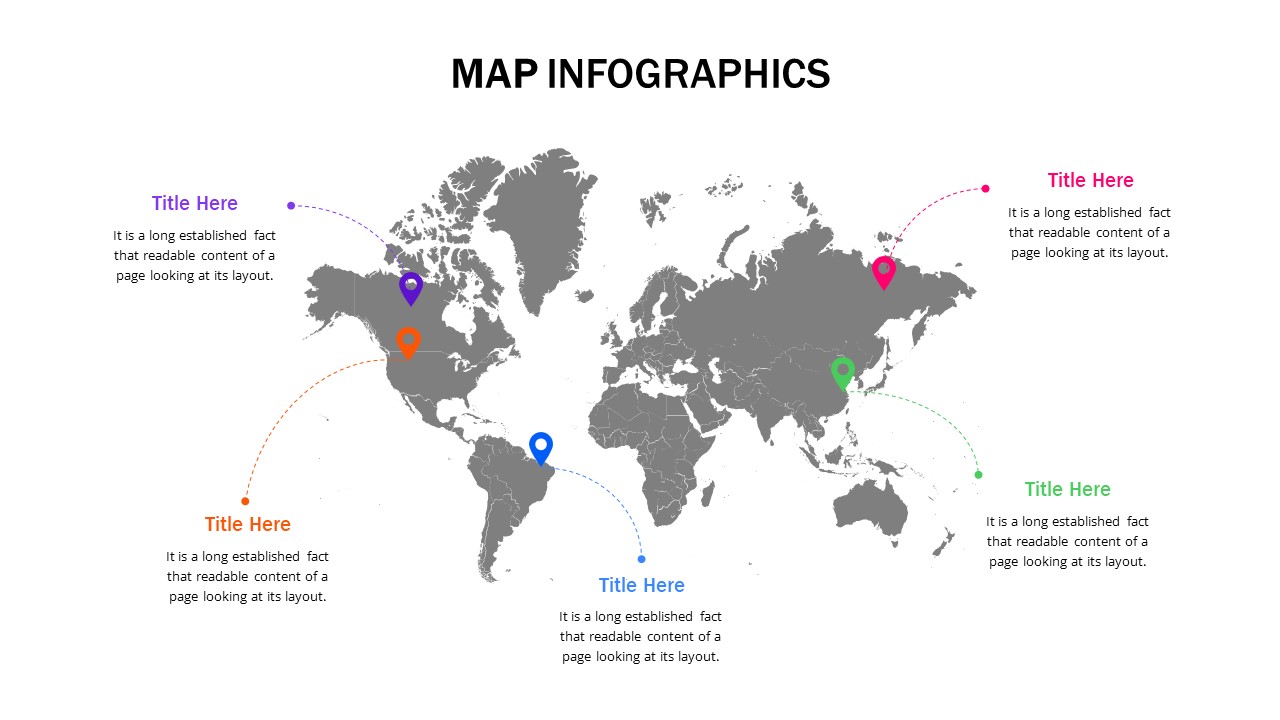
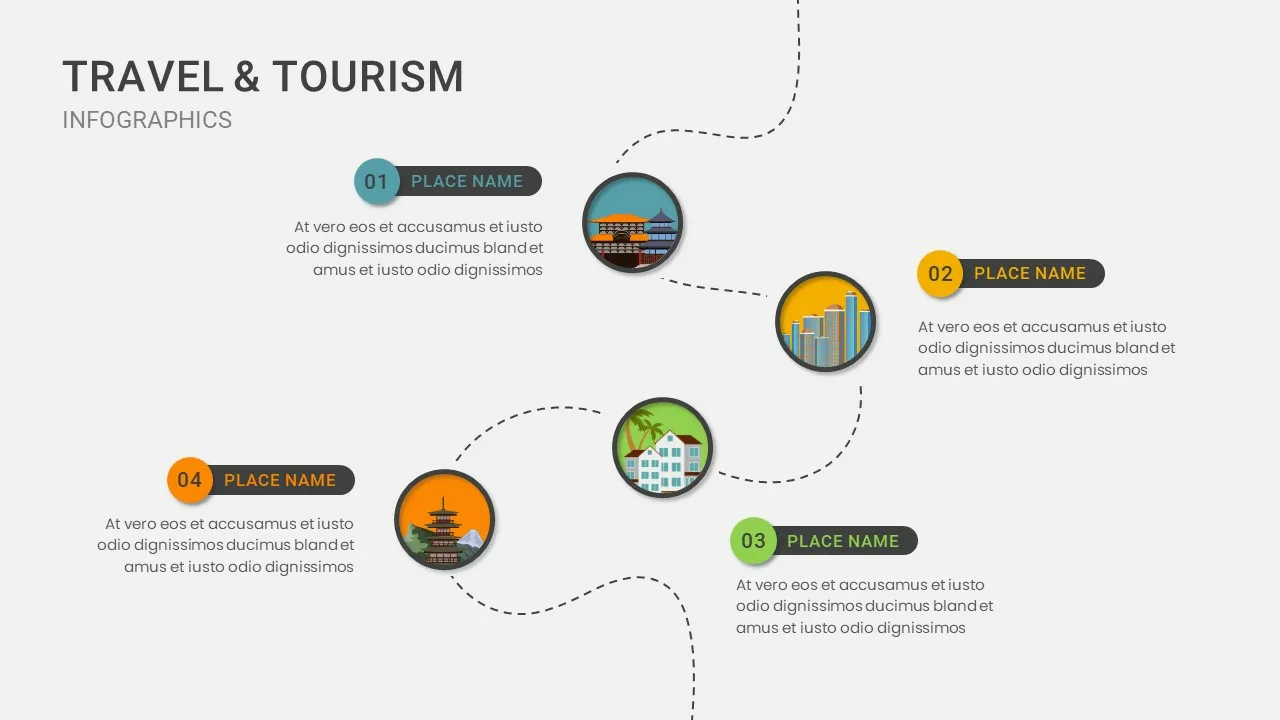
Editable Infographic Labels – Modify text, icons, and colors to fit your data needs
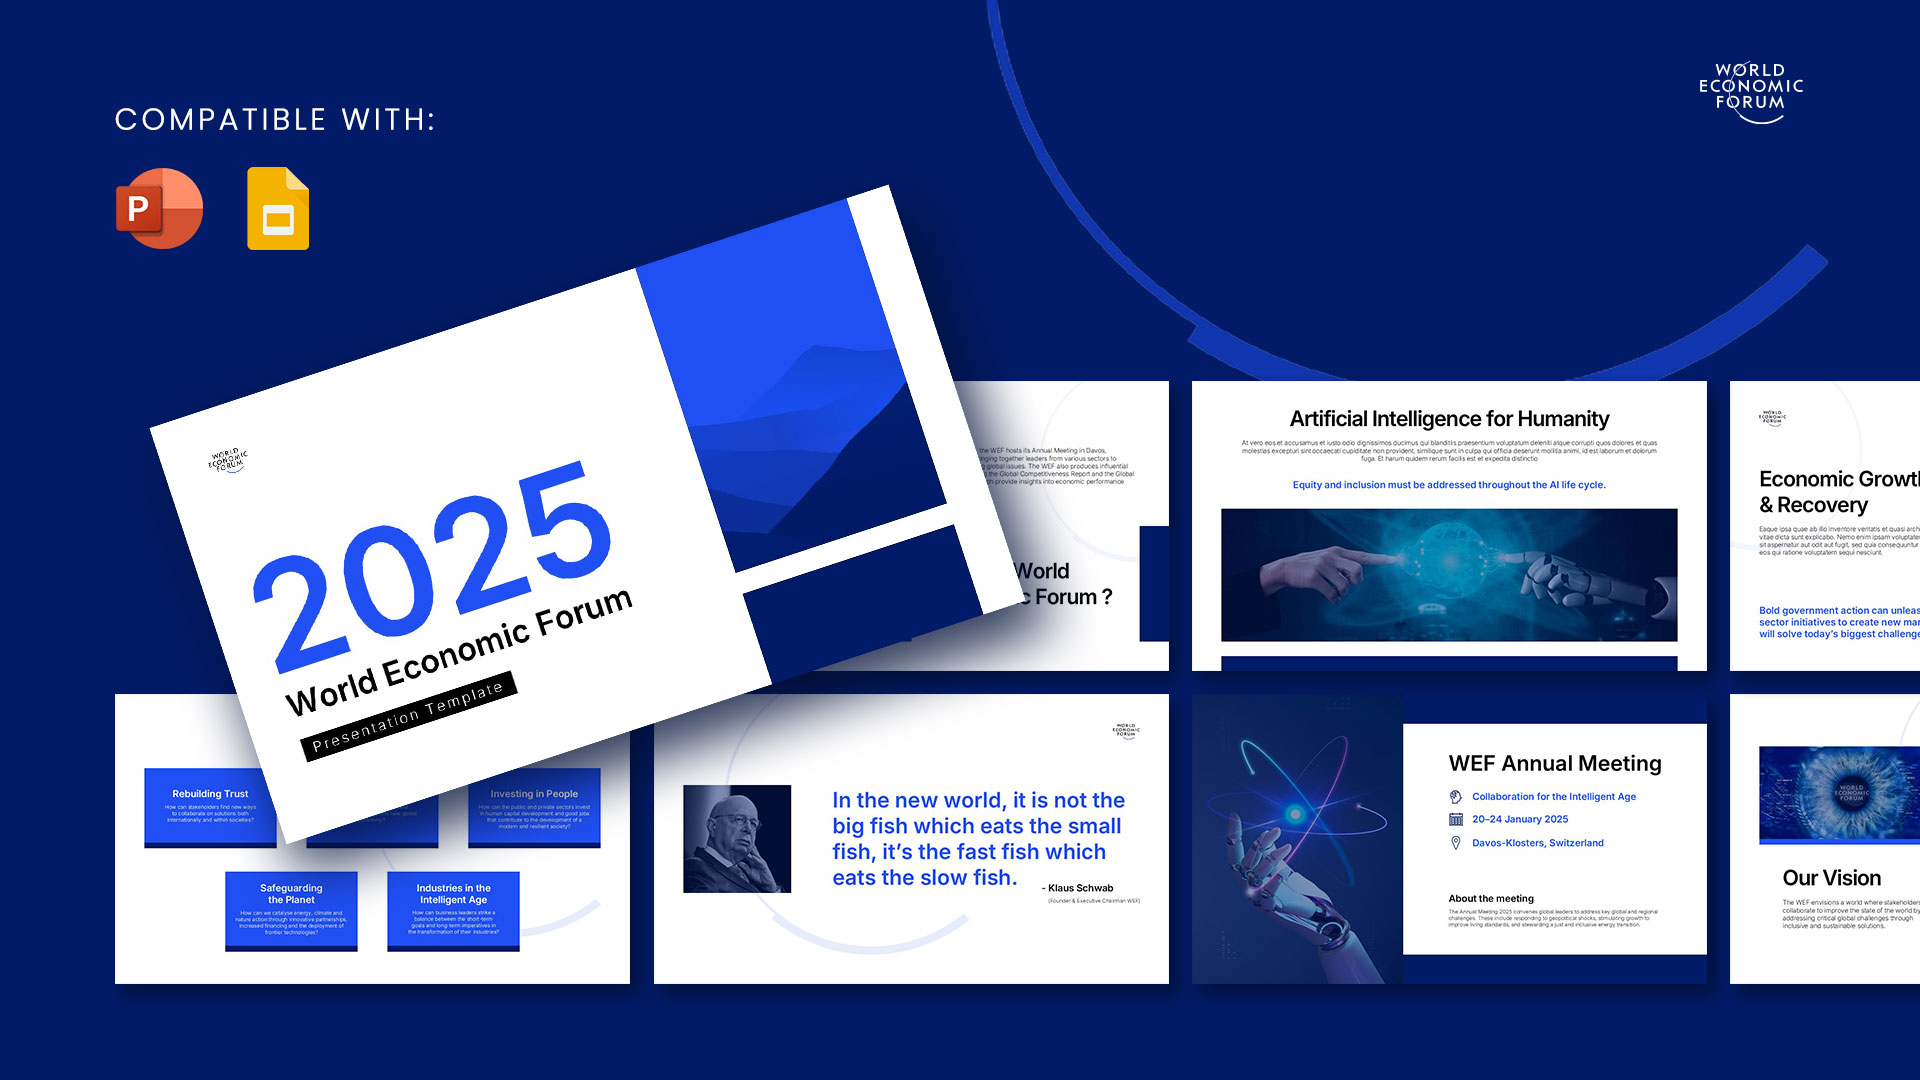
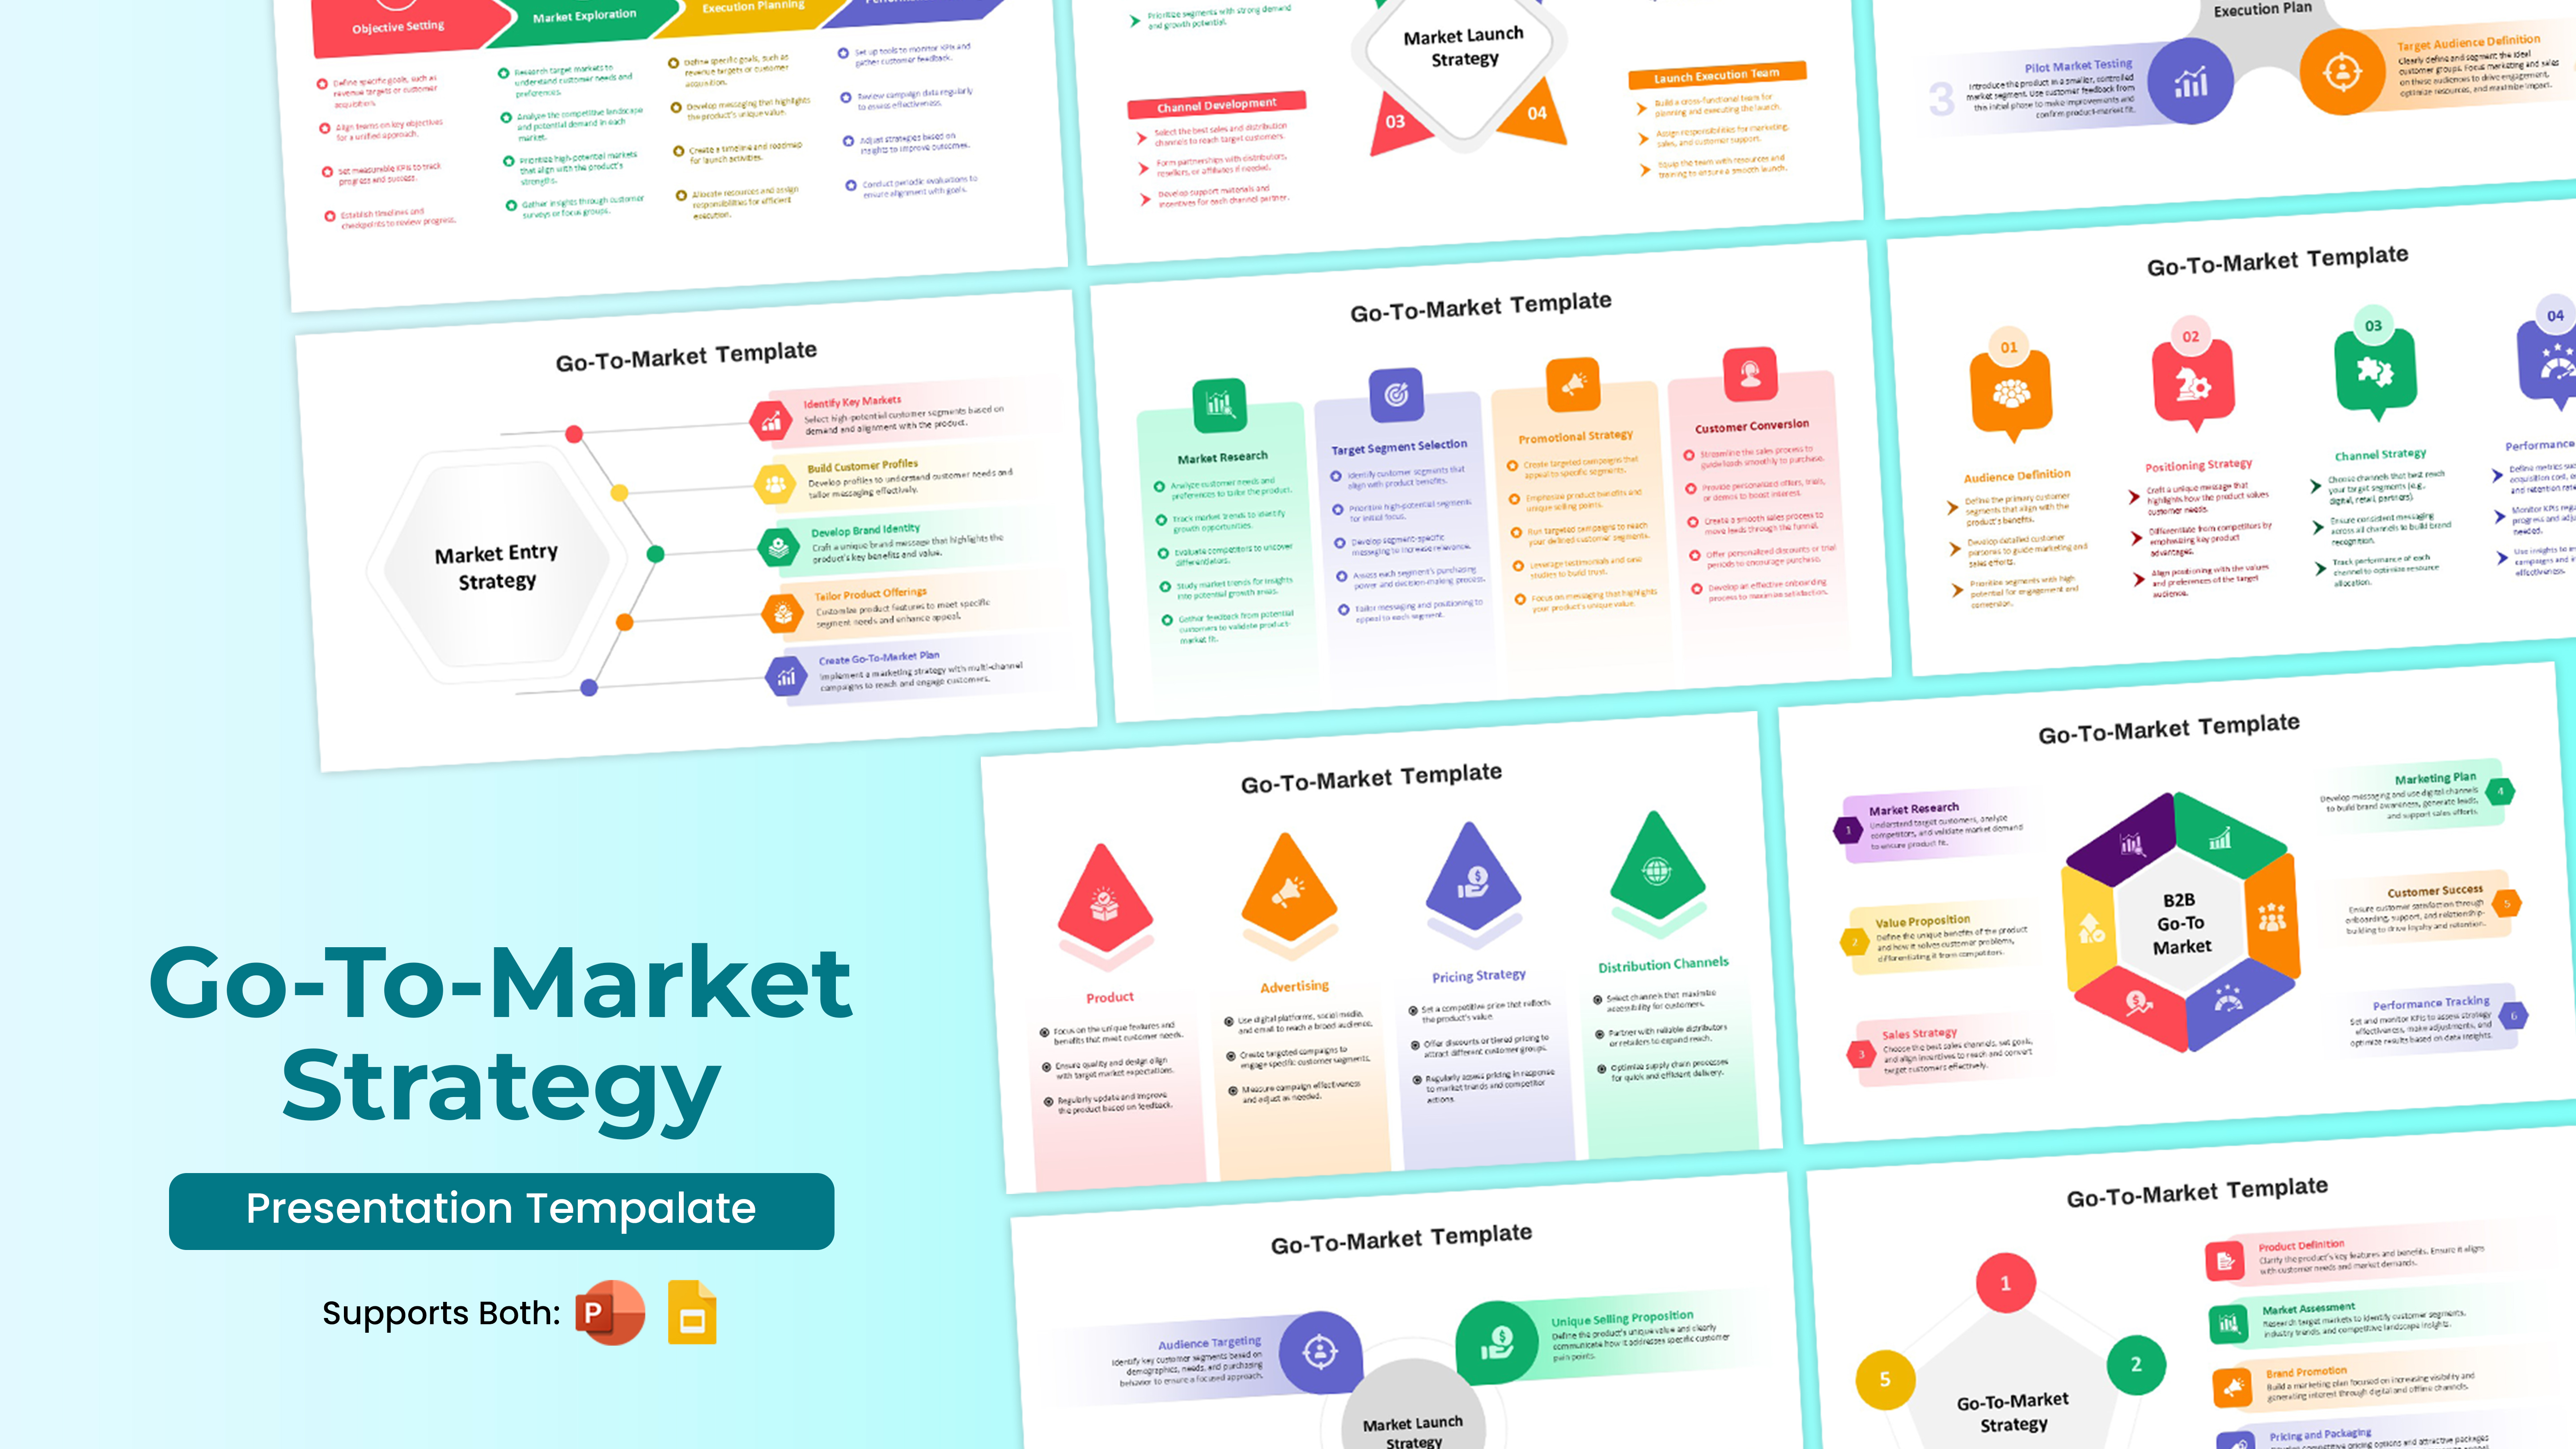
PowerPoint & Google Slides Compatibility – Easily adaptable for different presentation formats
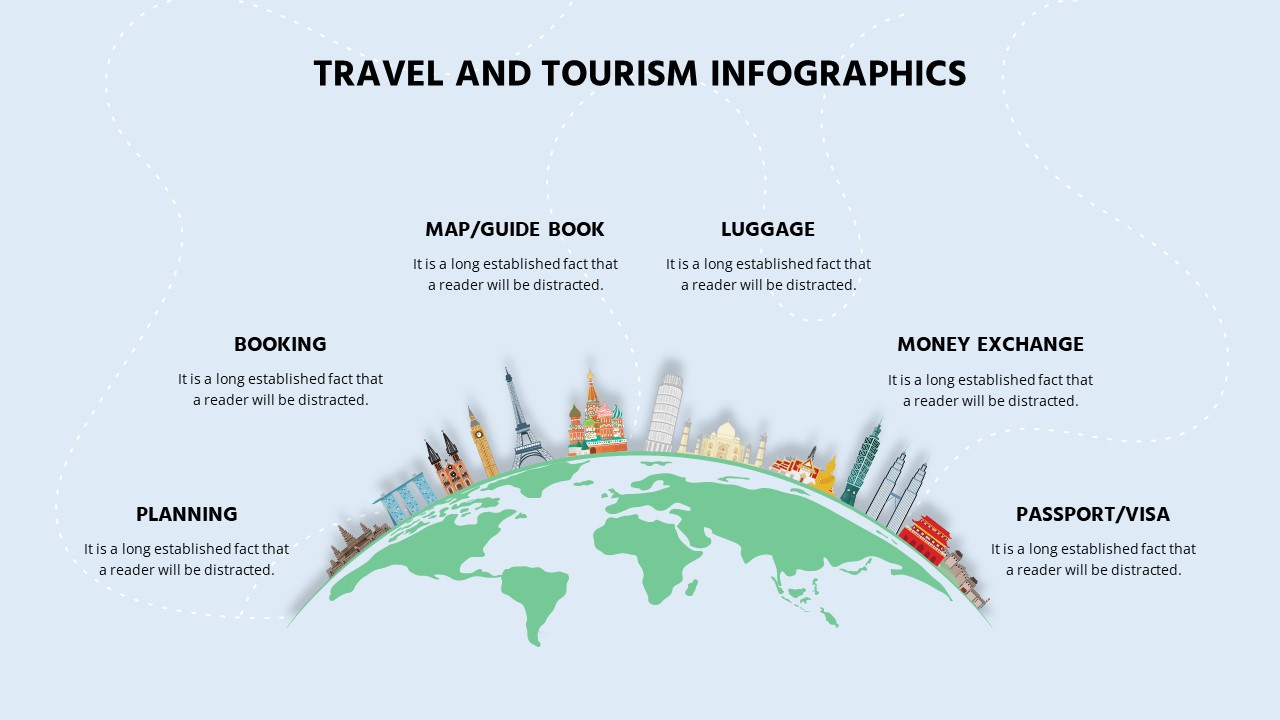
Perfect for government agencies, travel companies, market researchers, and educational institutions, this template helps present tourism statistics, business investments, regional policies, or real estate insights in an organized and visually appealing manner. Whether you’re analyzing market potential, planning a business expansion, or showcasing demographic data, the Bahamas Map Infographics Presentation Template provides an impactful and data-driven way to present key information.
See more

Aspect Ratio
16:9Item ID
SKT03256
Features of this template
Other Use Cases of the Template:
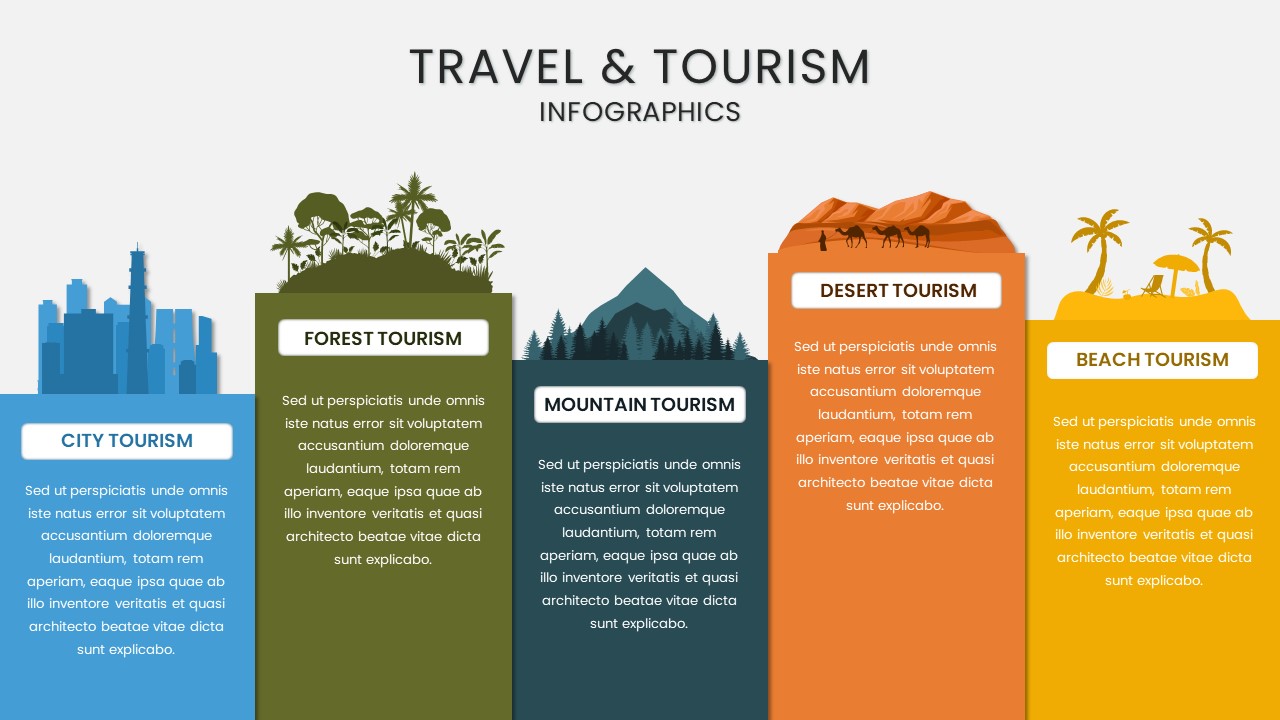
Tourism industry reports, business expansion strategy, real estate market analysis, economic development planning, regional investment mapping, government policy presentations, logistics and supply chain planning, demographic research, educational geography lessons, travel and hospitality industry insights.
FAQs
You May Also Like These Presentation Templates


- Free

- Free


- Free
- Free
- Free


- Free
- Free