Benchmark Template For PowerPoint

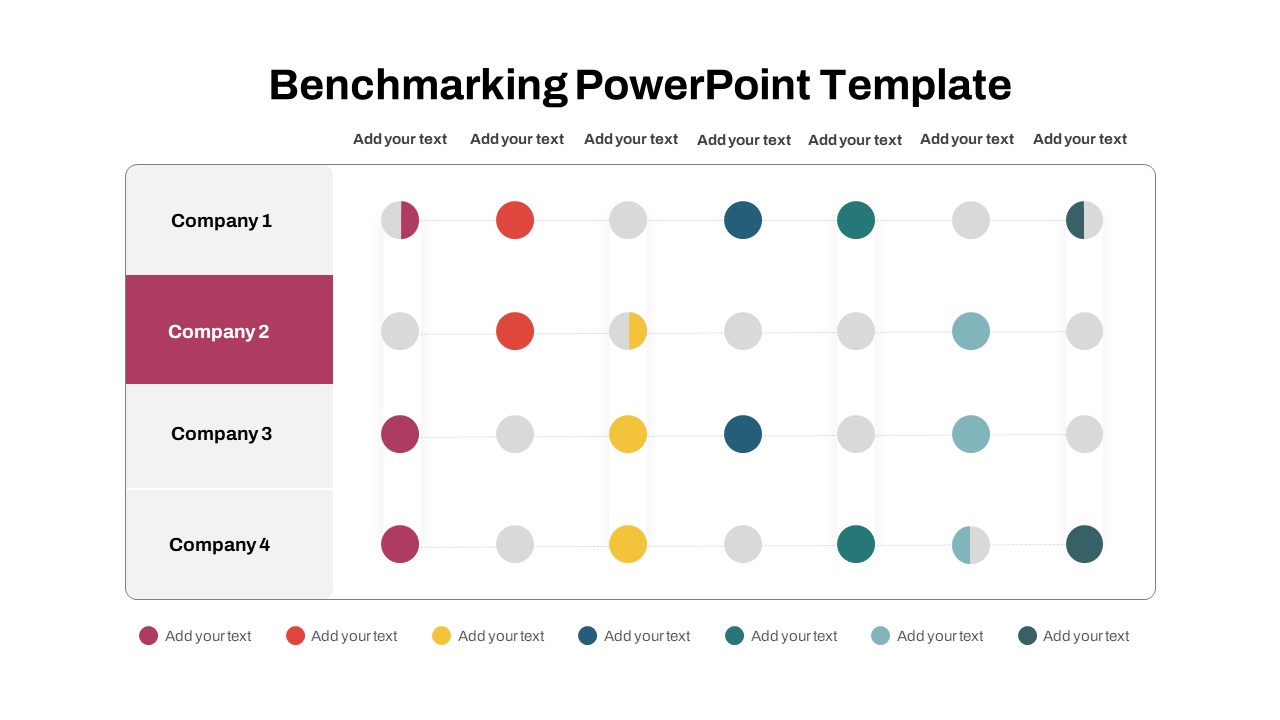
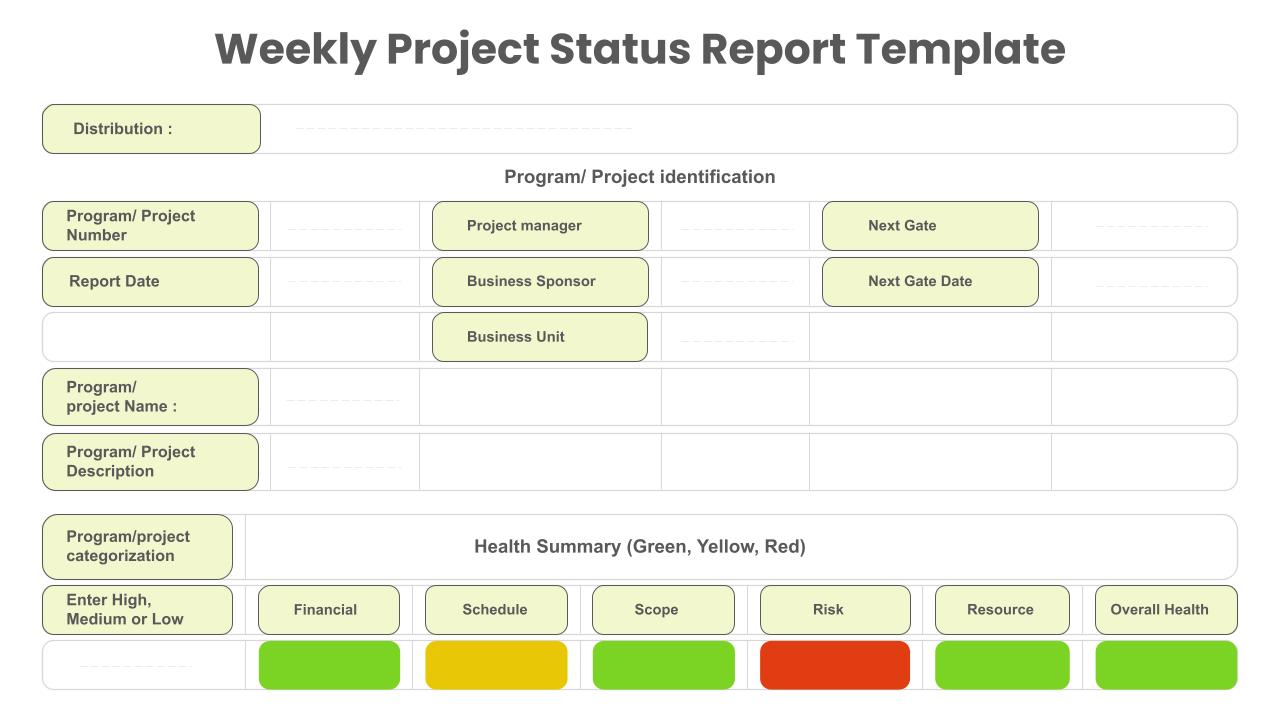
The Benchmarking PowerPoint Template is an ideal tool for organizations looking to compare performance metrics, assess investment returns, or evaluate management strategies. With a clean and structured layout, this template presents data in a clear, easy-to-understand format. The chart is divided into four key categories: Target, Investment, Performance, and Management, each with color-coded bars and ranking metrics. It allows users to effectively display performance scores, rank comparisons, and areas for improvement at a glance.
The visual bar charts help illustrate the relative performance of each category, while the score ratings (A, B, C, D, E) provide an intuitive evaluation system. This format is perfect for corporate meetings, project reviews, or strategy sessions, where data benchmarking is critical for making informed decisions. The ranking system on the right side gives a quick view of each category’s standing, making it easier to analyze trends and areas of focus.
Fully customizable and compatible with PowerPoint and Google Slides, users can modify the content to match their data, colors, and specific needs. Whether you are presenting business performance, comparing different investment strategies, or assessing project success rates, this Benchmarking PowerPoint Template offers a professional and efficient way to present complex data.
See more

Aspect Ratio
16:9Item ID
SKT01278
Features of this template
Other User Cases of the Template:
Corporate performance reviews, investment strategy analysis, project success evaluation, KPI benchmarking, competitor analysis, financial performance comparisons, management efficiency assessments, and product performance reviews.
FAQs
You May Also Like These Presentation Templates


- Free
- Free
- Free

- Free

- Free
- Free
- Free

- Free
- Free