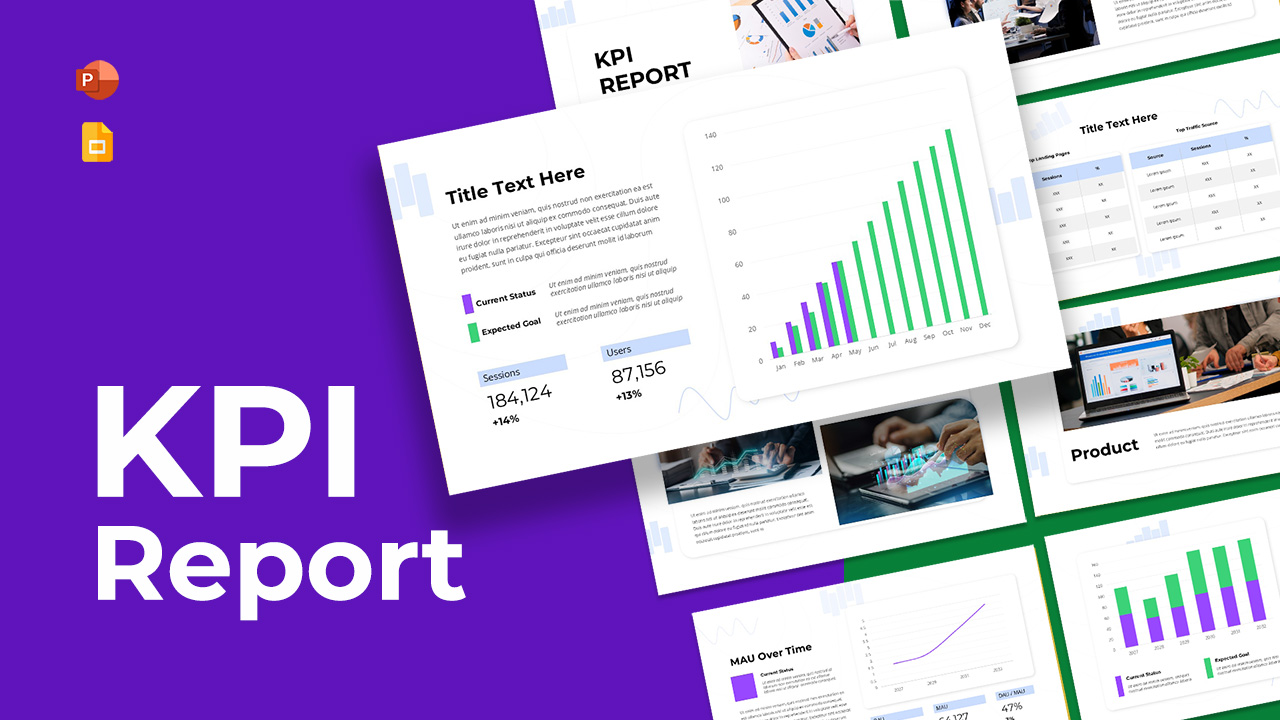
Business Growth Chart PowerPoint Template

The Business Growth Chart Template is a sleek and data-driven presentation tool designed to help professionals visually showcase financial progress, year-over-year growth, and key performance insights. With an elegant dark background and clean dual-chart layout, this template strikes the perfect balance between modern aesthetics and analytical clarity.
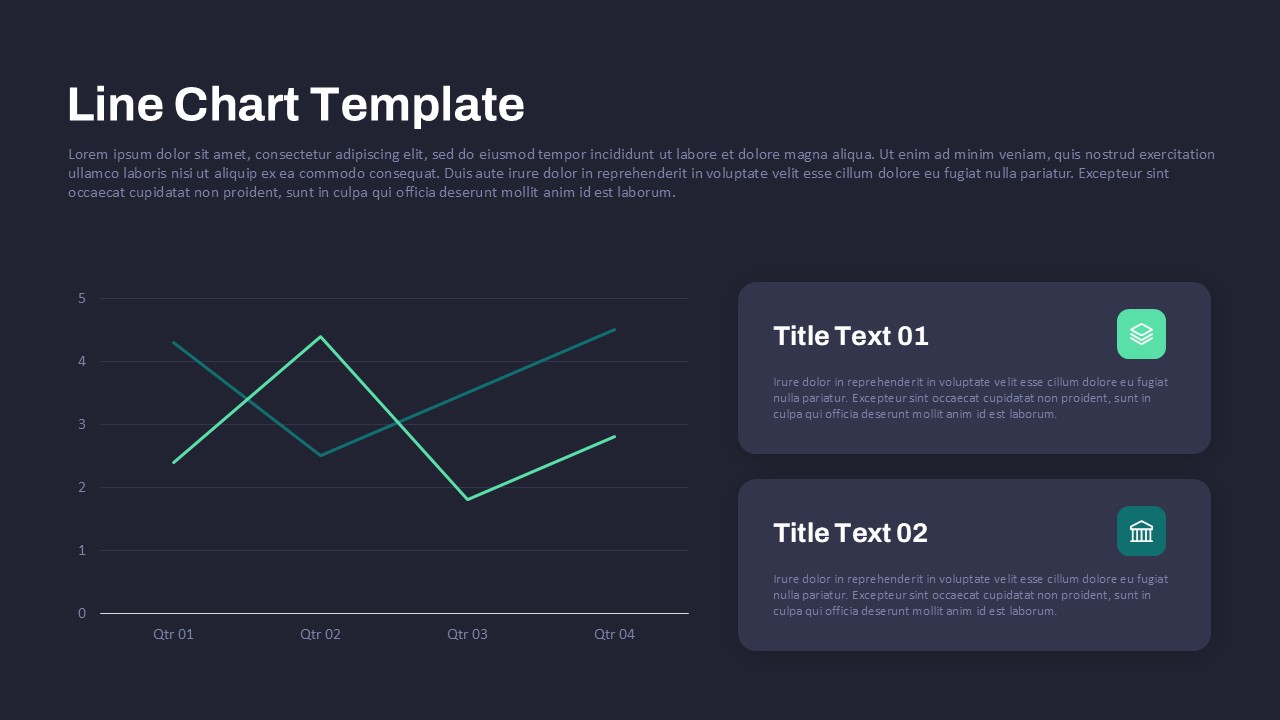
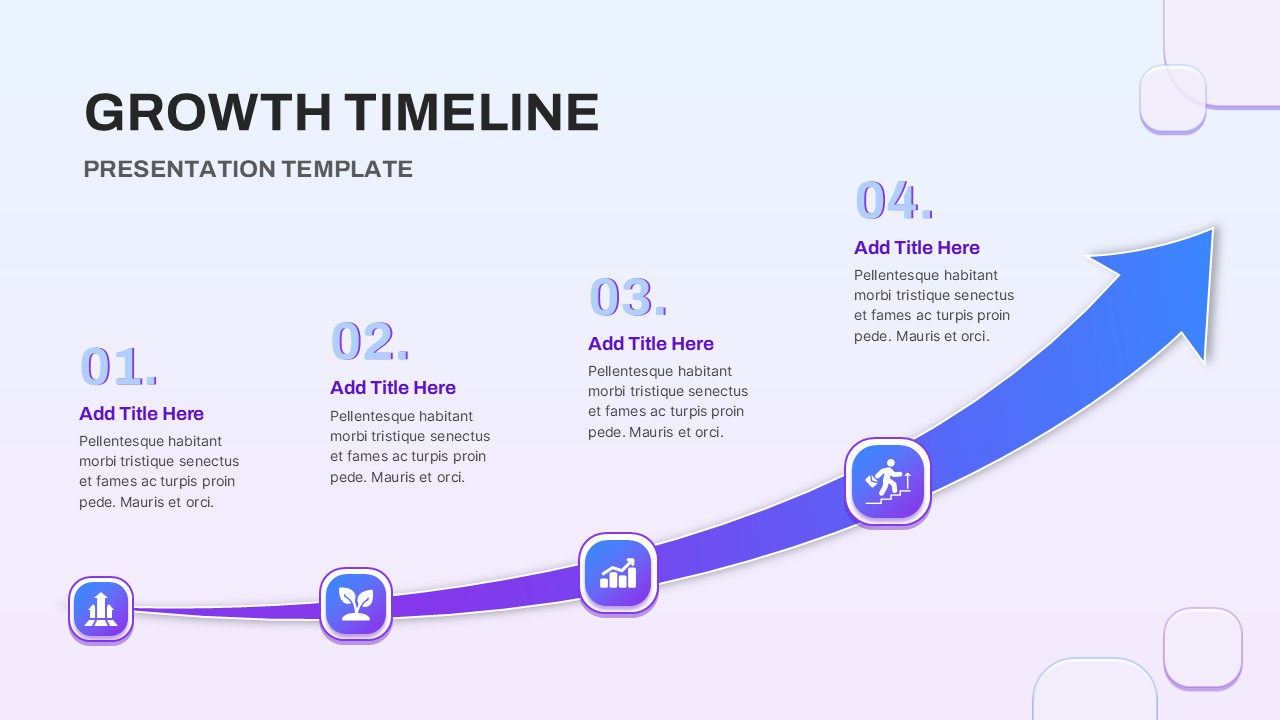
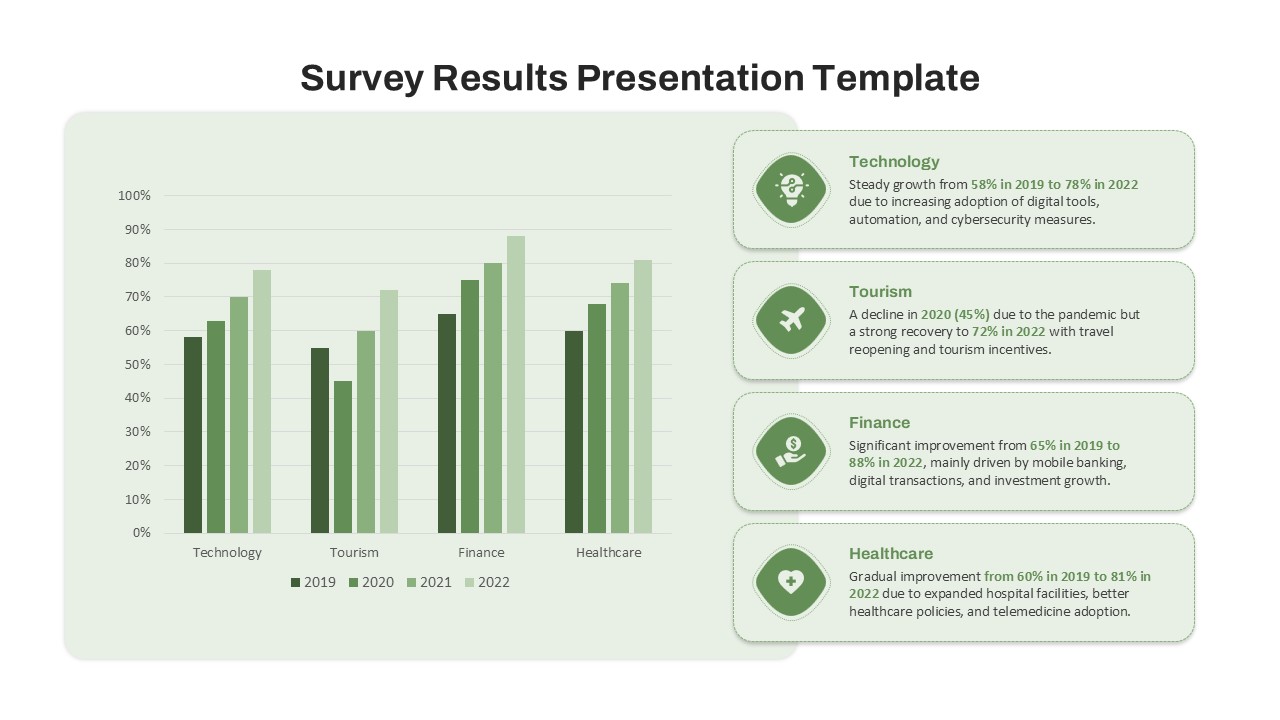
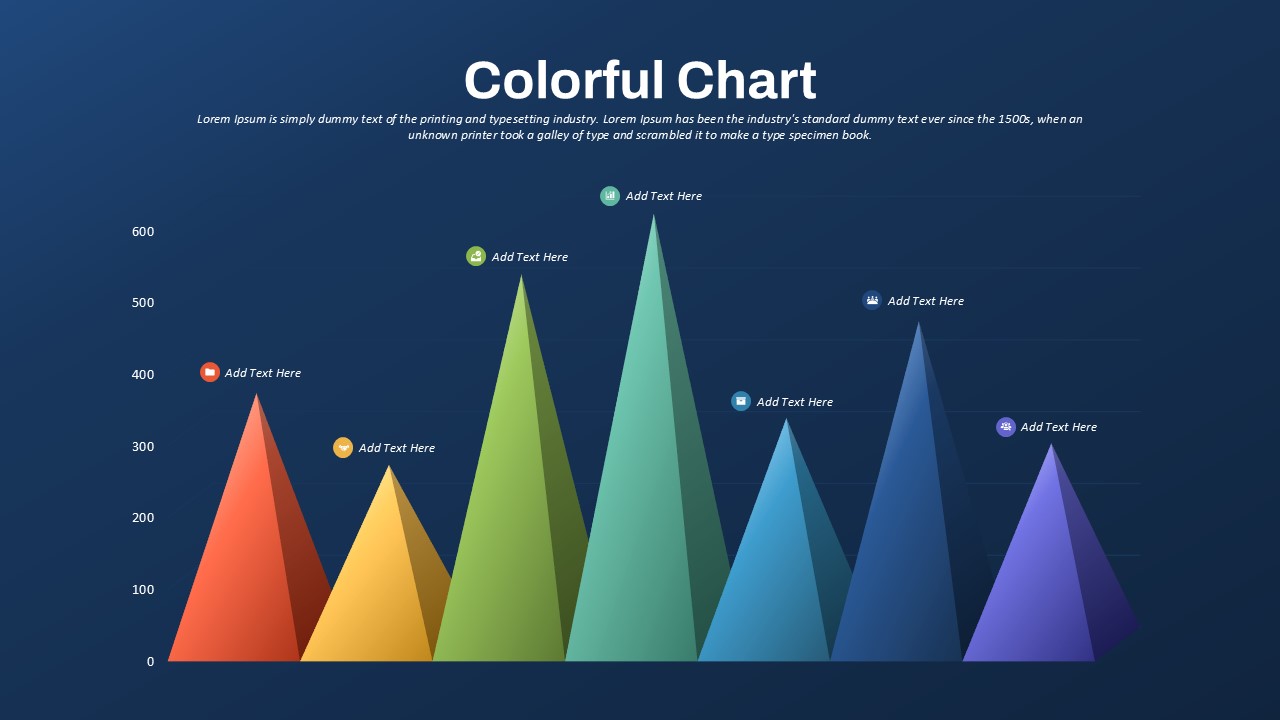
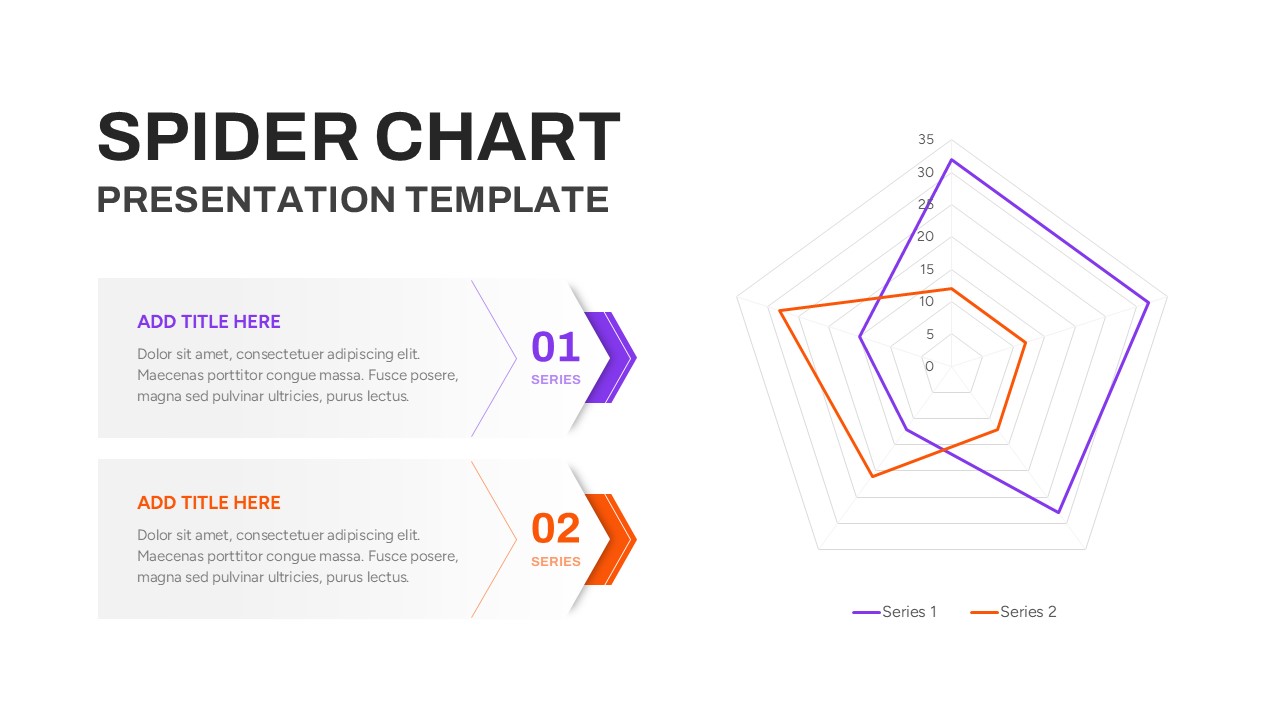
This template features two core visualizations:
- Line Chart displaying Revenue Growth Over Time, ideal for illustrating steady upward trends across multiple fiscal years.
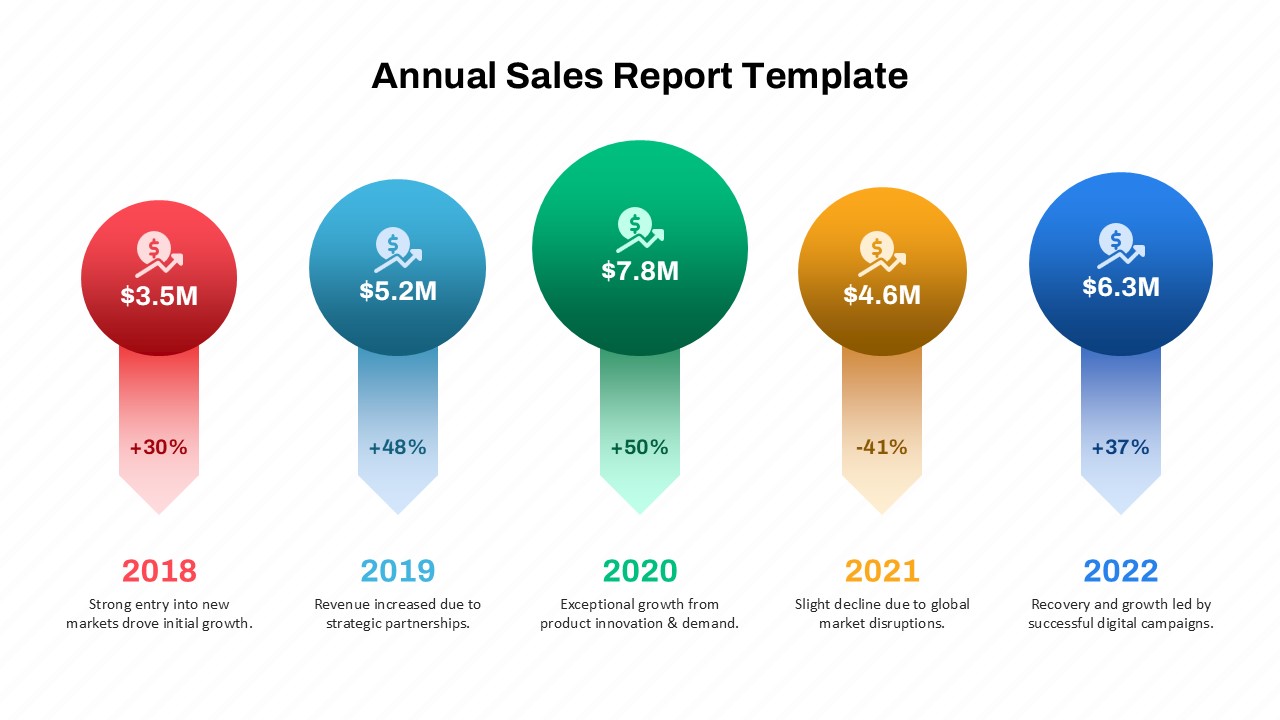
- Bar Chart representing Year-Over-Year Growth, making it easy to highlight percentage increases and acceleration in business performance.
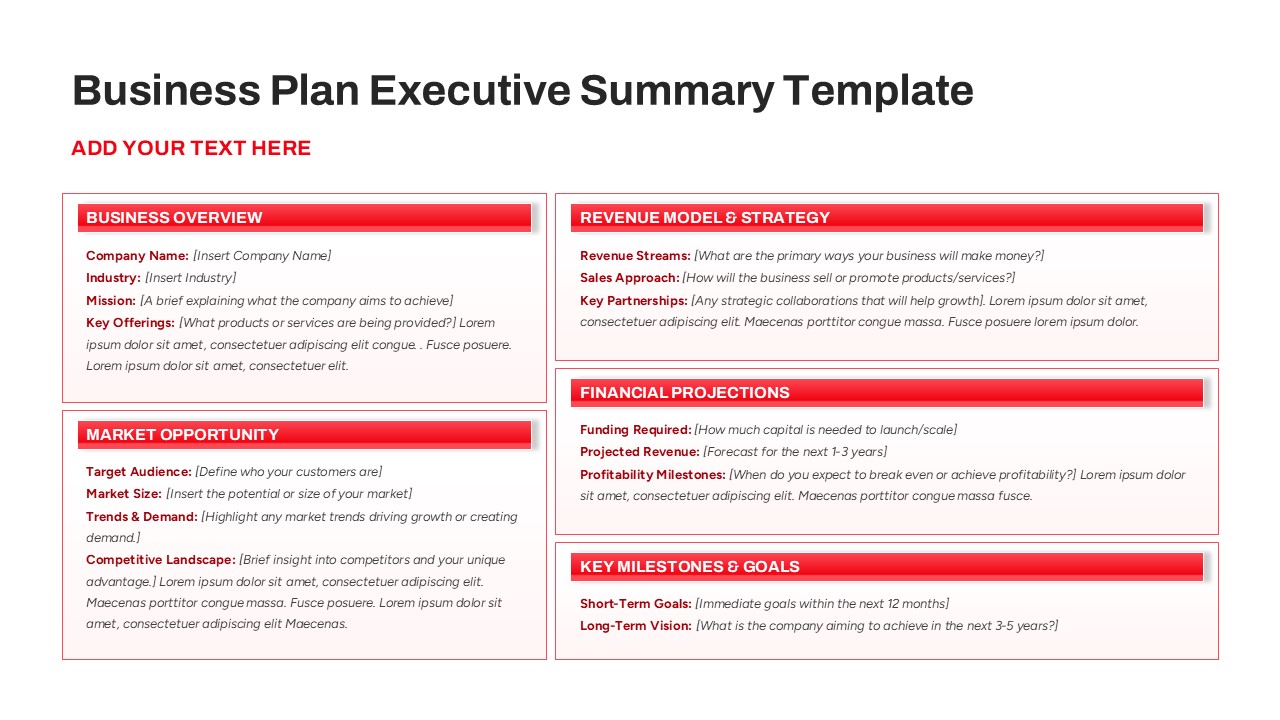
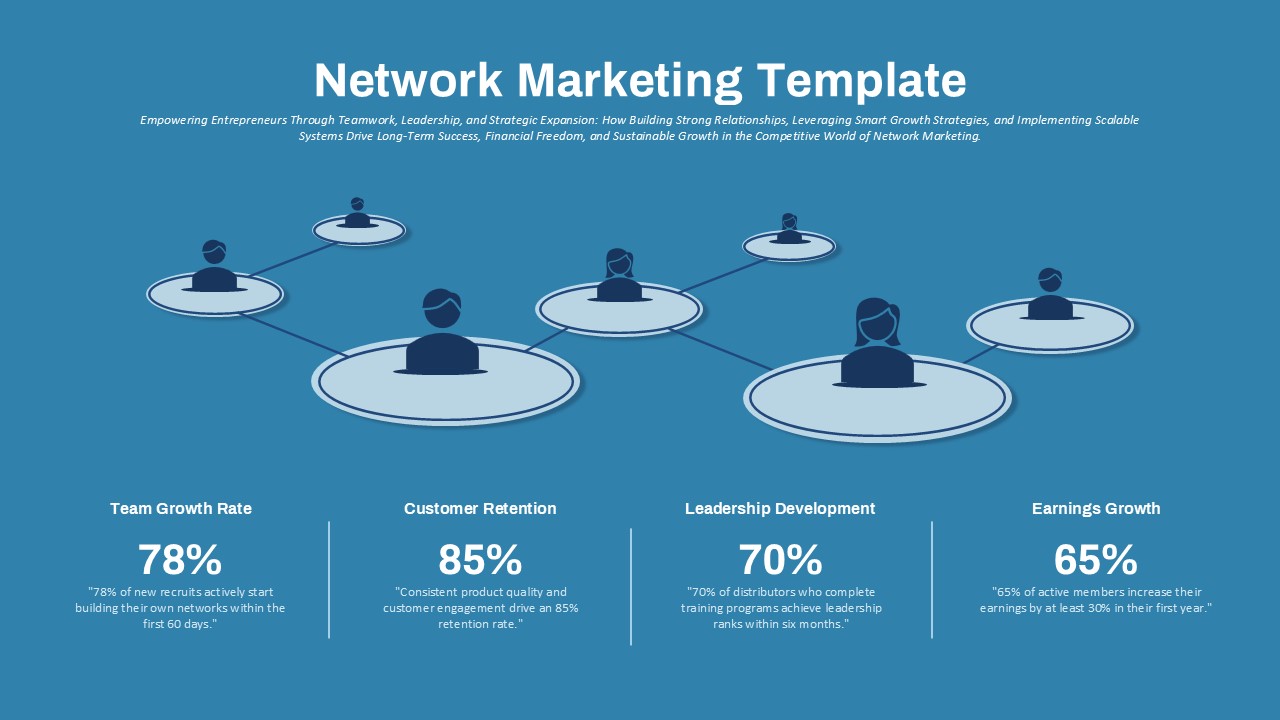
Additionally, two content blocks beneath the charts provide ample space for adding key takeaways, strategy notes, or performance insights with relevant icons to support your narrative. The layout is fully editable in both PowerPoint and Google Slides, allowing you to customize colors, text, data points, and icons to suit your branding and message.
Perfect for internal reviews, boardroom reporting, startup pitch decks, or investor updates, this template simplifies complex data storytelling and empowers stakeholders to make informed decisions.
Whether you’re presenting historical revenue, projecting future growth, or emphasizing key business metrics, this visual format ensures your data is both professional and impactful.
See more

Aspect Ratio
16:9Item ID
SKT03387
Features of this template
Other User Cases of the Template:
Annual business reviews, startup investor pitches, financial performance dashboards, sales growth tracking, KPI reporting, board meeting presentations, business strategy sessions, market expansion updates, performance improvement plans, quarterly or annual revenue reports
FAQs
You May Also Like These Presentation Templates


- Free

- Free

- Free

- Free
- Free
- Free
- Free
- Free
- Free
- Free
- Free