Churn Rate vs Retention Rate Comparison Slide in PowerPoint and Google Slides
Churn Rate vs Retention Rate Comparison Presentation Template
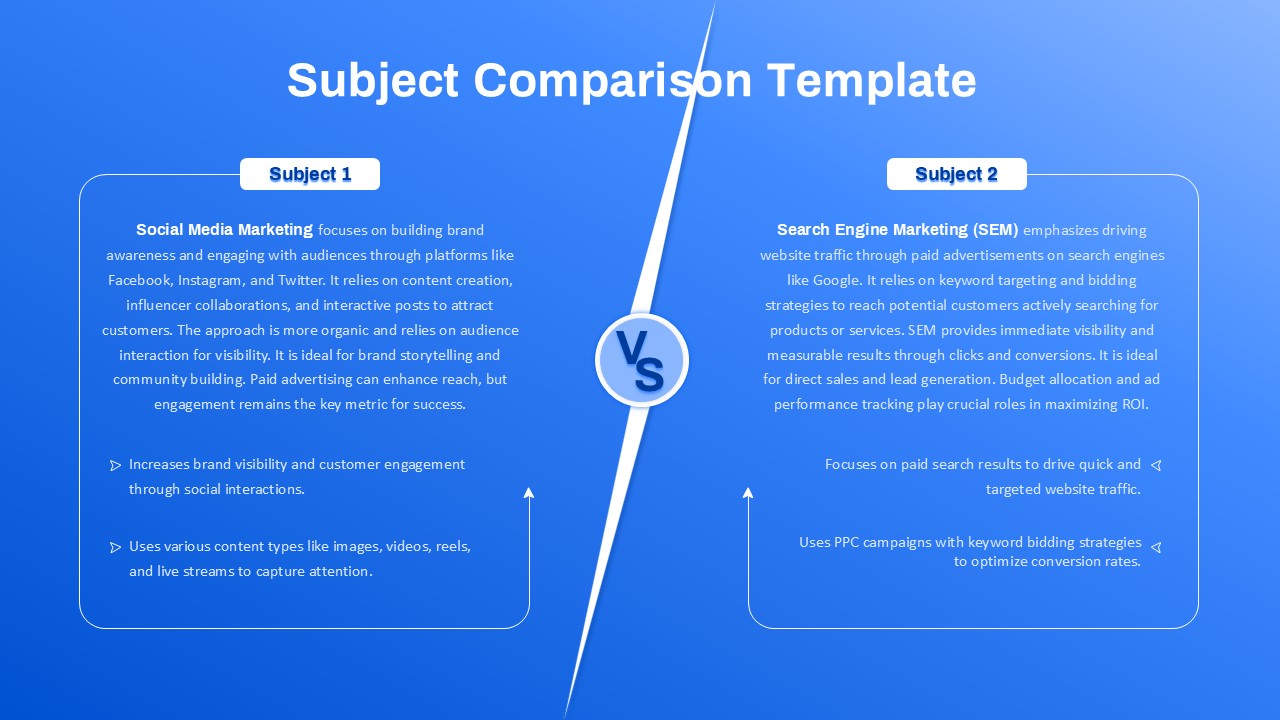
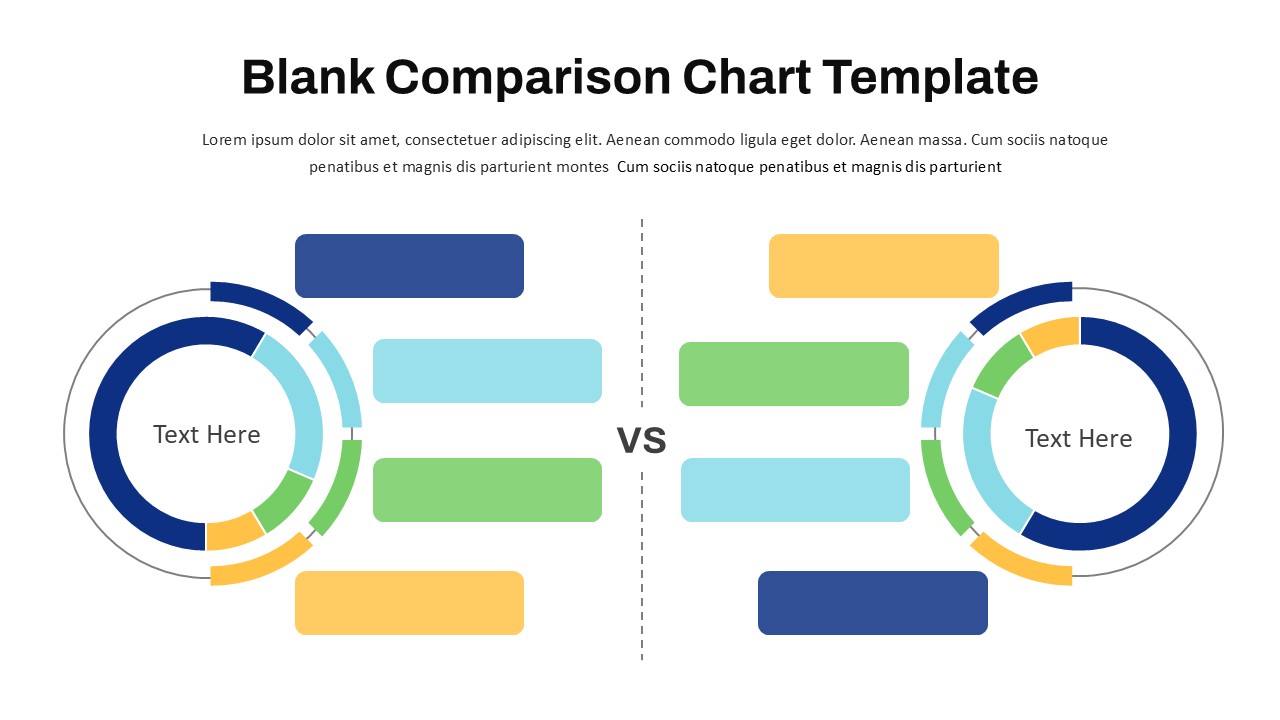
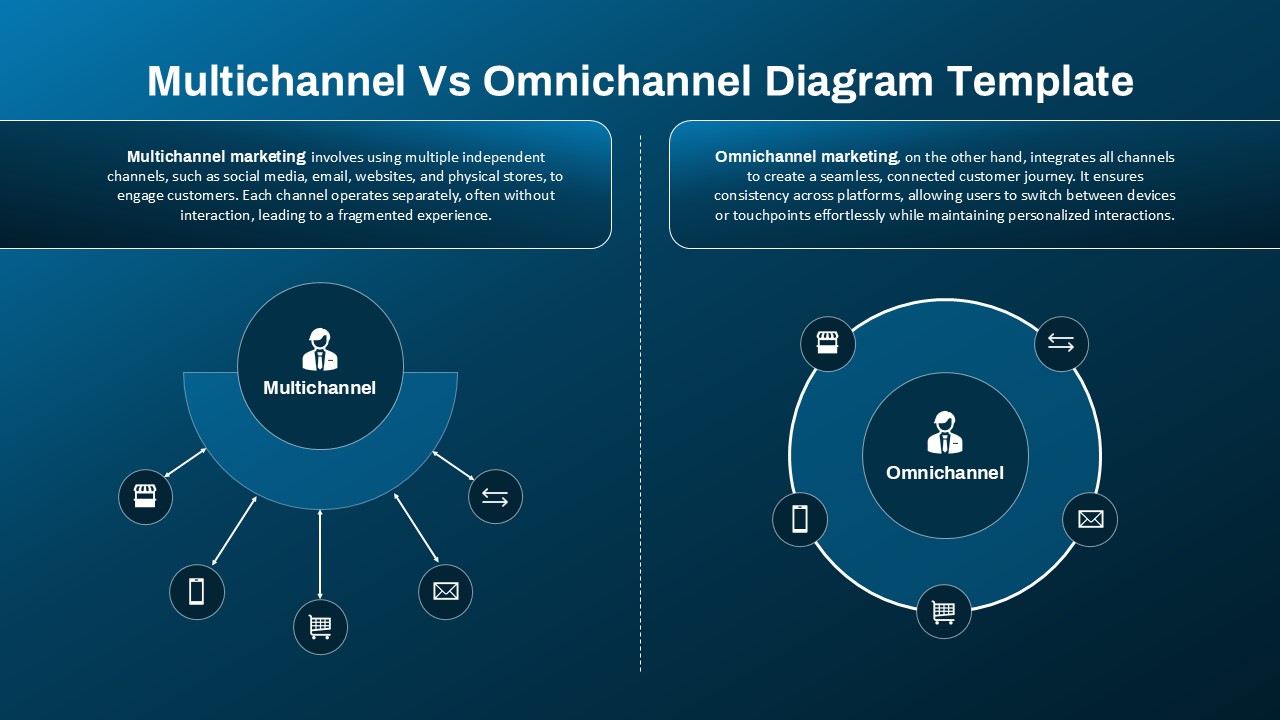
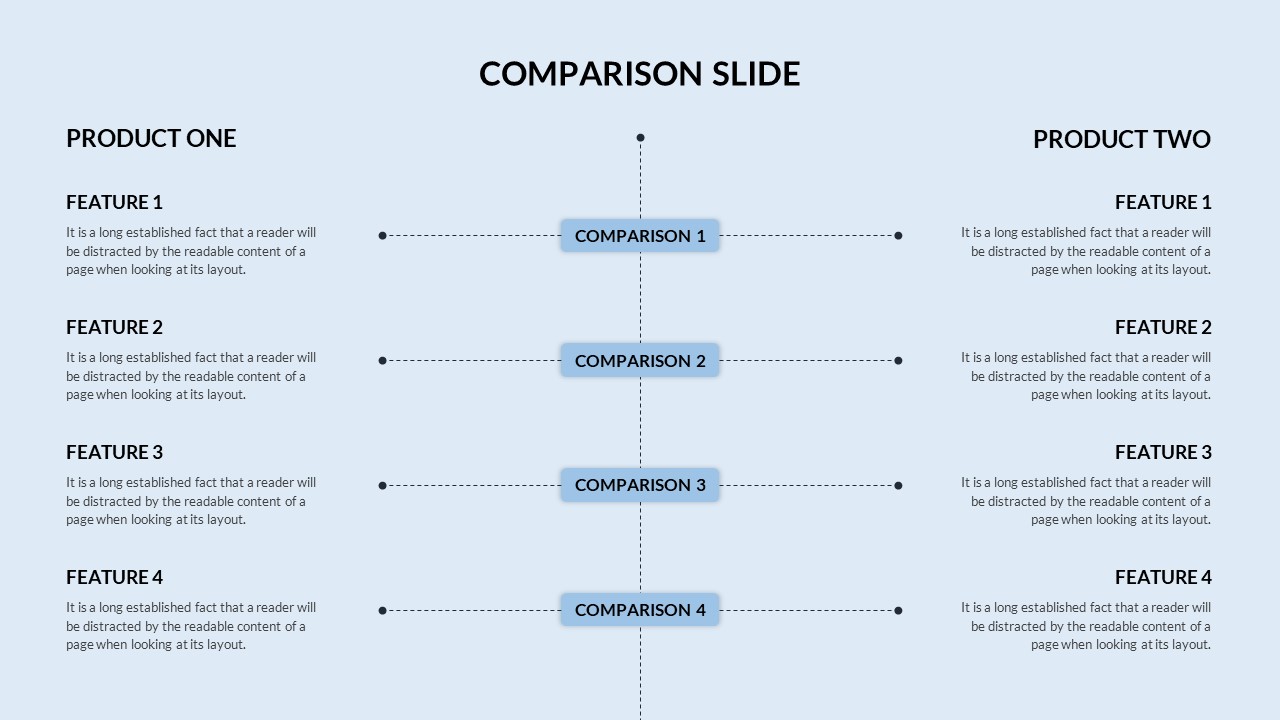
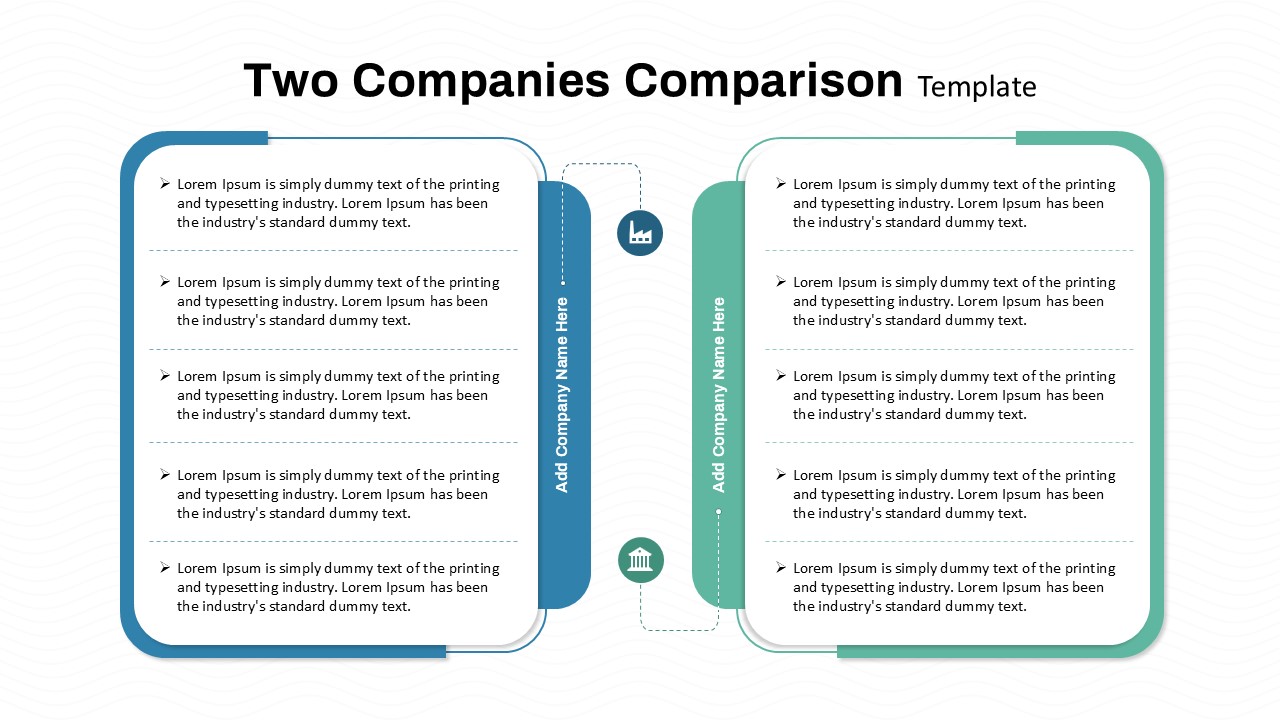
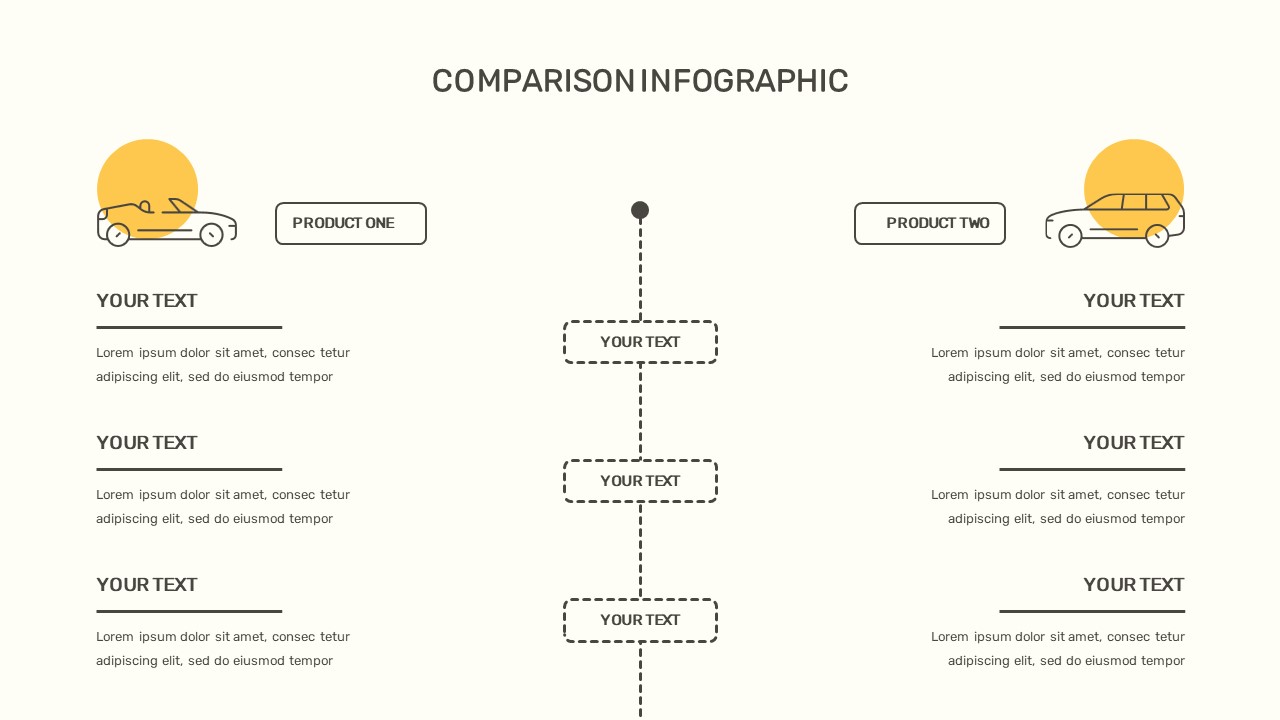
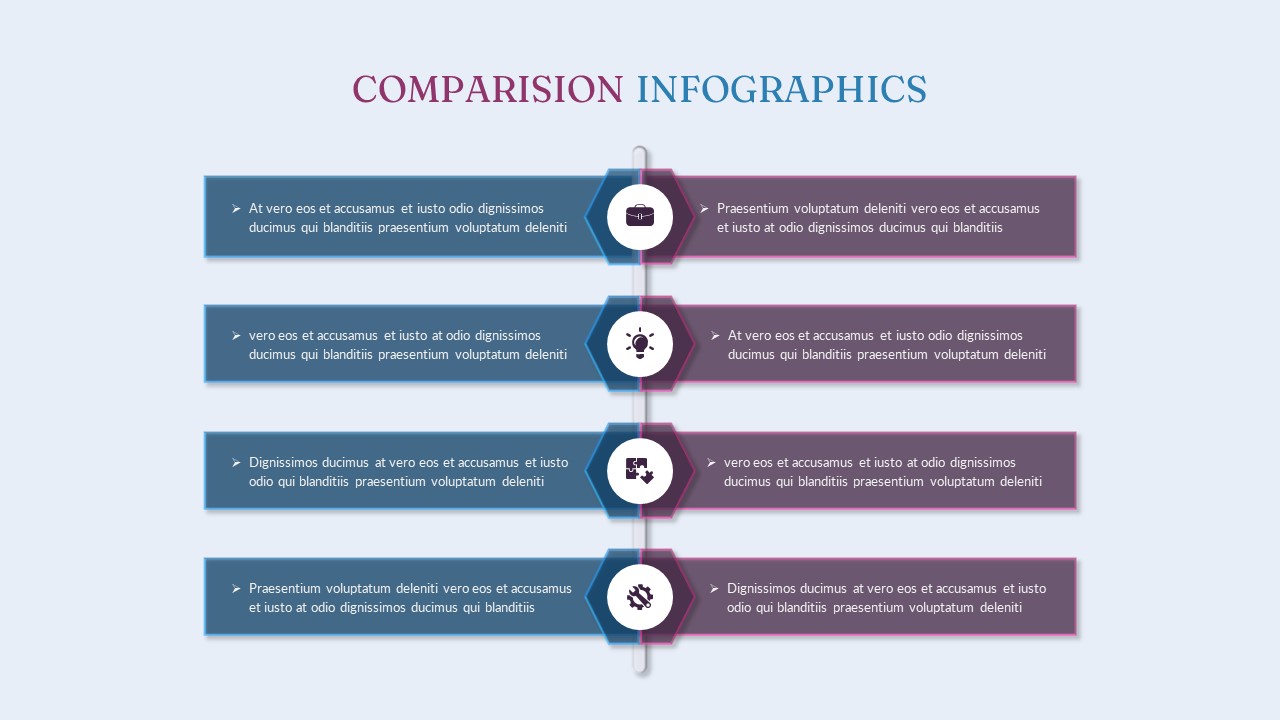
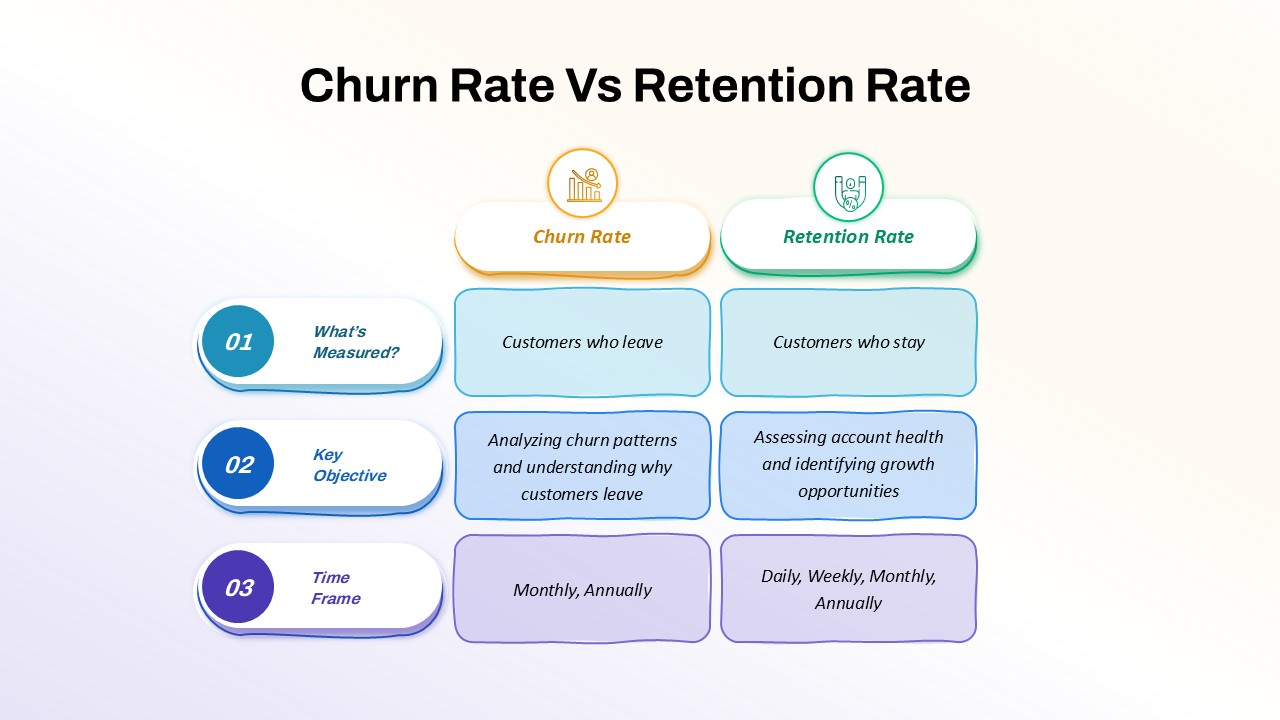
The Churn Rate vs Retention Rate Comparison Template is an essential tool for businesses looking to understand and communicate the critical metrics behind customer loyalty and business growth. This template offers a side-by-side comparison of two fundamental KPIs that directly impact a company’s sustainability: Churn Rate and Retention Rate.
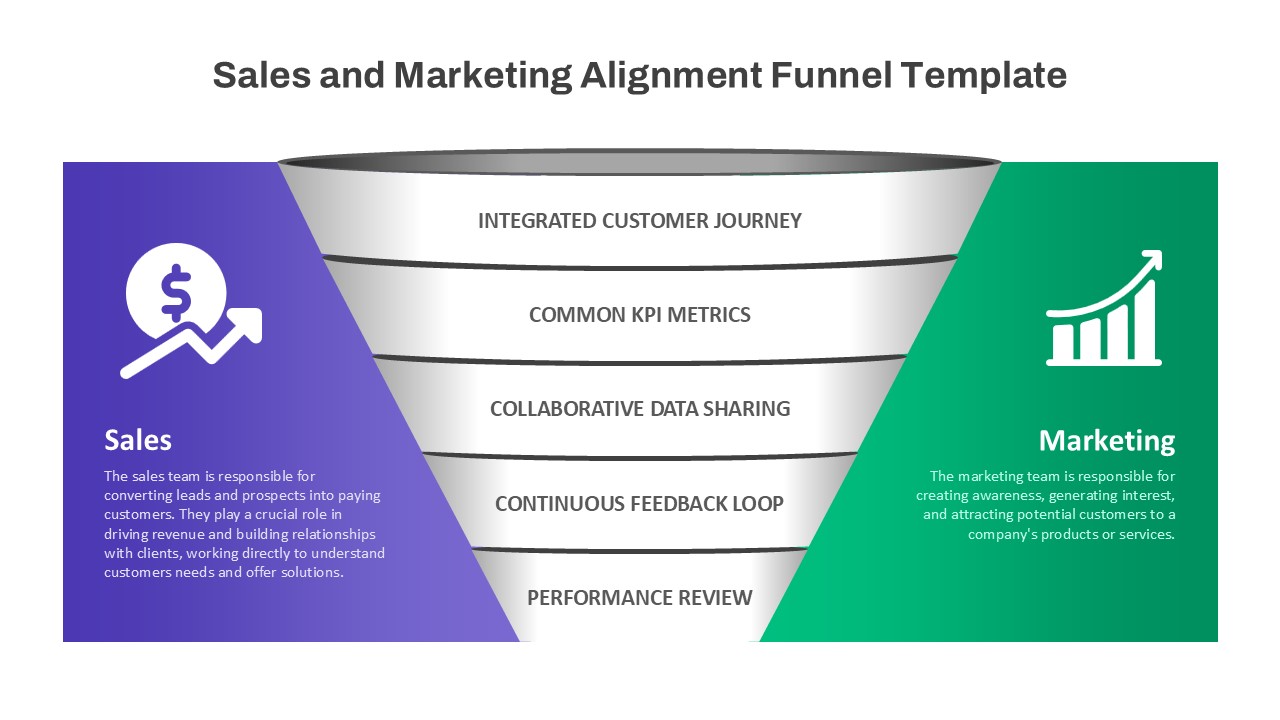
Churn Rate focuses on customers who leave, helping organizations analyze churn patterns and identify the causes behind customer attrition. This metric is crucial for businesses aiming to reduce turnover, optimize their offerings, and enhance customer satisfaction.
On the other hand, Retention Rate measures customers who remain loyal over time, providing insights into customer account health and highlighting growth opportunities. It’s a key indicator for businesses looking to assess long-term engagement and capitalize on existing relationships.
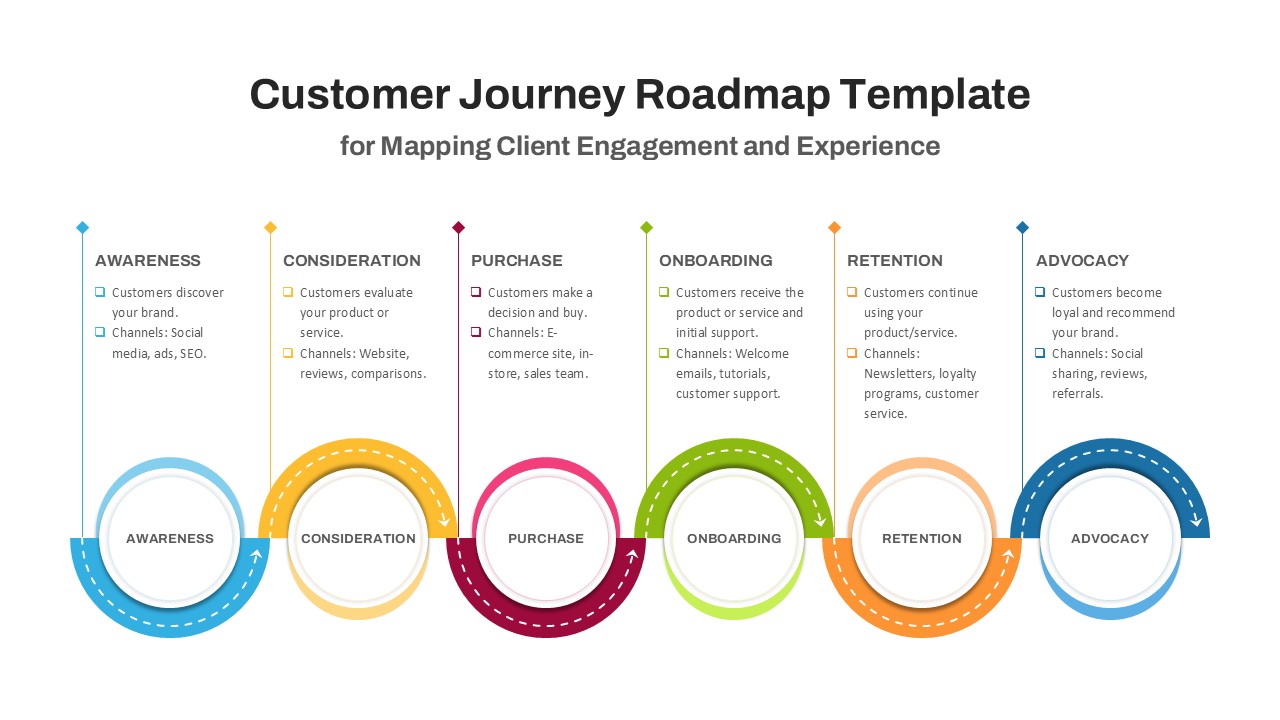
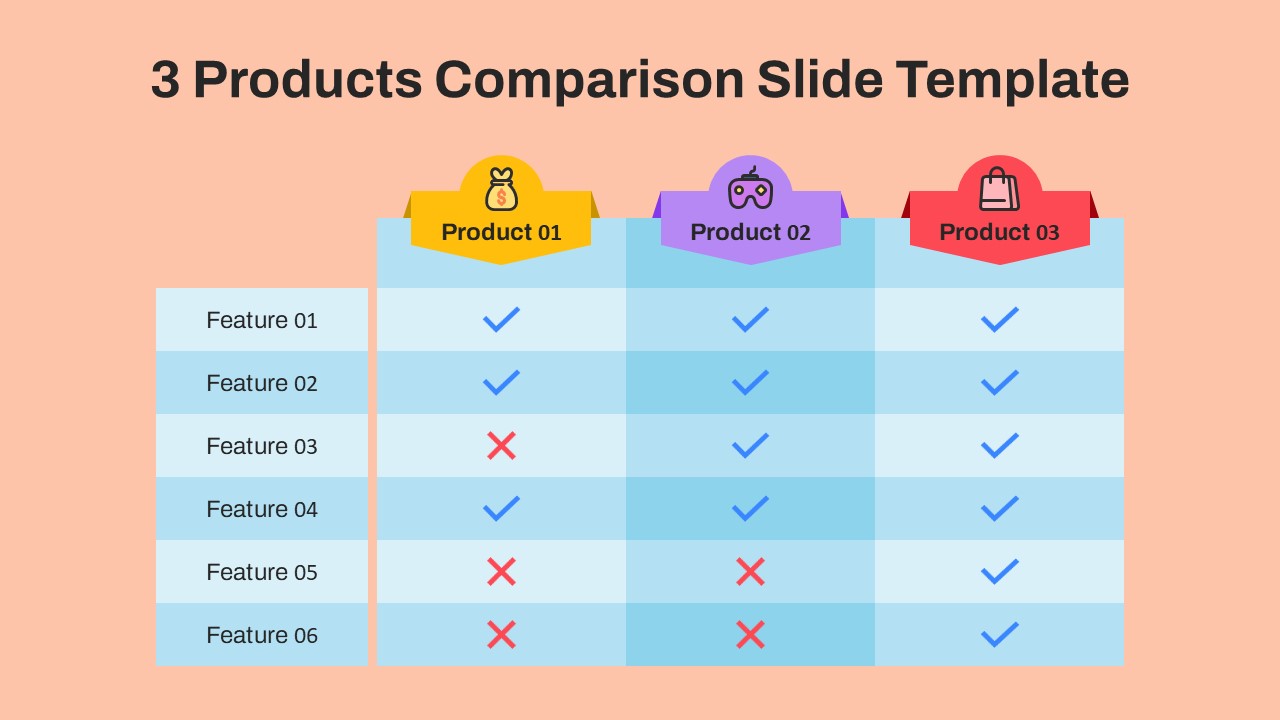
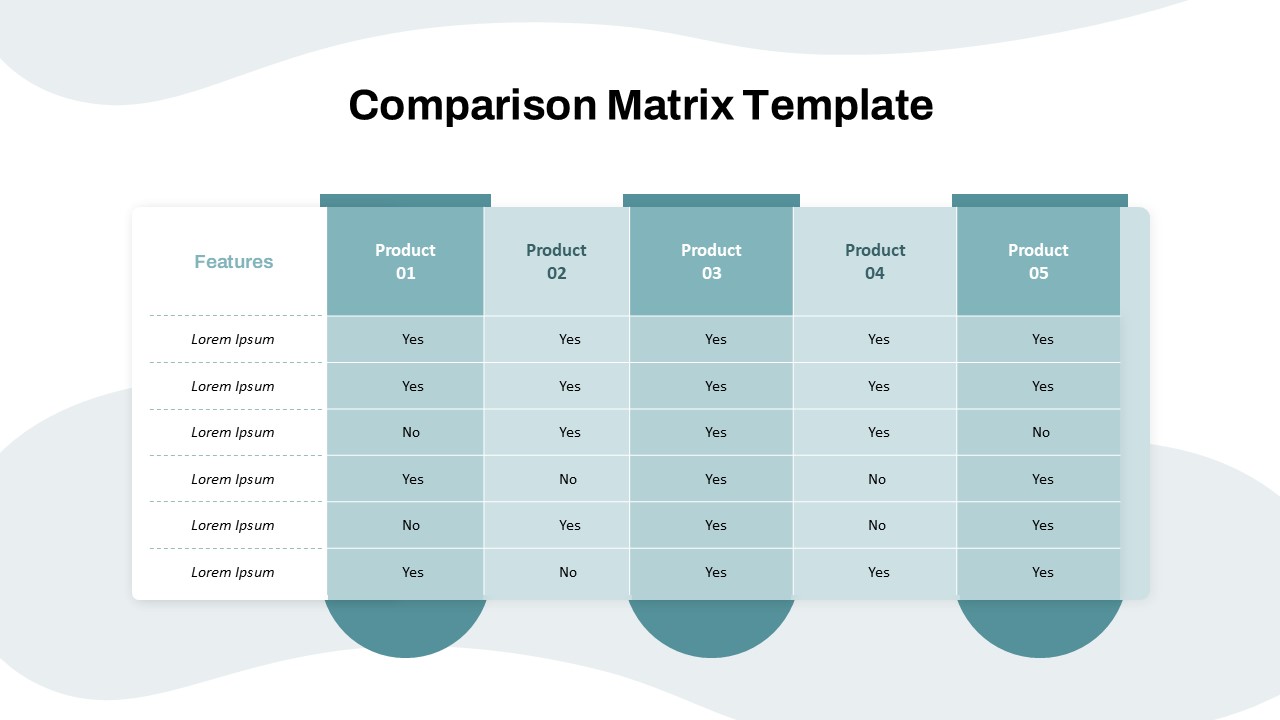
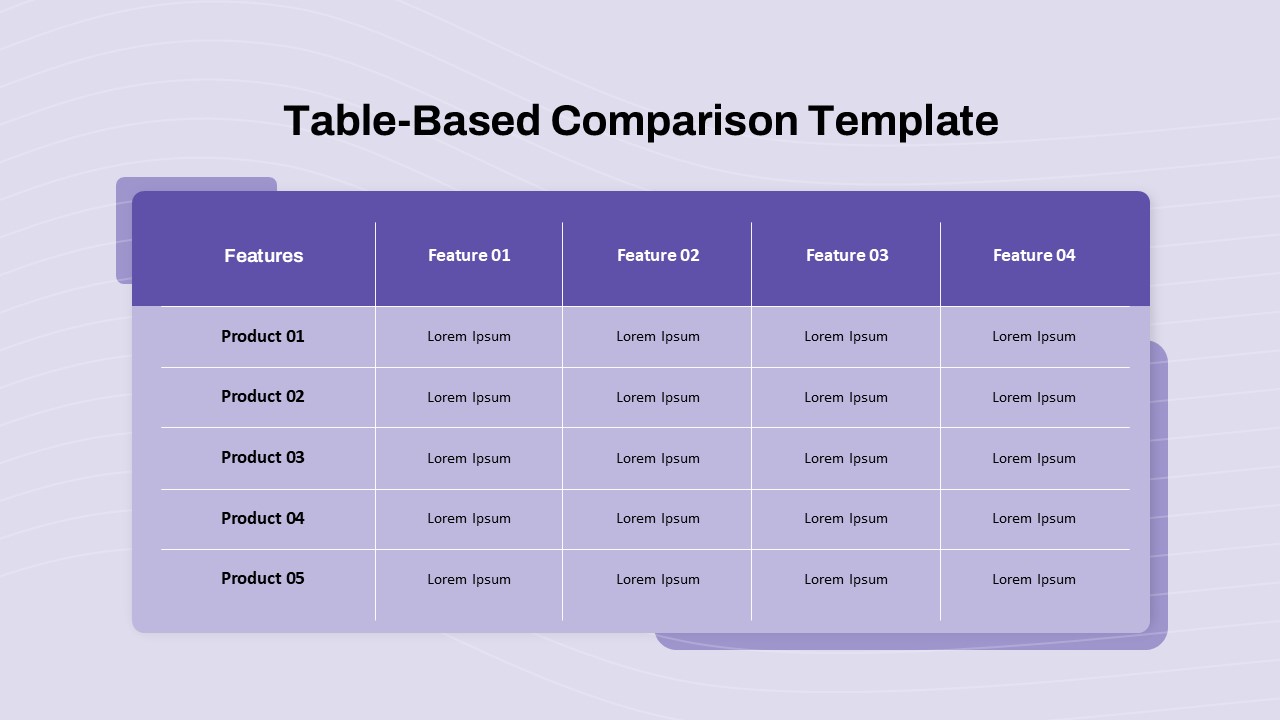
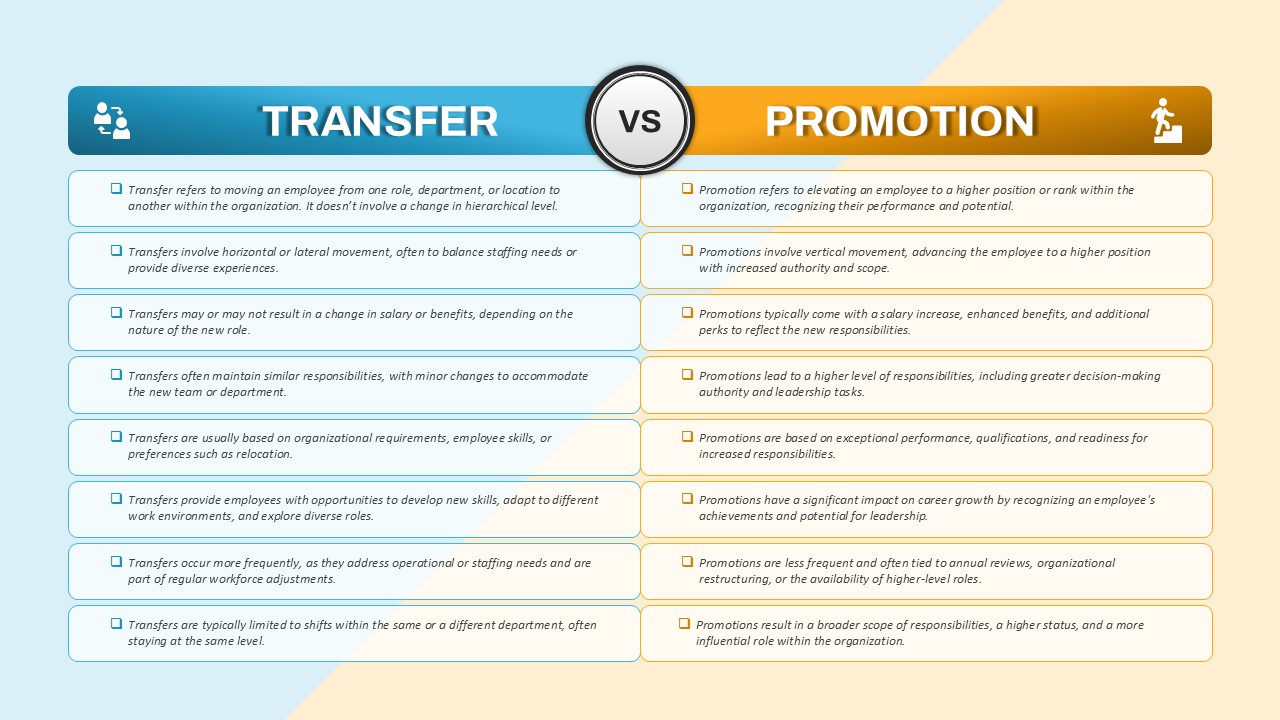
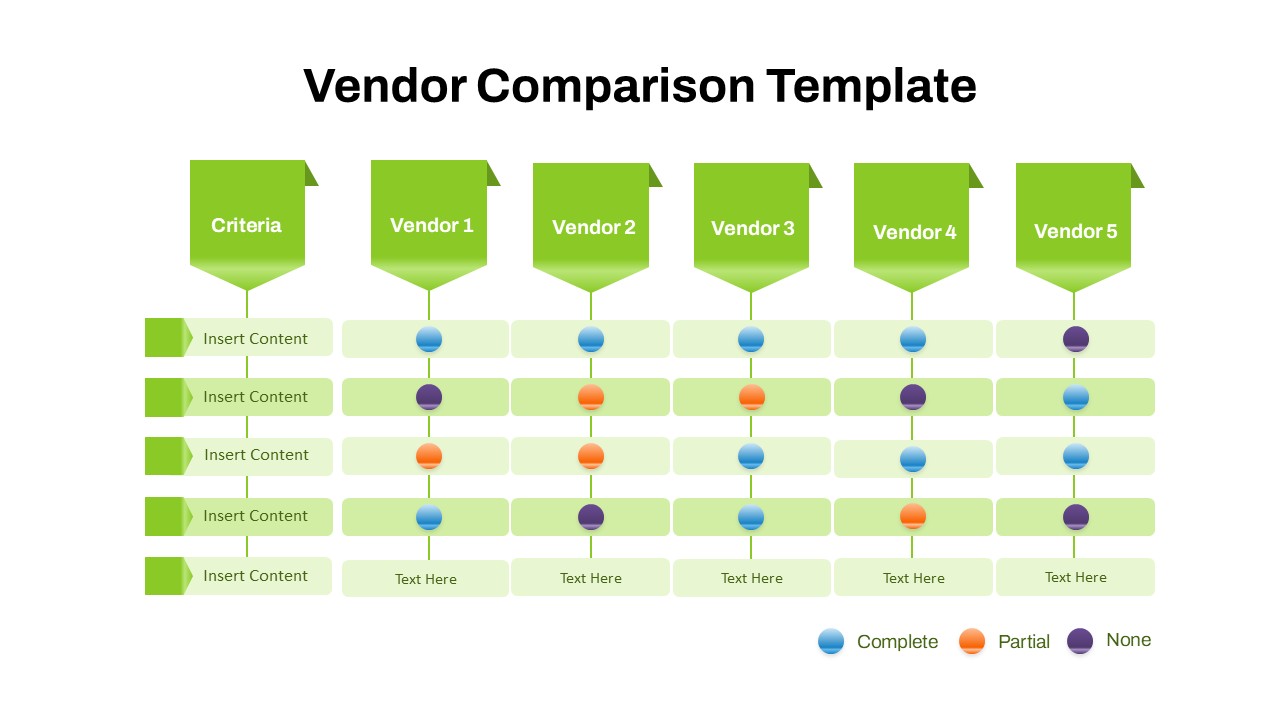
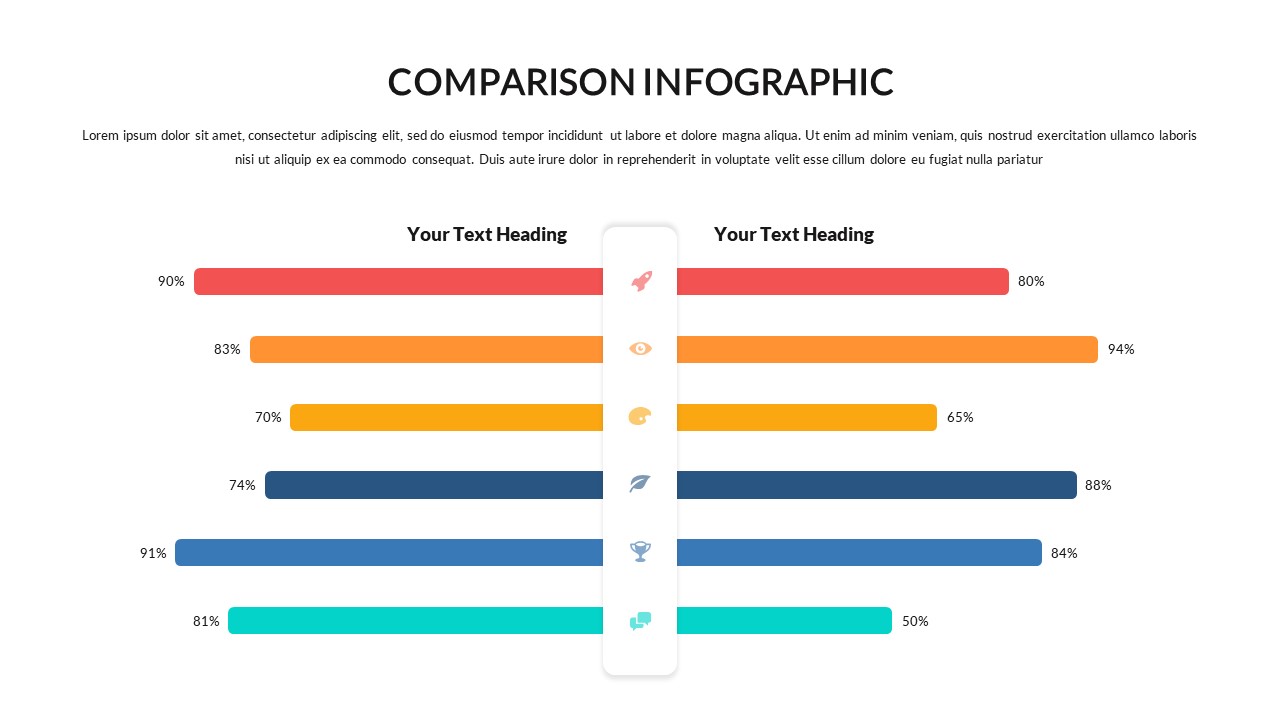
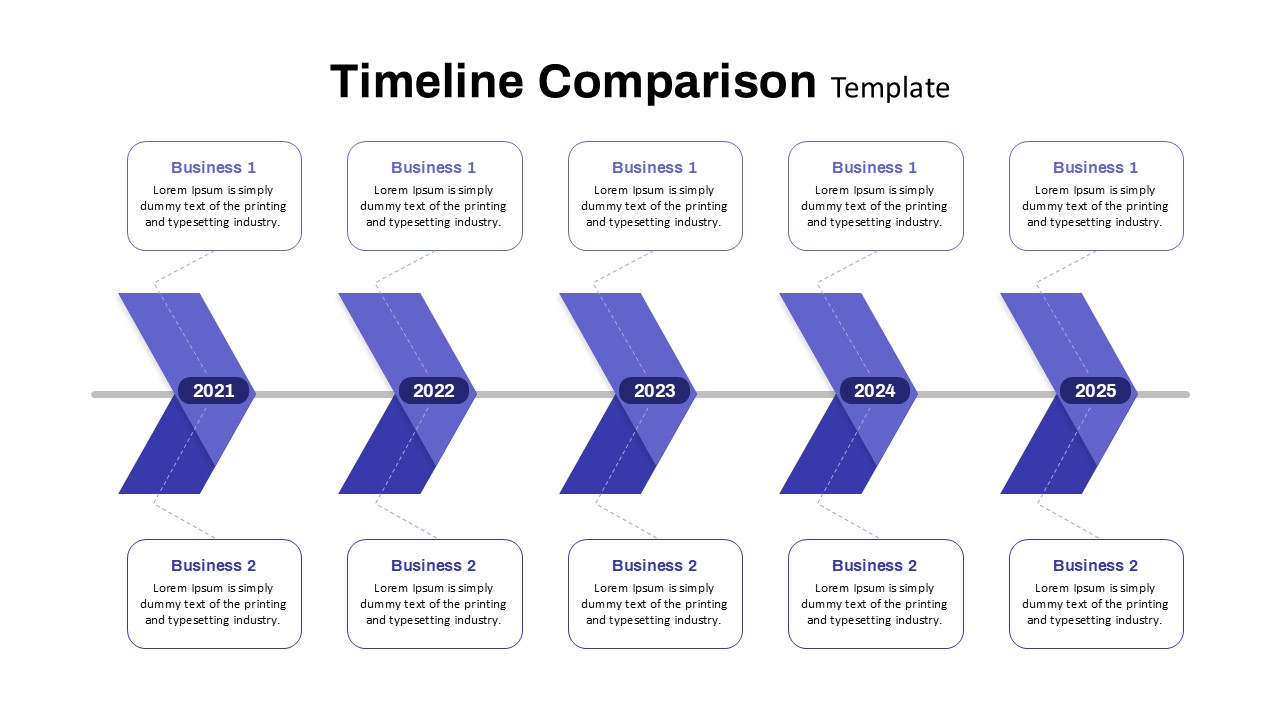
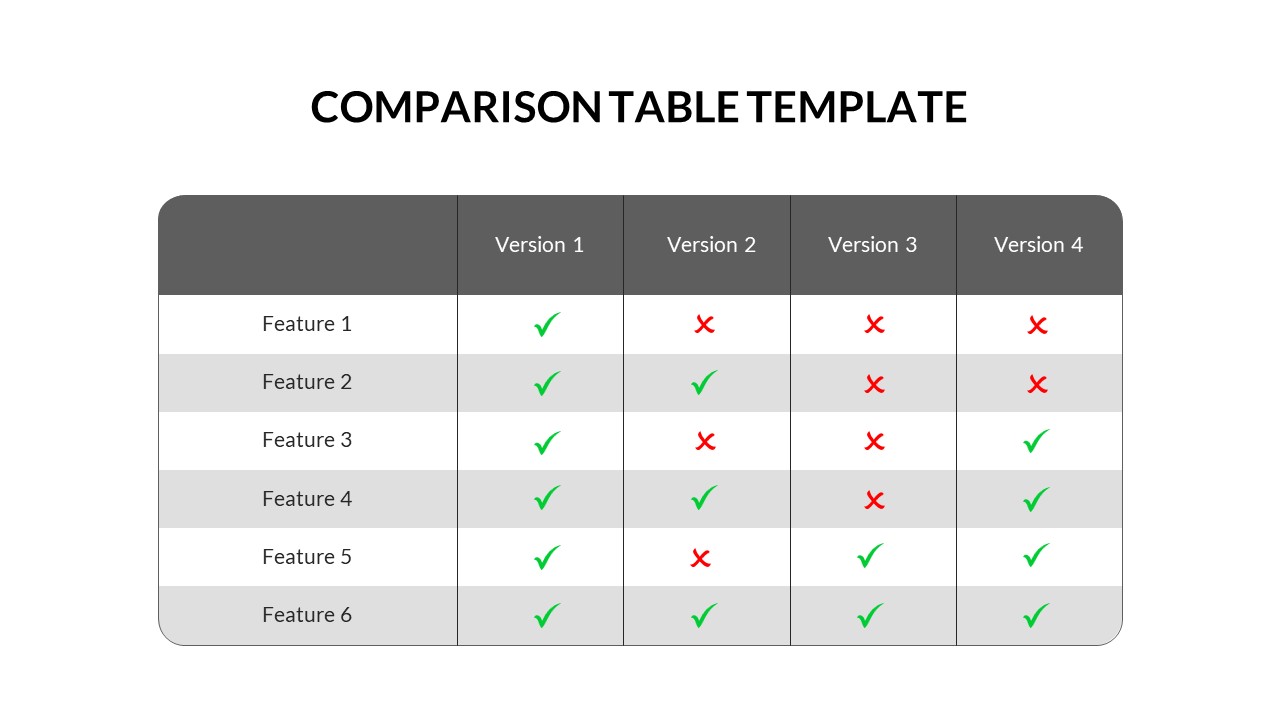
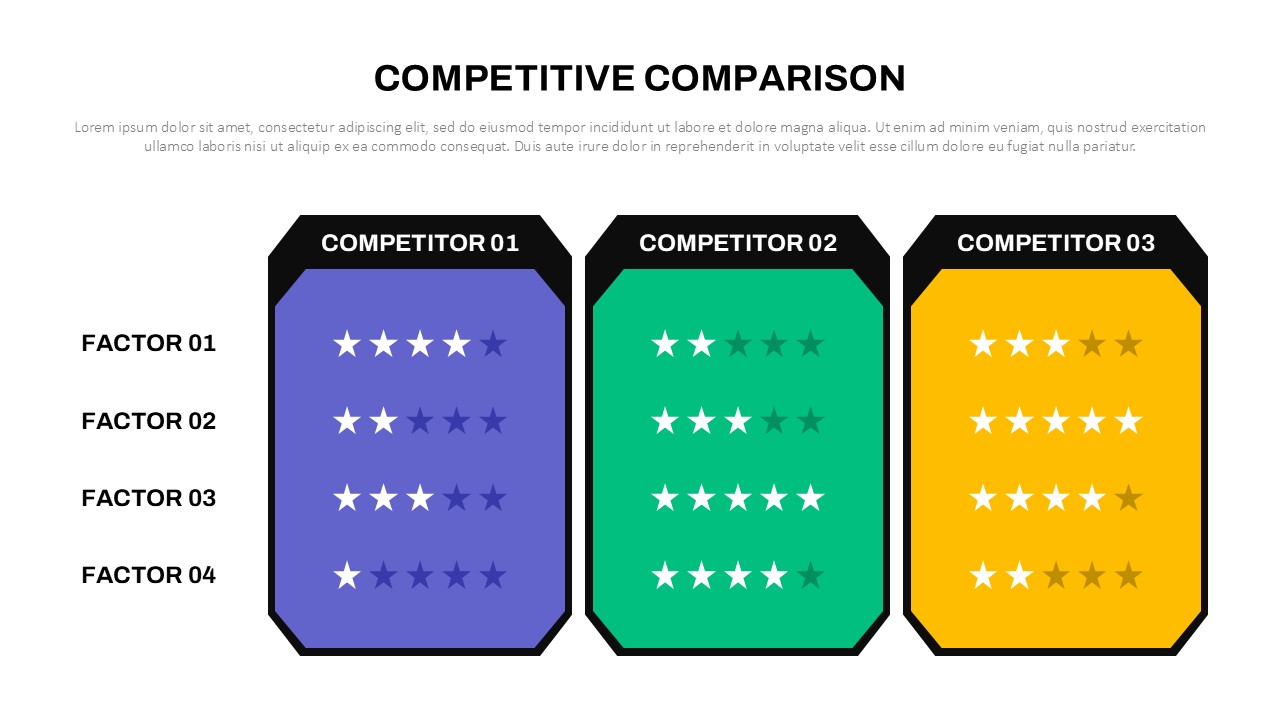
With clearly defined sections for each metric, this template allows you to compare:
What’s Measured: Understanding the customer segments being evaluated
Key Objective: Analyzing the reasons behind churn and the health of retained customers
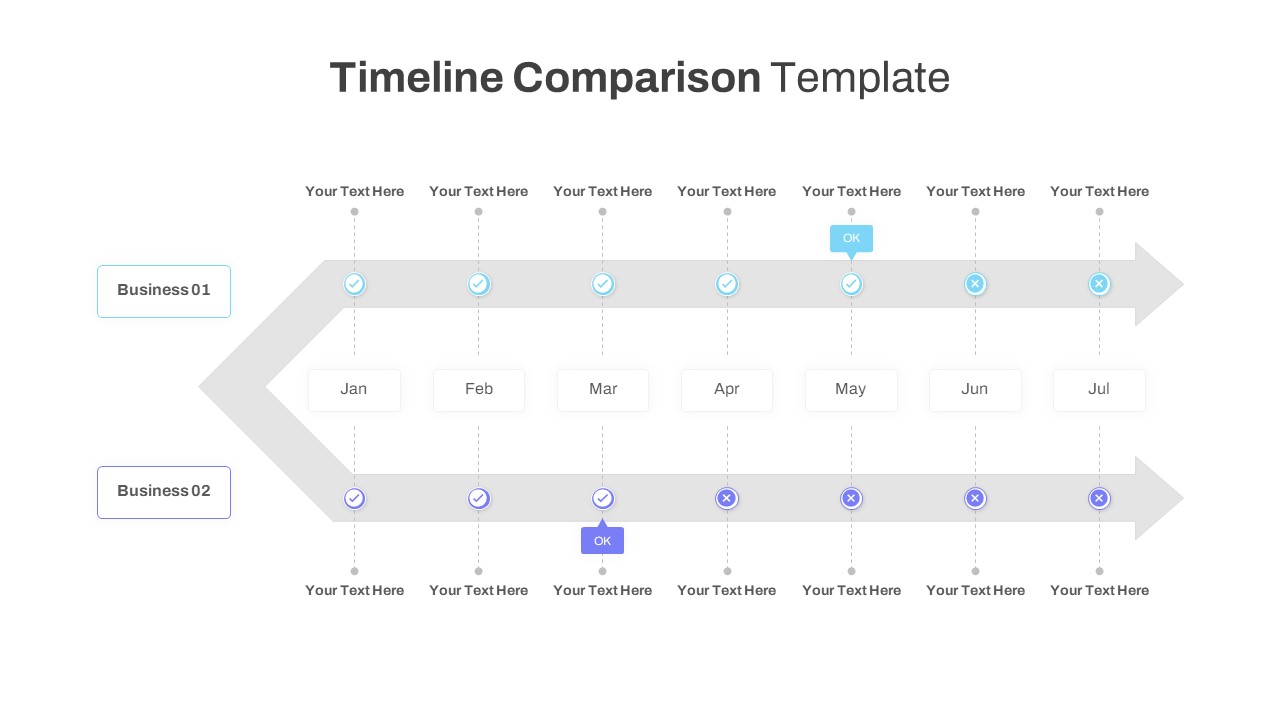
Time Frame: Comparing monthly, weekly, and annual tracking across both metrics
Designed for easy editing in both PowerPoint and Google Slides, this template enables you to present these vital performance metrics effectively in client meetings, boardroom discussions, or strategic planning sessions.
See more

Aspect Ratio
16:9Item ID
SKT03574
Features of this template
Other User Cases of the Template:
Customer success analysis, marketing performance reviews, customer lifecycle tracking, subscription-based business strategies, SaaS business analysis, engagement metrics presentations, client retention strategies, sales performance reviews, business growth evaluation, loyalty program assessments
FAQs
You May Also Like These Presentation Templates

- Free

- Free

- Free
- Free
- Free
- Free

- Free

- Free