Colorful Demographic Data Pie Chart Template


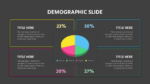
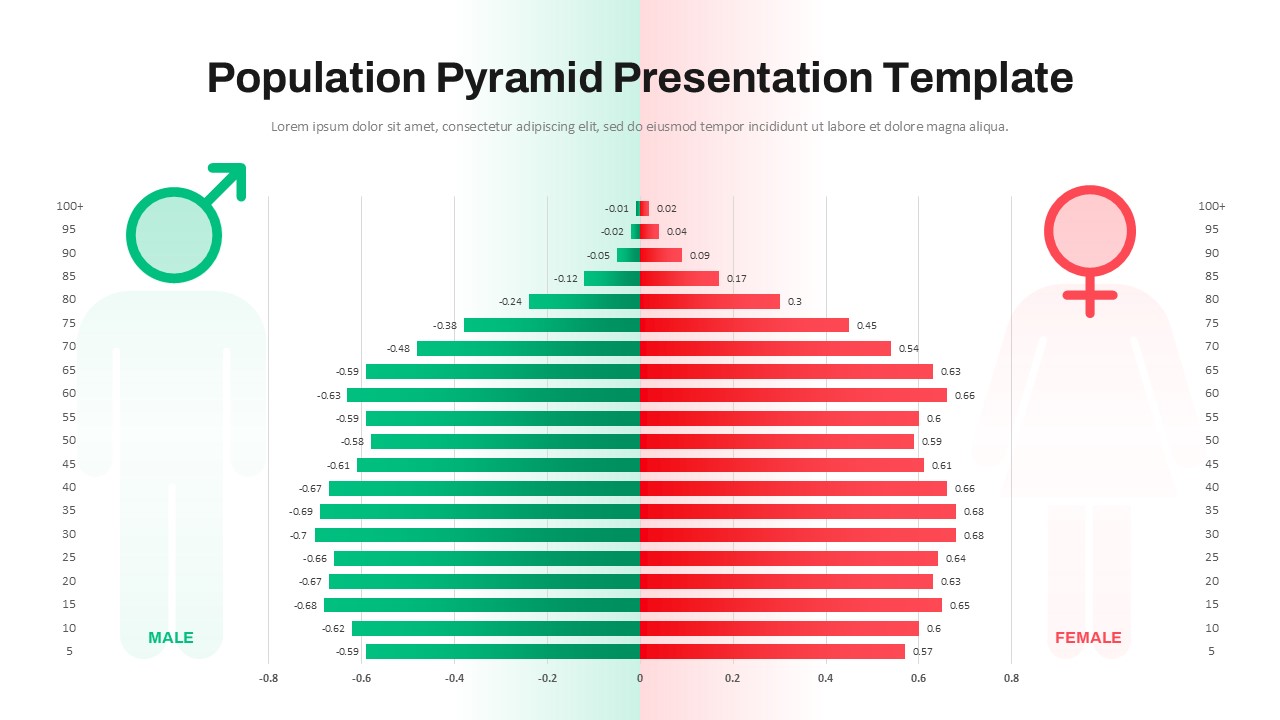
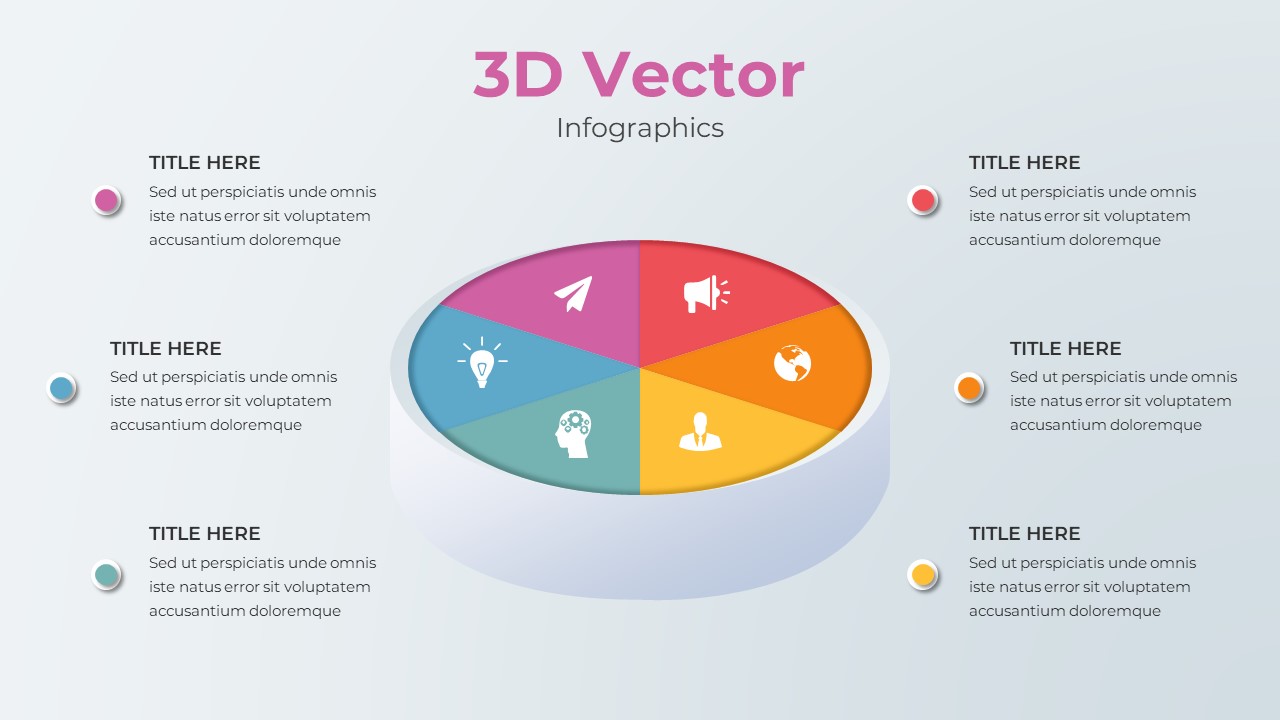
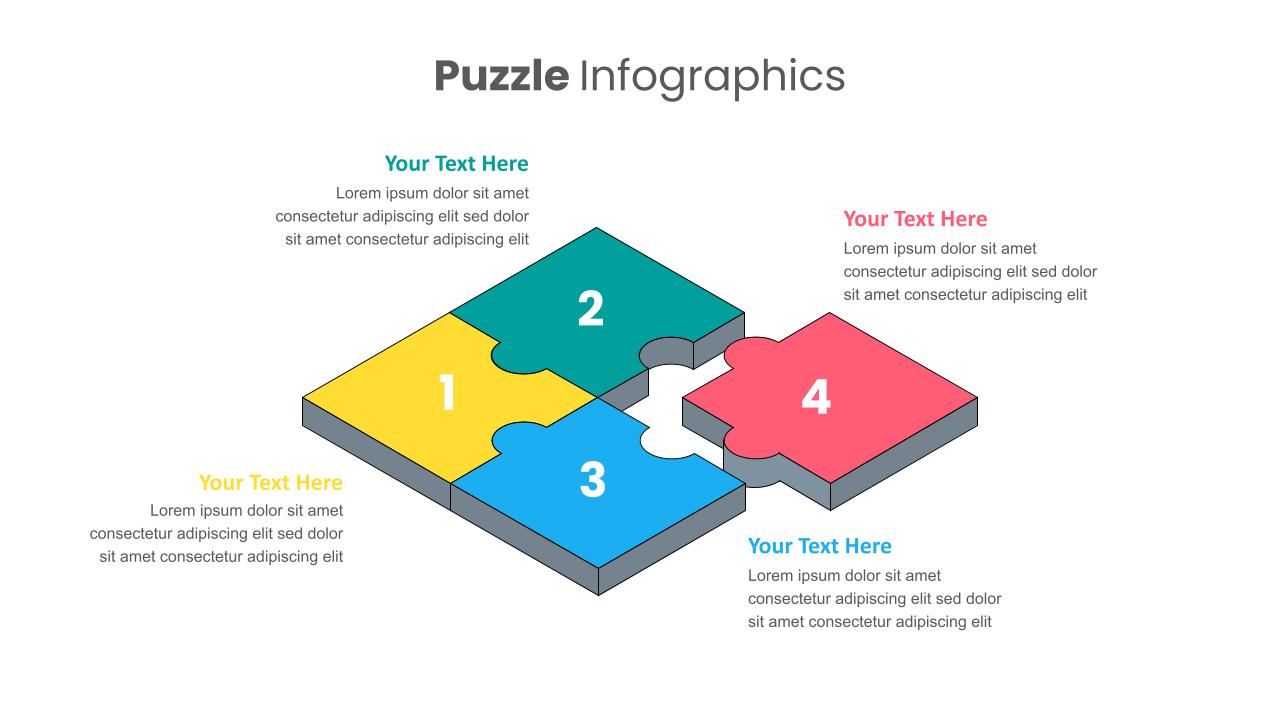
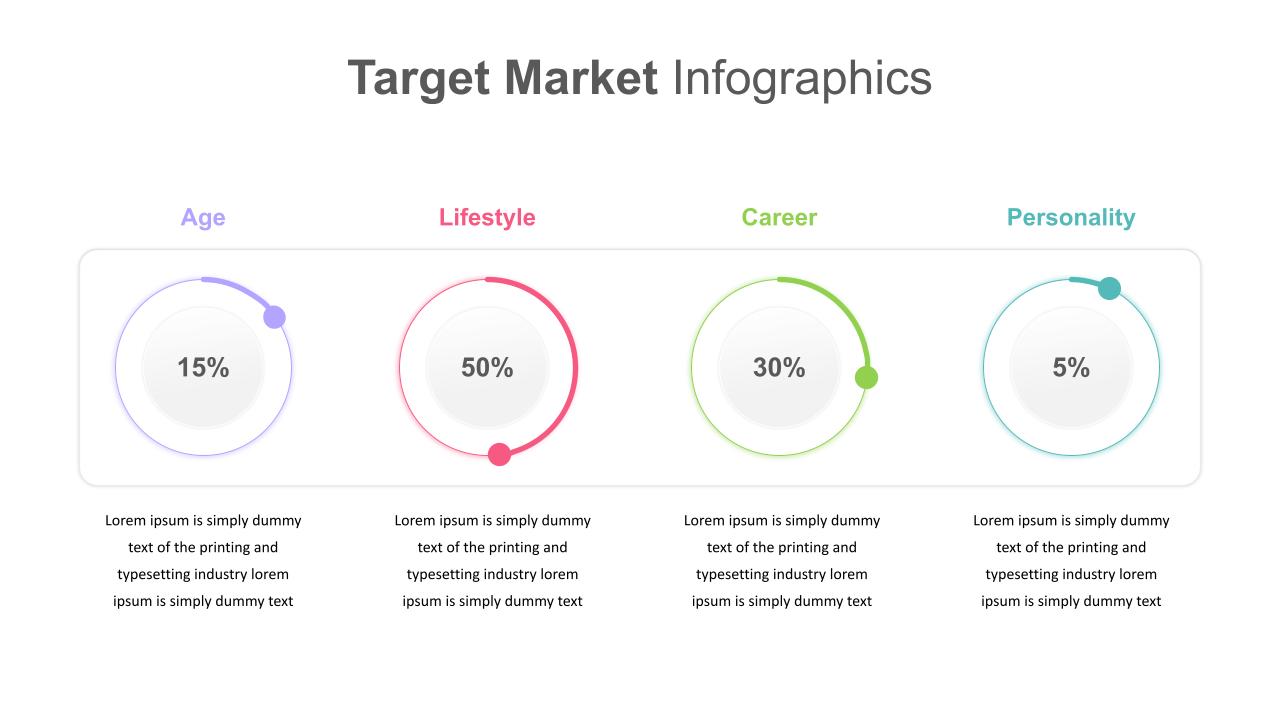
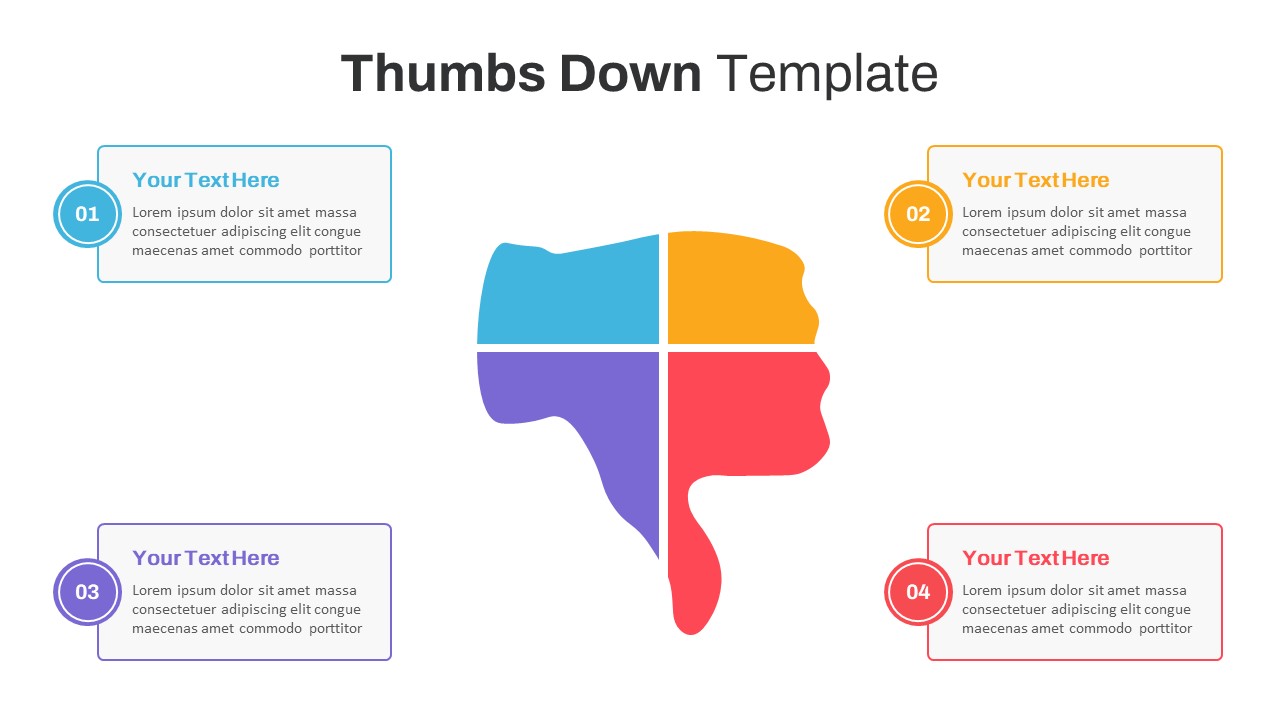
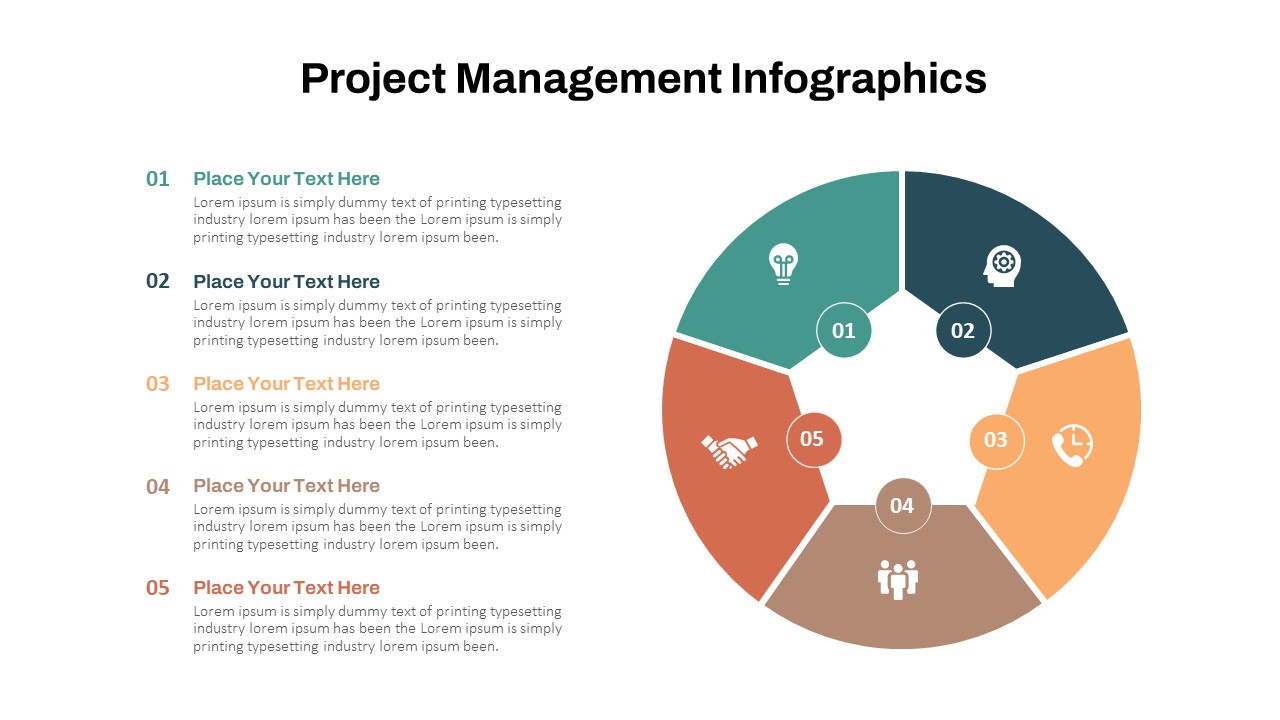
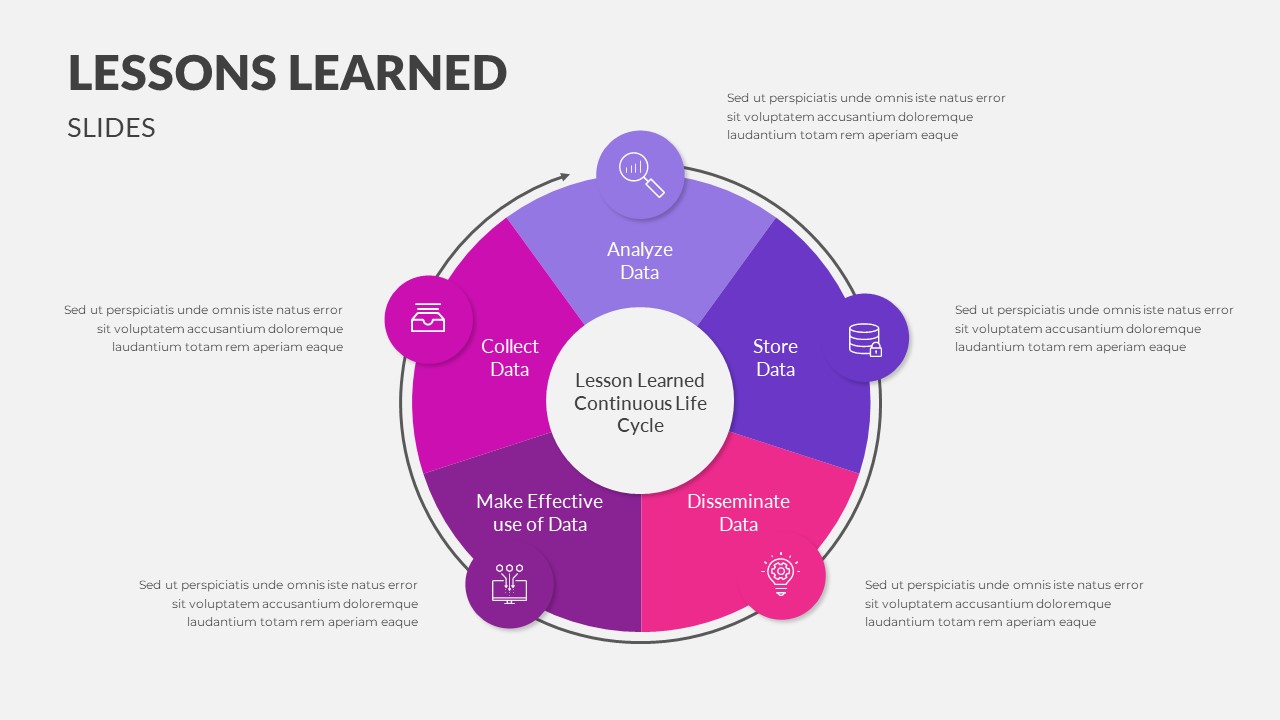
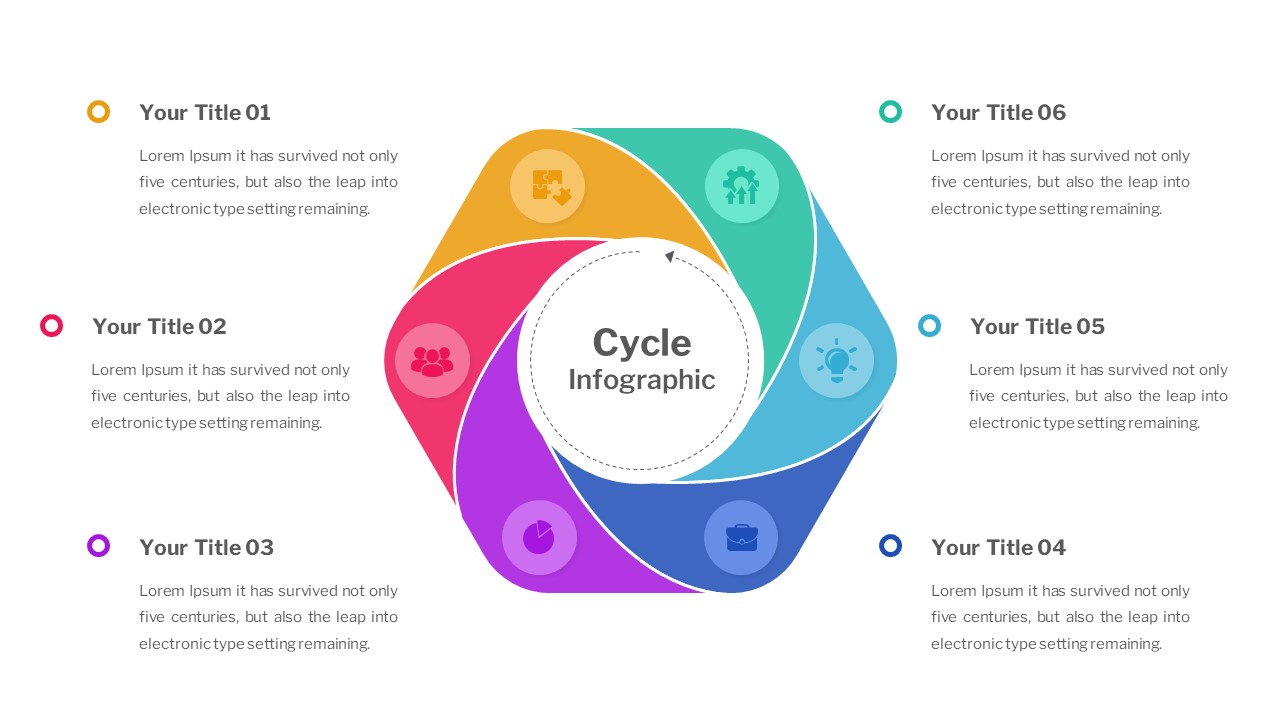
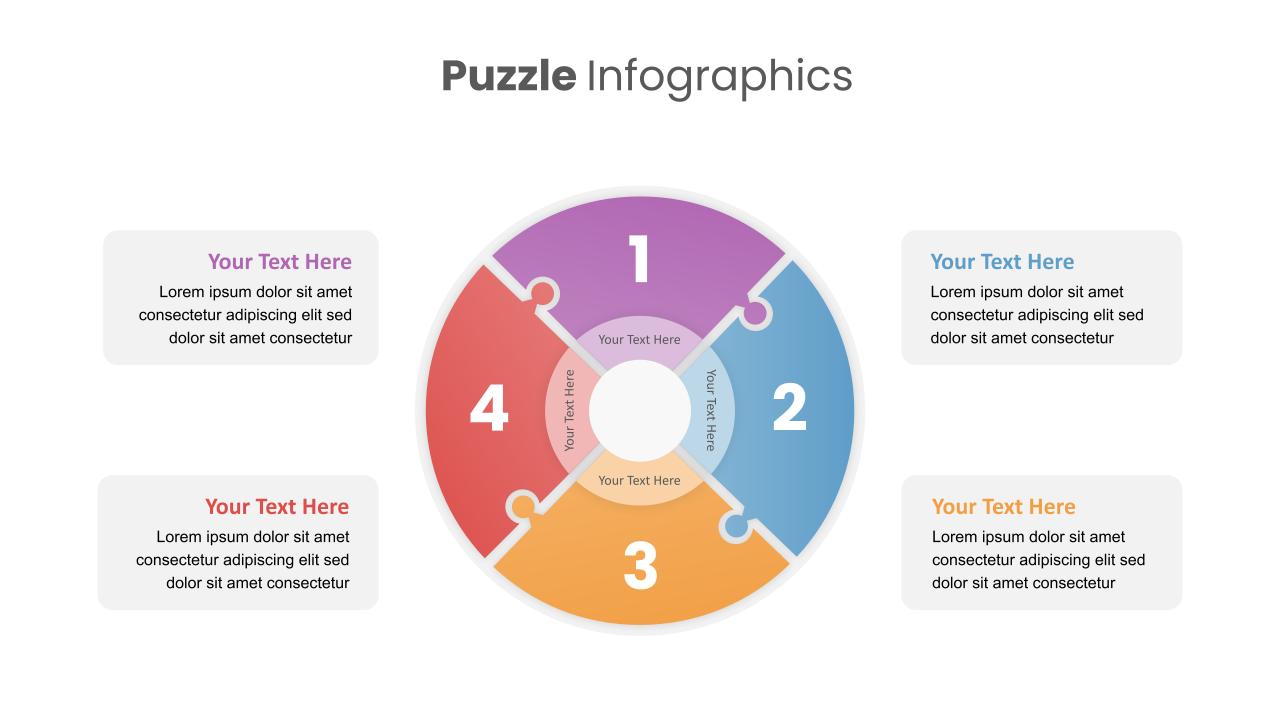
Present your demographic data in a clear, engaging, and colorful way with the Colorful Demographic Data Pie Chart Template. This Demographics PowerPoint template is designed to make complex data visually appealing and easy to understand. At the center of the slide, a pie chart divides information into four distinct segments, each color-coded to represent different groups or categories. The demographic infographic pie chart PowerPoint presents a quadrant text box diagram with a pie chart in the center. It allows presenters to transmit demographic characteristics such as population size, distribution, composition, and structure. This chart will show percentages with the help of color segments.
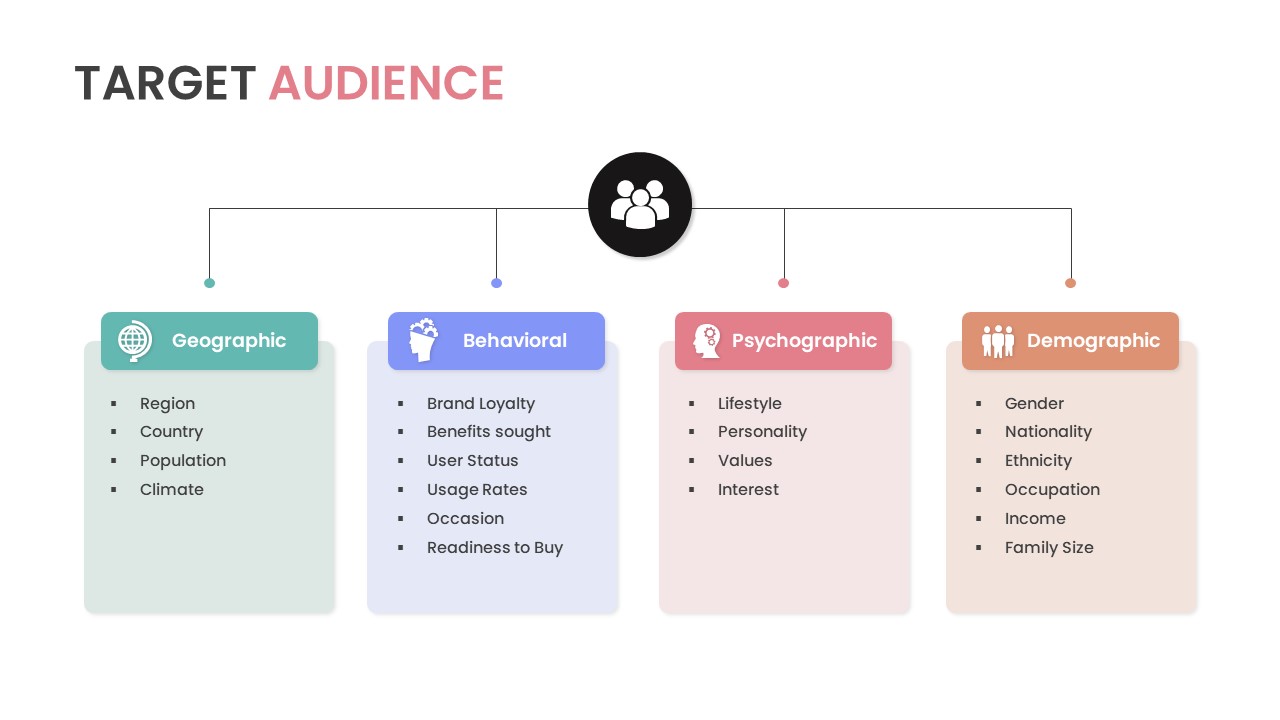
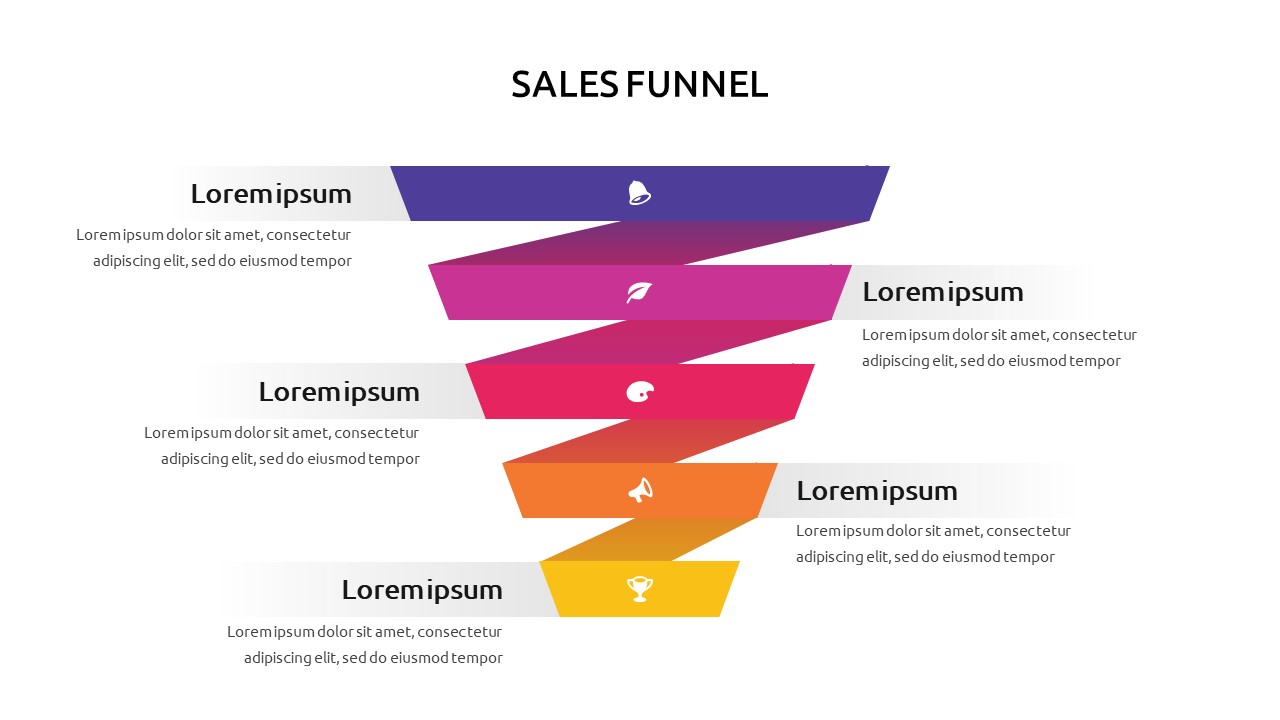
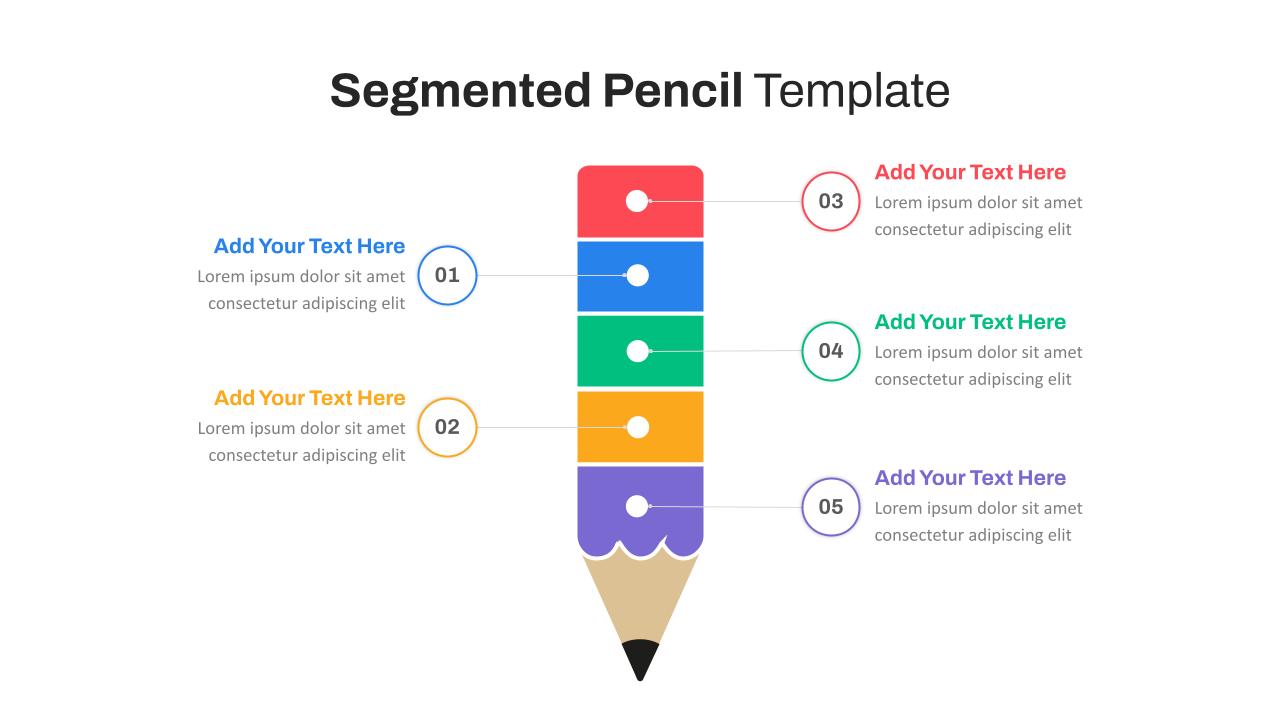
A demographic slide template is a visually appealing diagram that has four detailed text boxes in a straightforward view. This generic population PowerPoint template not only supports demographic data presentation but also shows any numerical report having a statistical value. For example, sales data, or any financial data can be displayed using the demographic slide. Users can add infographic icons, or color effects if they need a different look. Compatible with PowerPoint and Google Slides, this template allows for easy customization, so you can tailor it to your specific content needs. Download data presentation charts now!
See more

Aspect Ratio
16:9Item ID
SKT00694
FAQs
You May Also Like These Presentation Templates


- Free
- Free
- Free


- Free
- Free
- Free
- Free
- Free
- Free
- Free
- Free