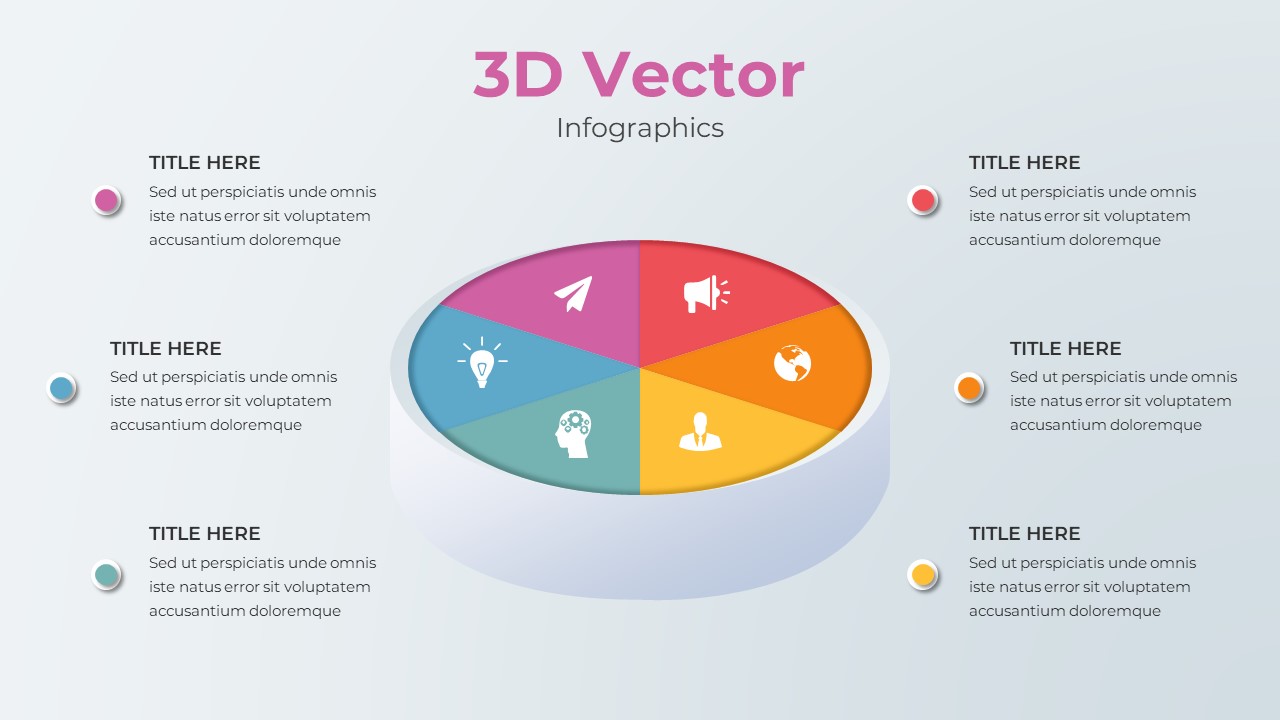
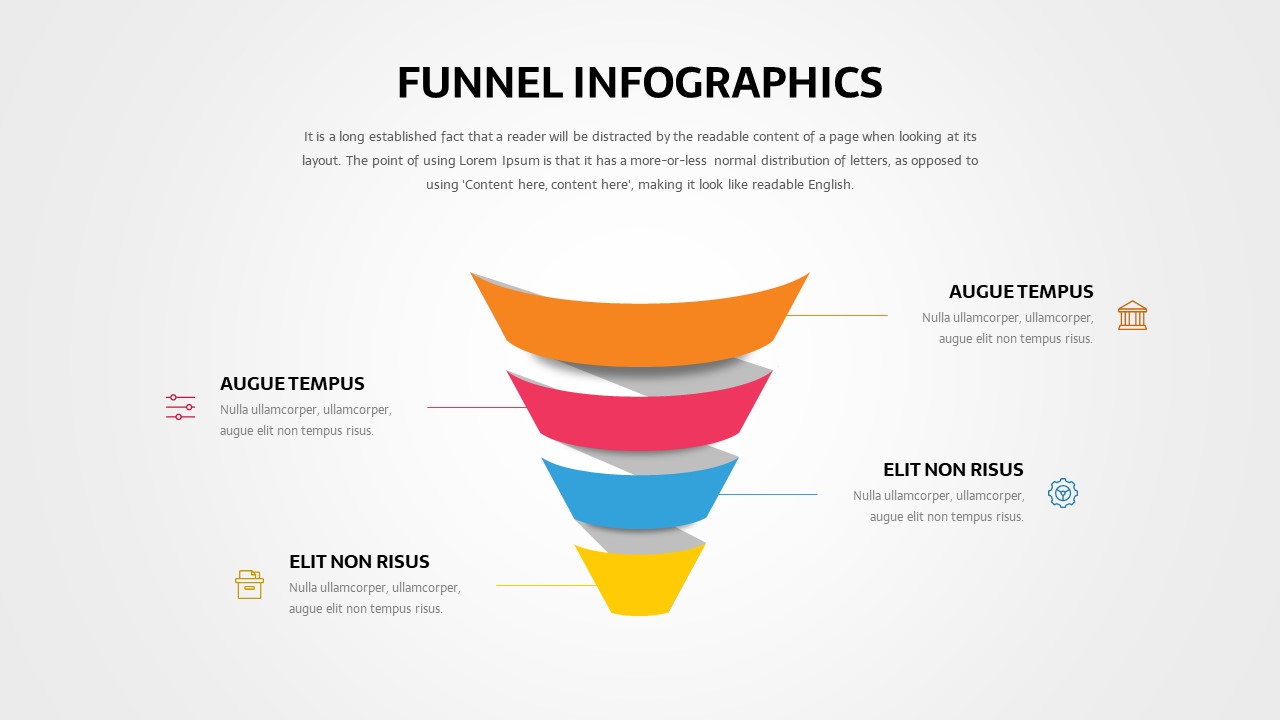
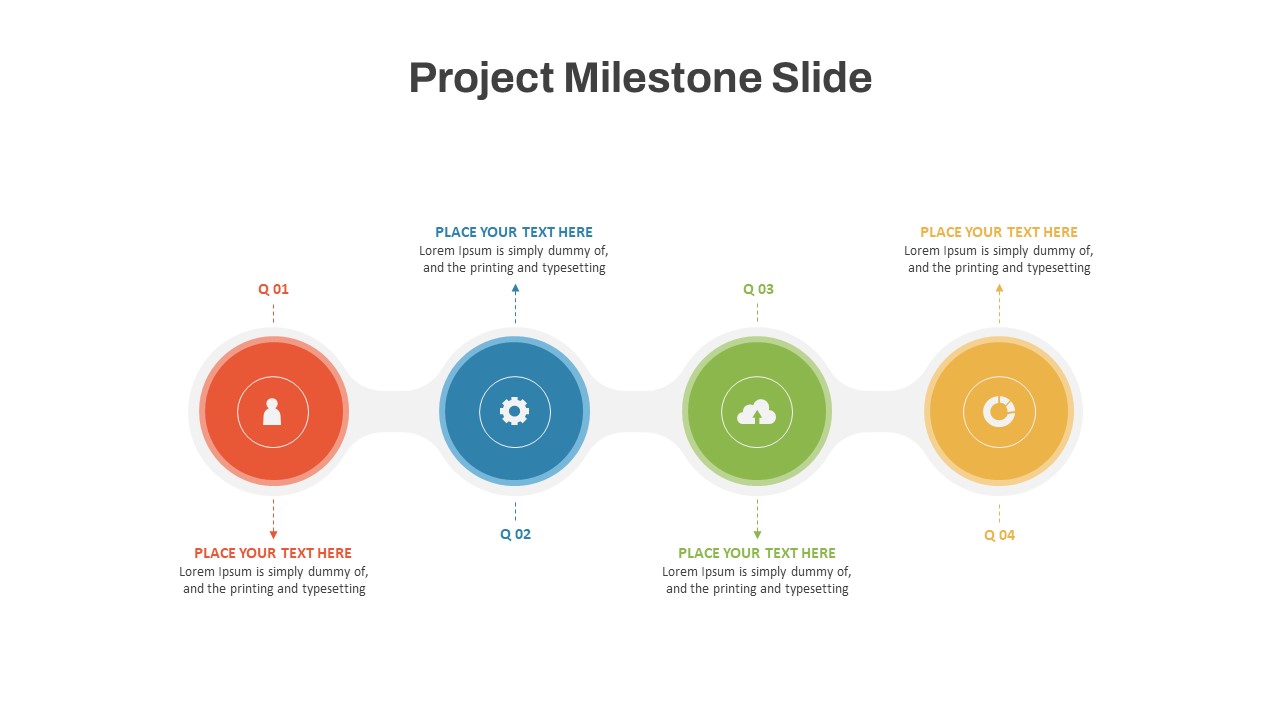
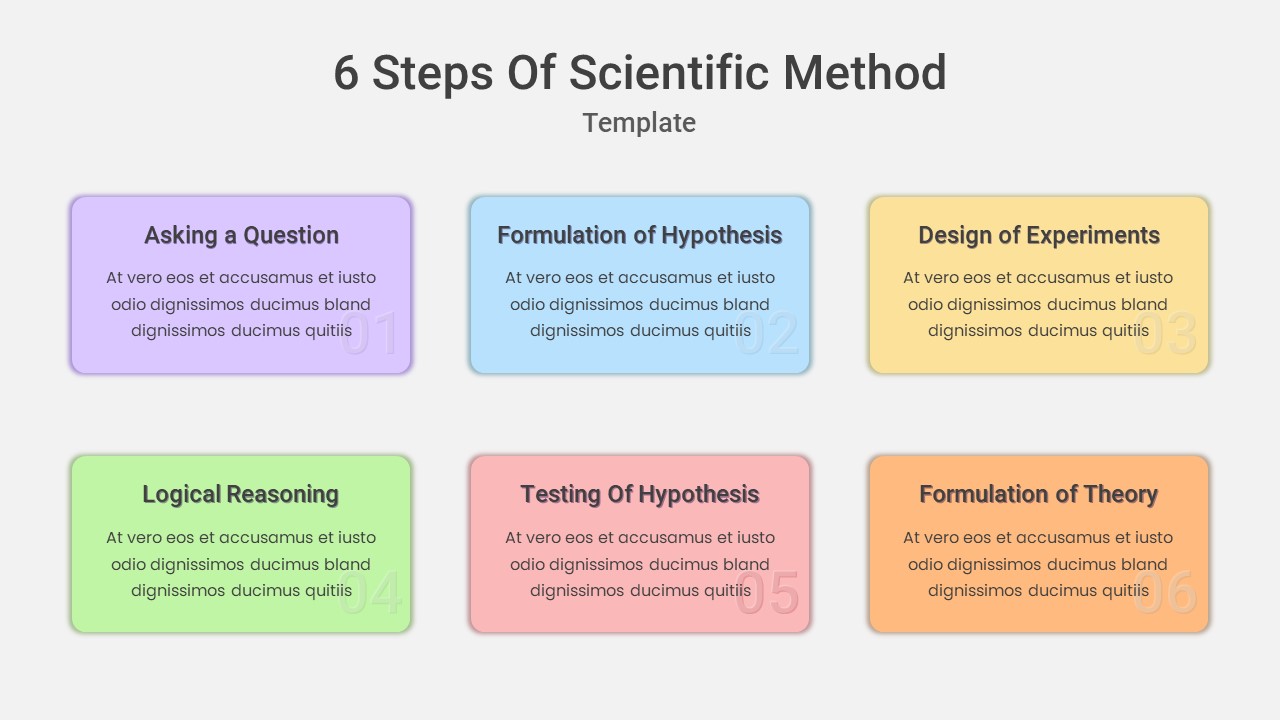
Colorful Pie Chart Presentation Template

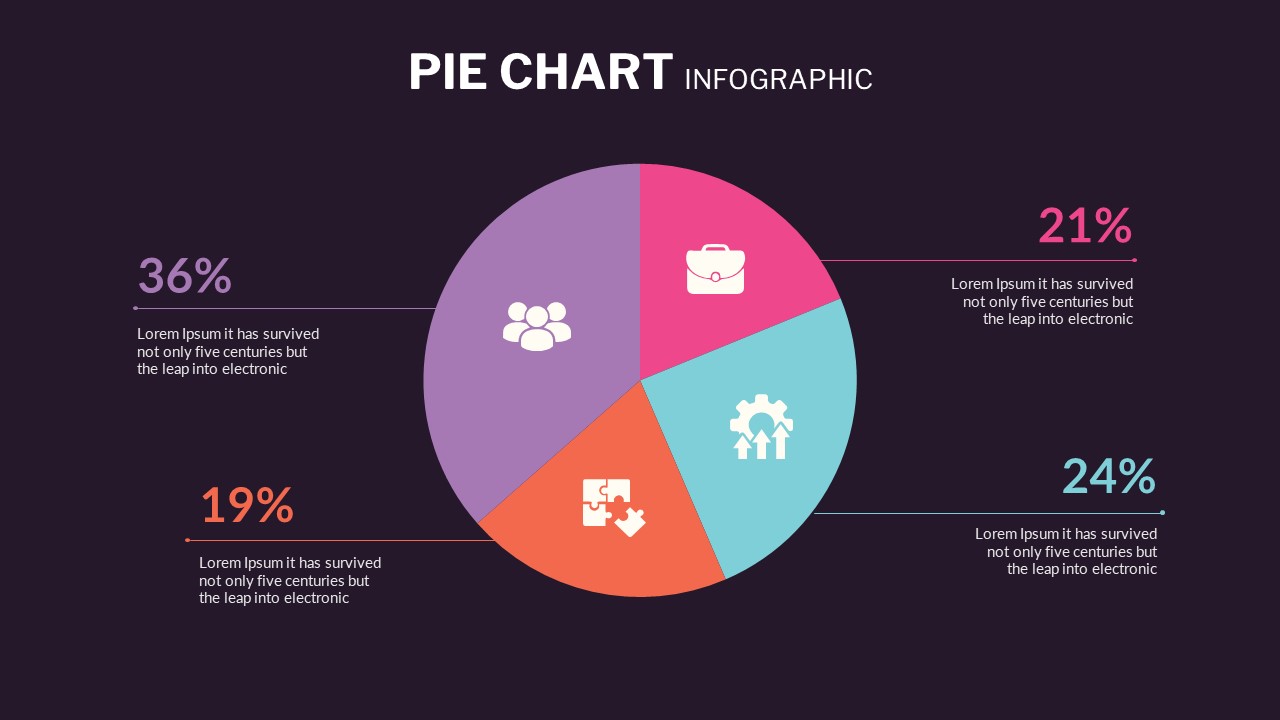
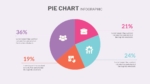

The Colorful Pie Chart Infographic Template is an excellent tool for presenting data distribution in a clear and visually engaging format. This pie chart presentation template features a four-segment pie chart, each section with a different color to represent distinct categories or metrics. With accompanying icons and text labels for each segment, this layout makes it easy to interpret data at a glance. Percentages and descriptions are neatly aligned to explain each segment’s significance, ensuring the audience can quickly grasp key insights.
Ideal for business analytics, marketing reports, financial data breakdowns, or project updates, this template simplifies complex data into a visually appealing chart. The balanced color scheme helps differentiate the segments, making it perfect for comparing categories such as market share, resource allocation, or customer demographics.
Fully customizable in both PowerPoint and Google Slides
See more

Aspect Ratio
16:9Item ID
SKT00656
FAQs
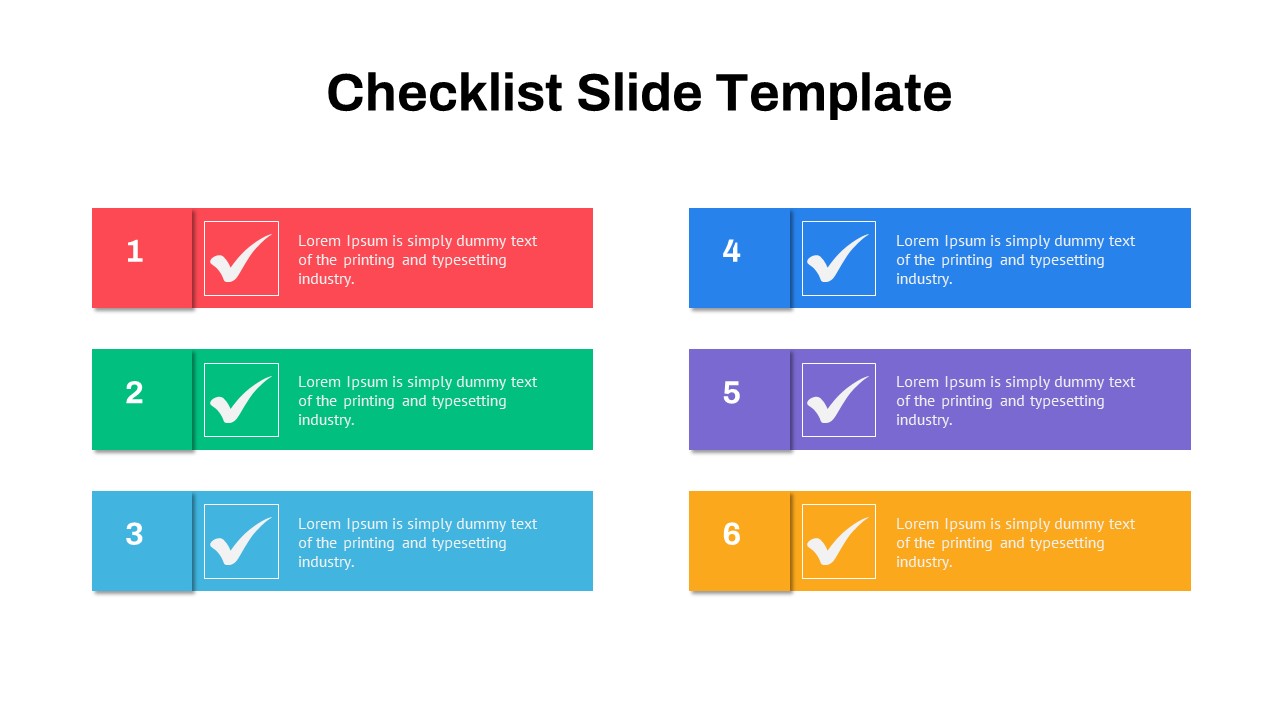
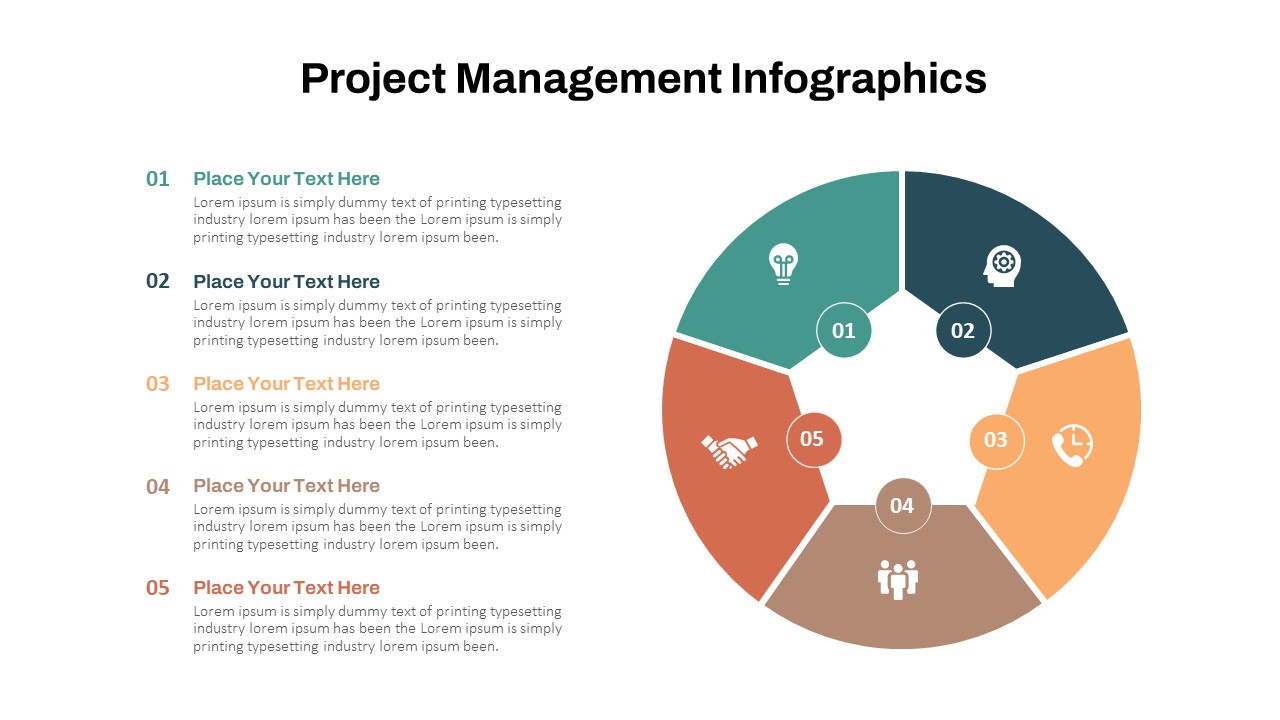
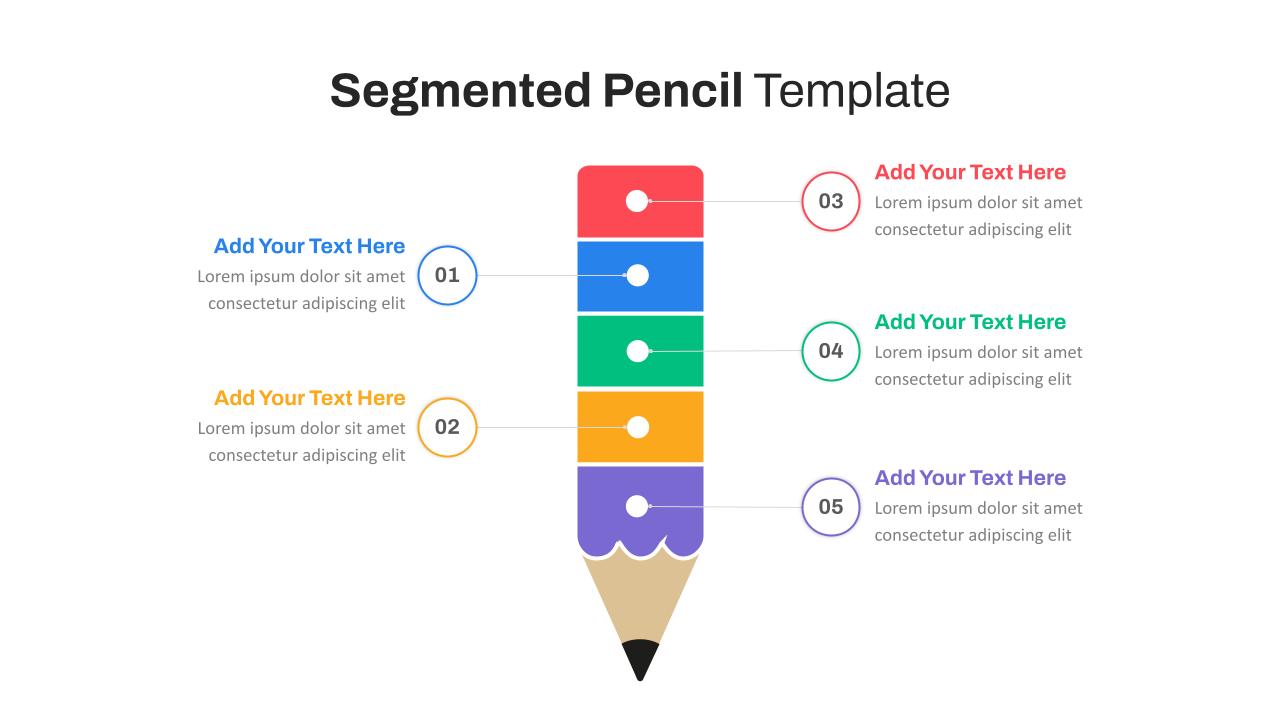
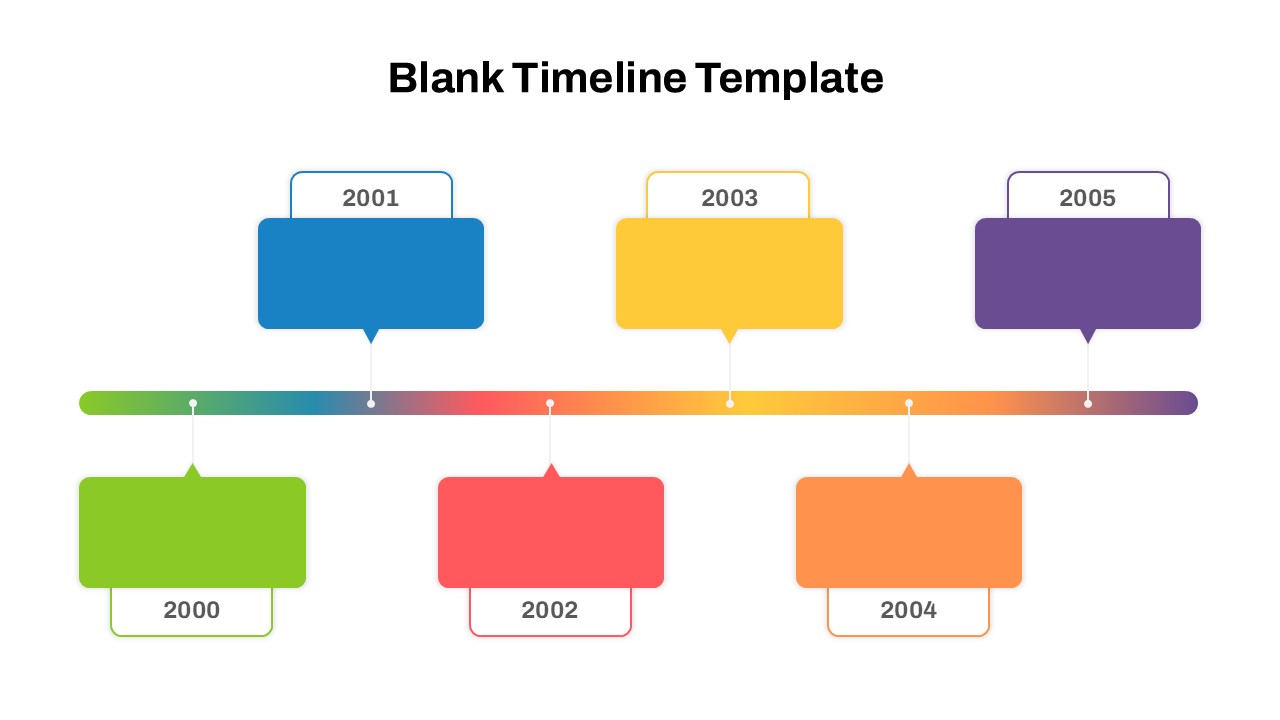
You May Also Like These Presentation Templates


- Free
- Free

- Free

- Free
- Free

- Free
- Free
- Free
- Free
- Free