Customer Feedback Loop Diagram Template for PowerPoint & Google Slides
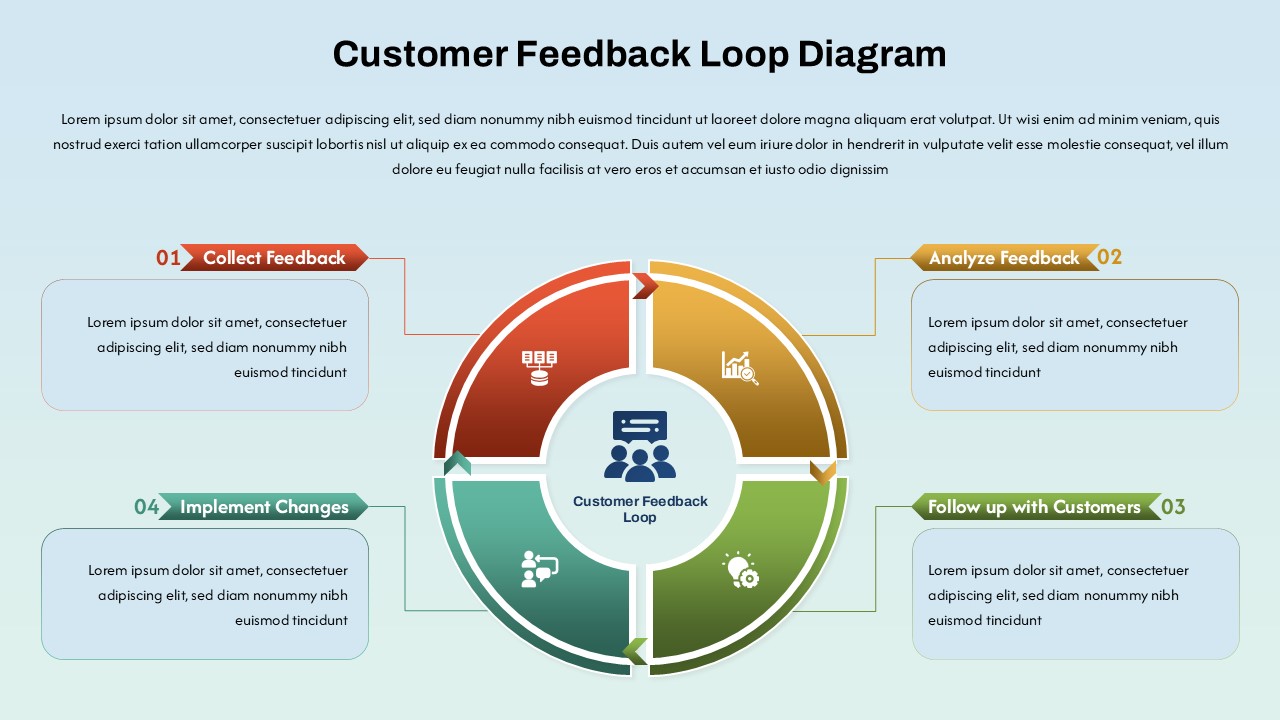
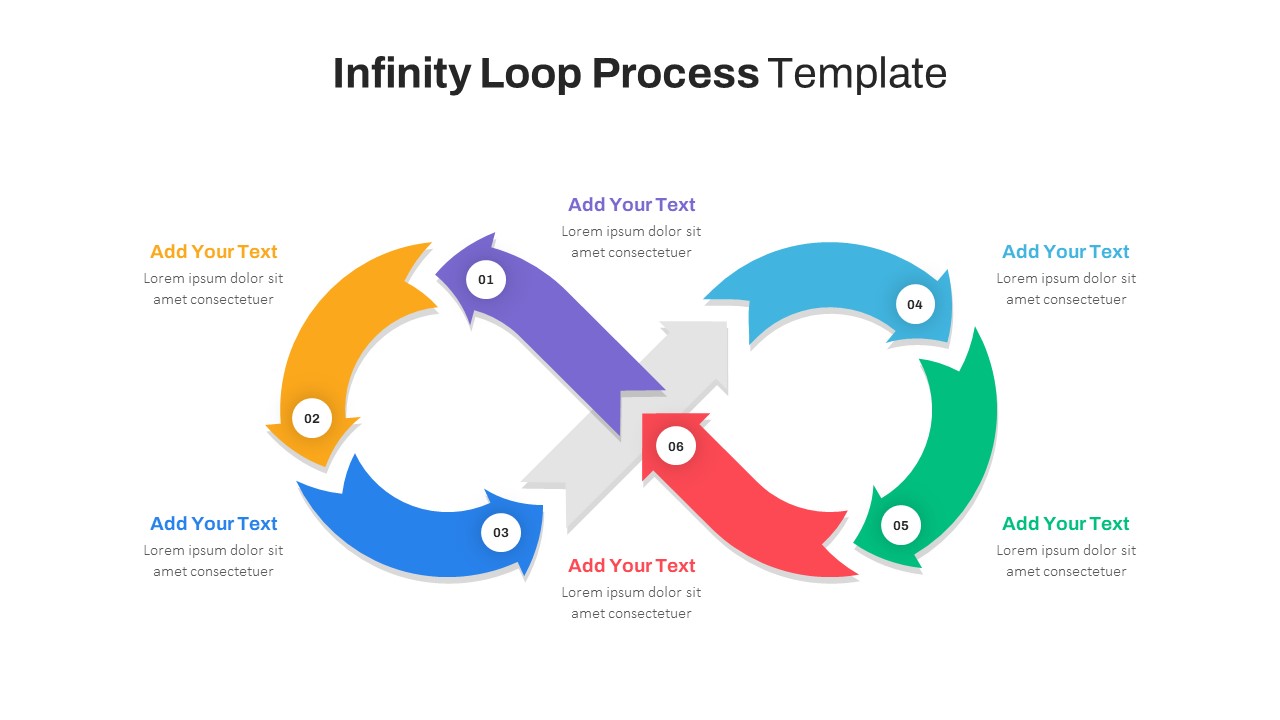
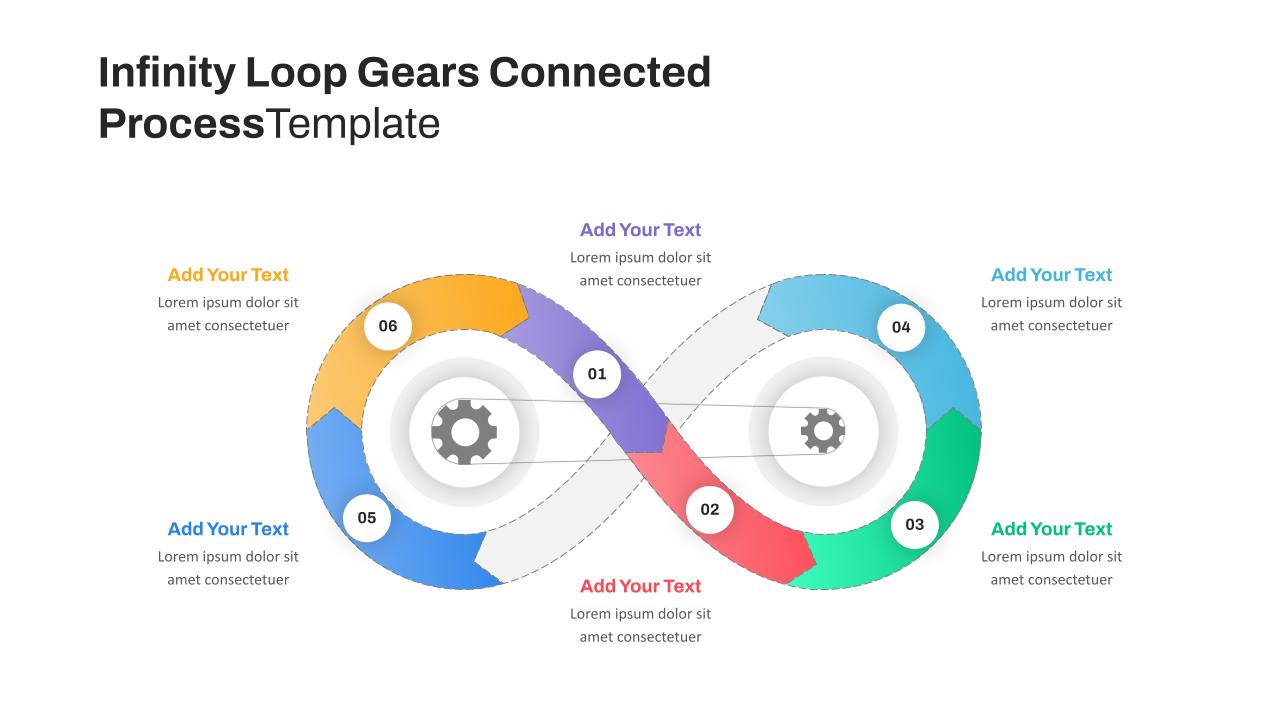
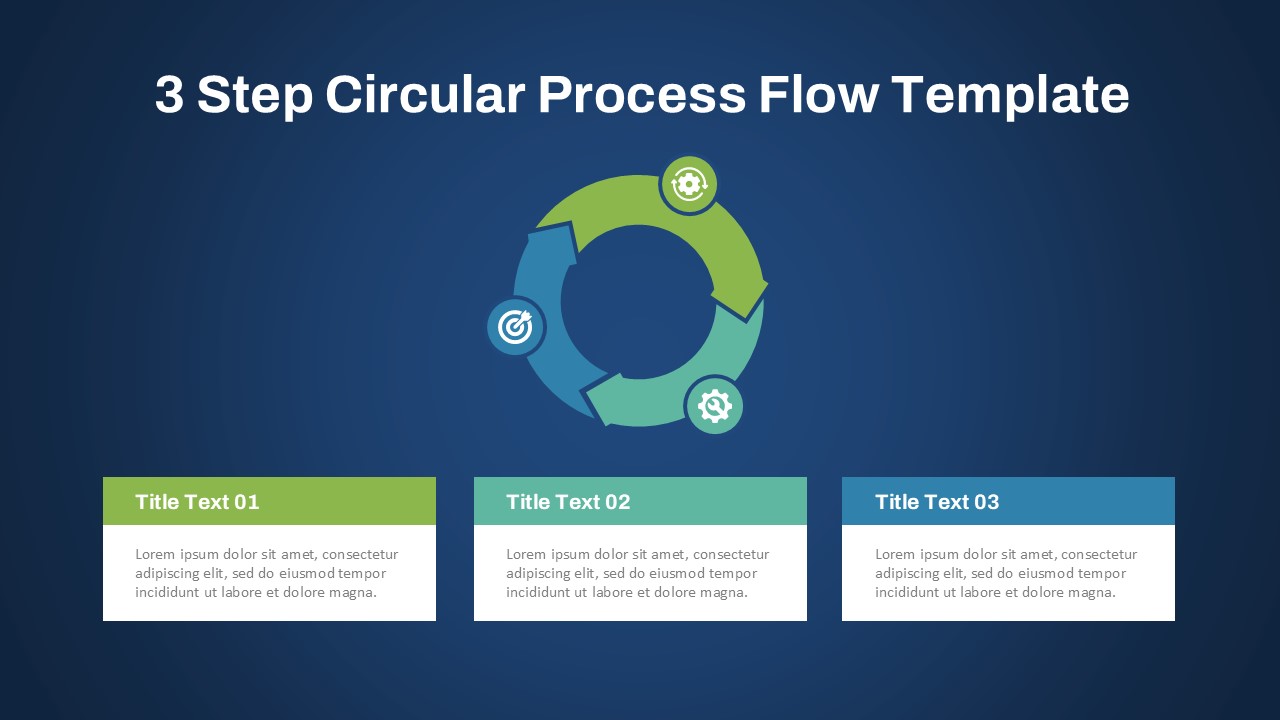
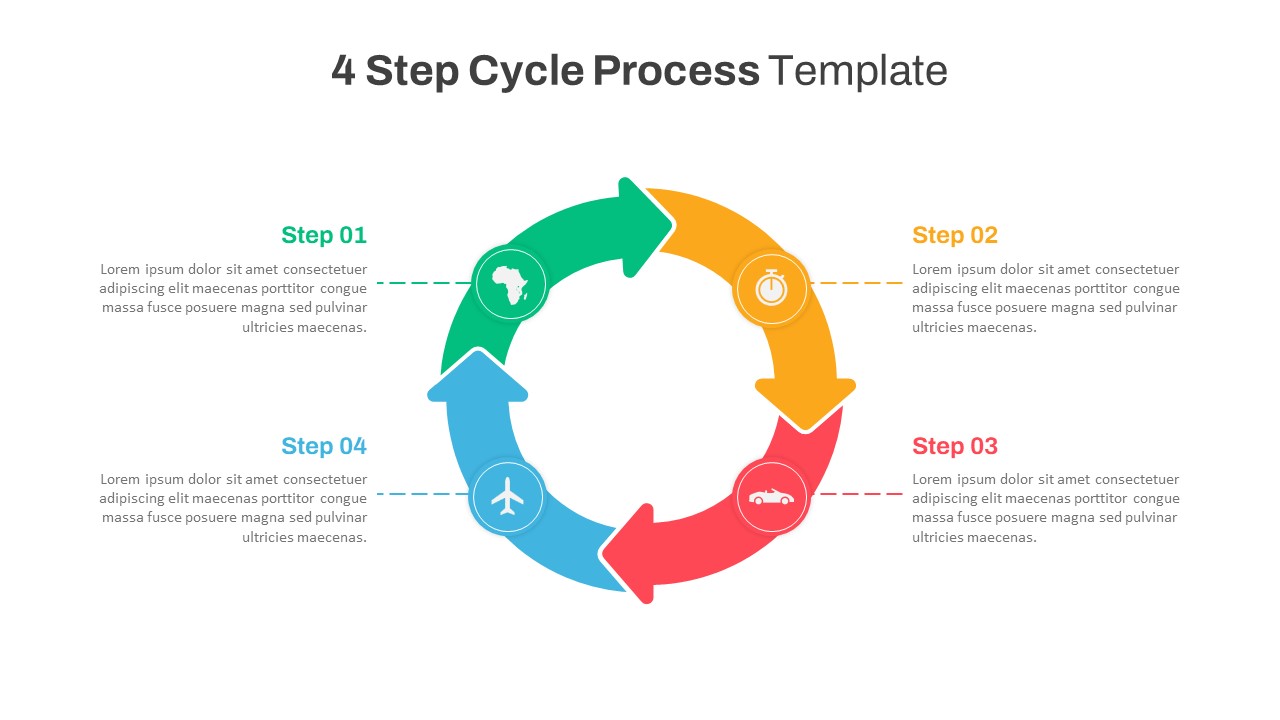
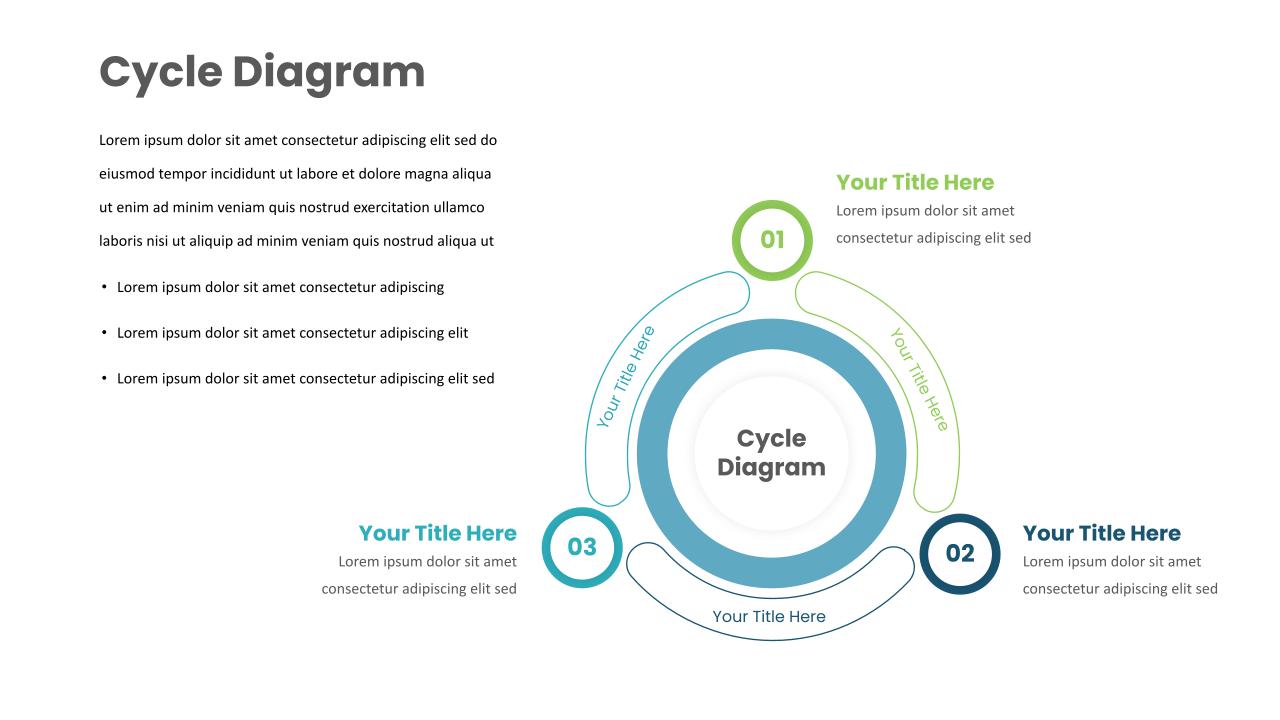
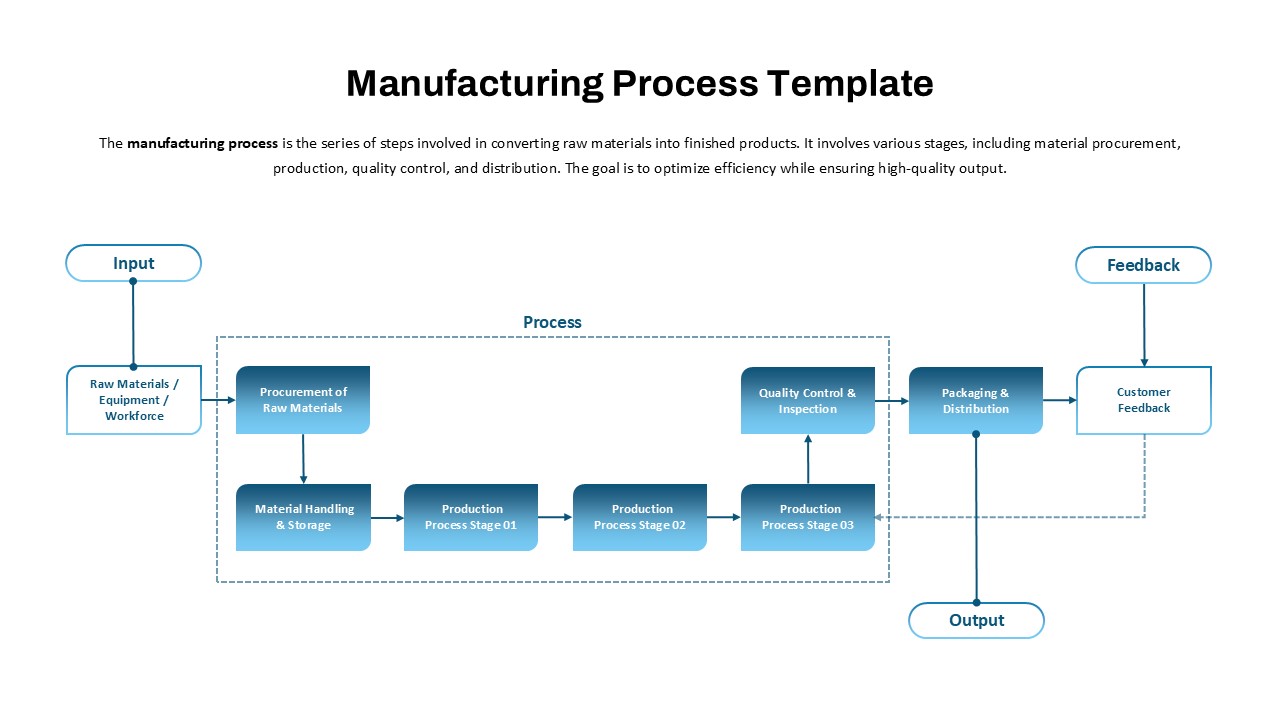
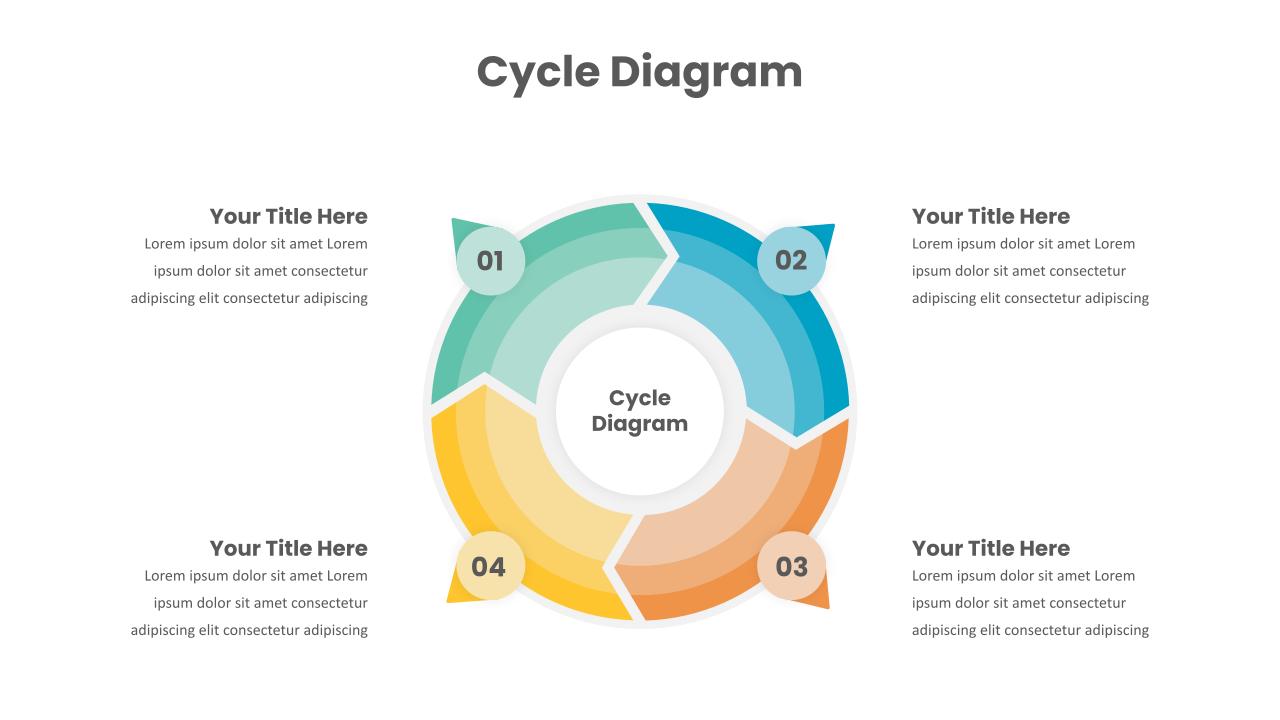
The Customer Feedback Loop Diagram Template is a powerful tool for organizations that want to improve customer satisfaction through continuous feedback and responsive action. This template visually represents the cyclical process of gathering, analyzing, and acting on customer feedback to enhance products, services, and overall customer experience.
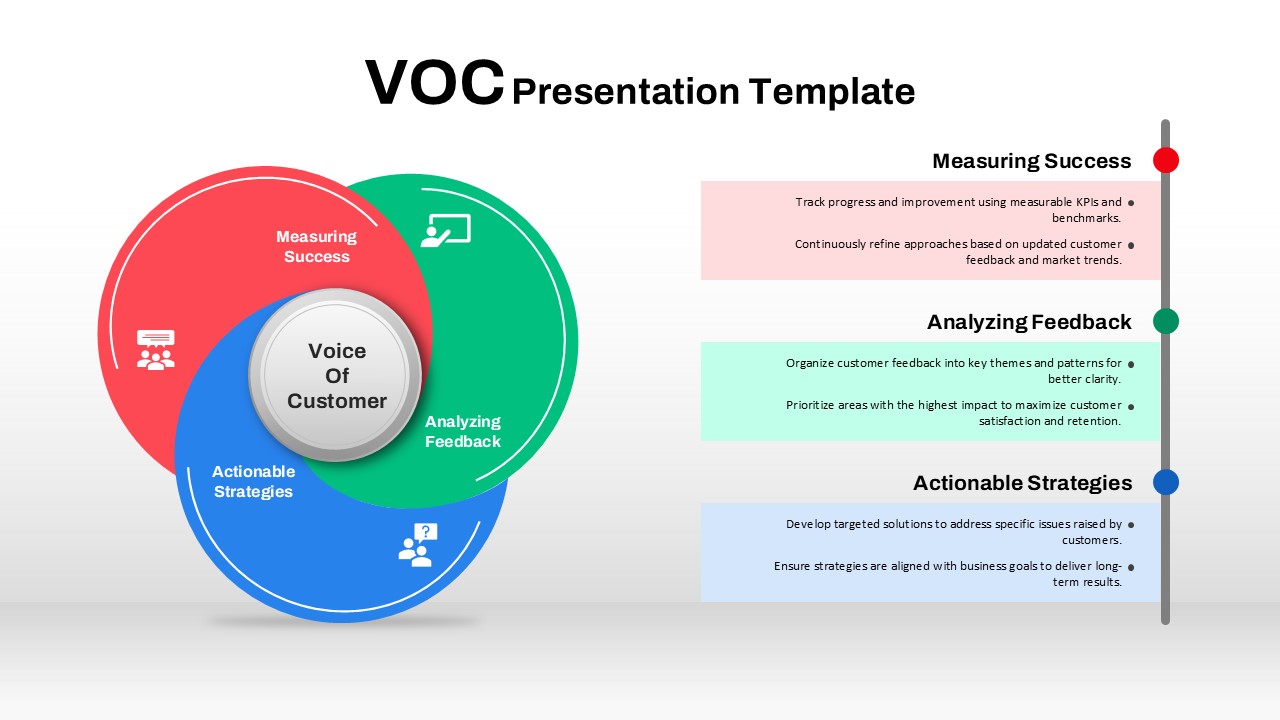
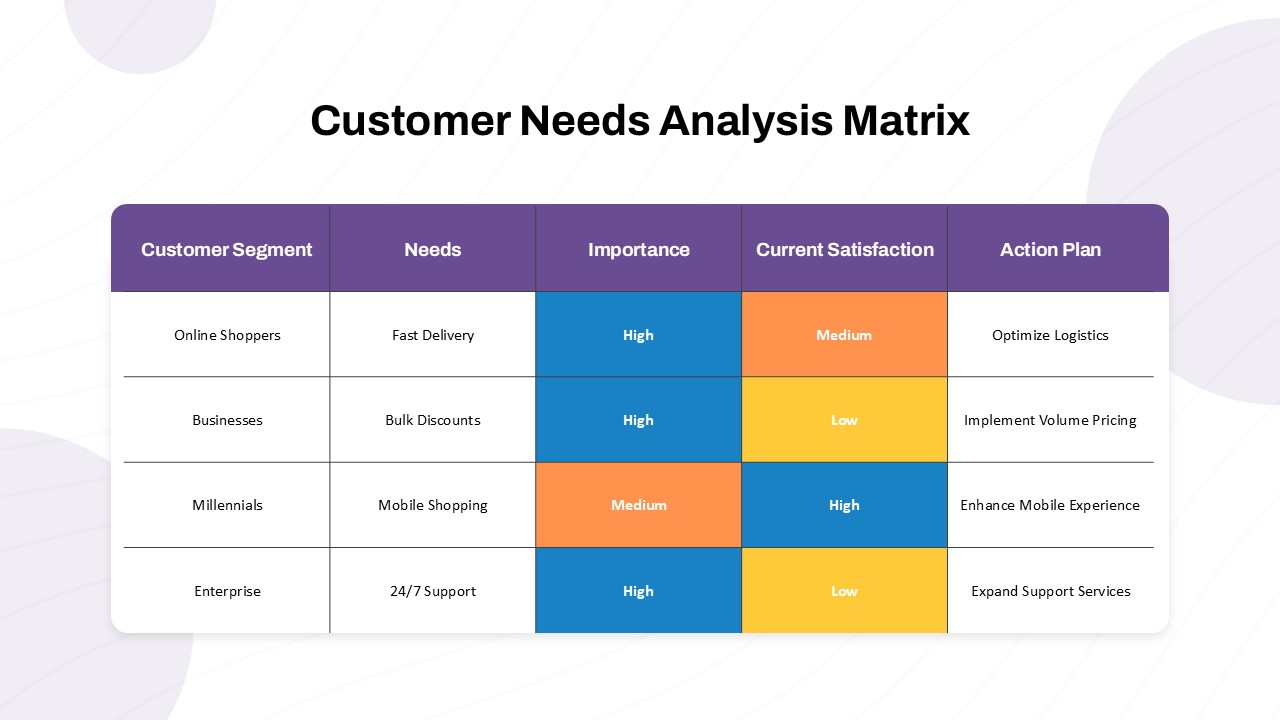
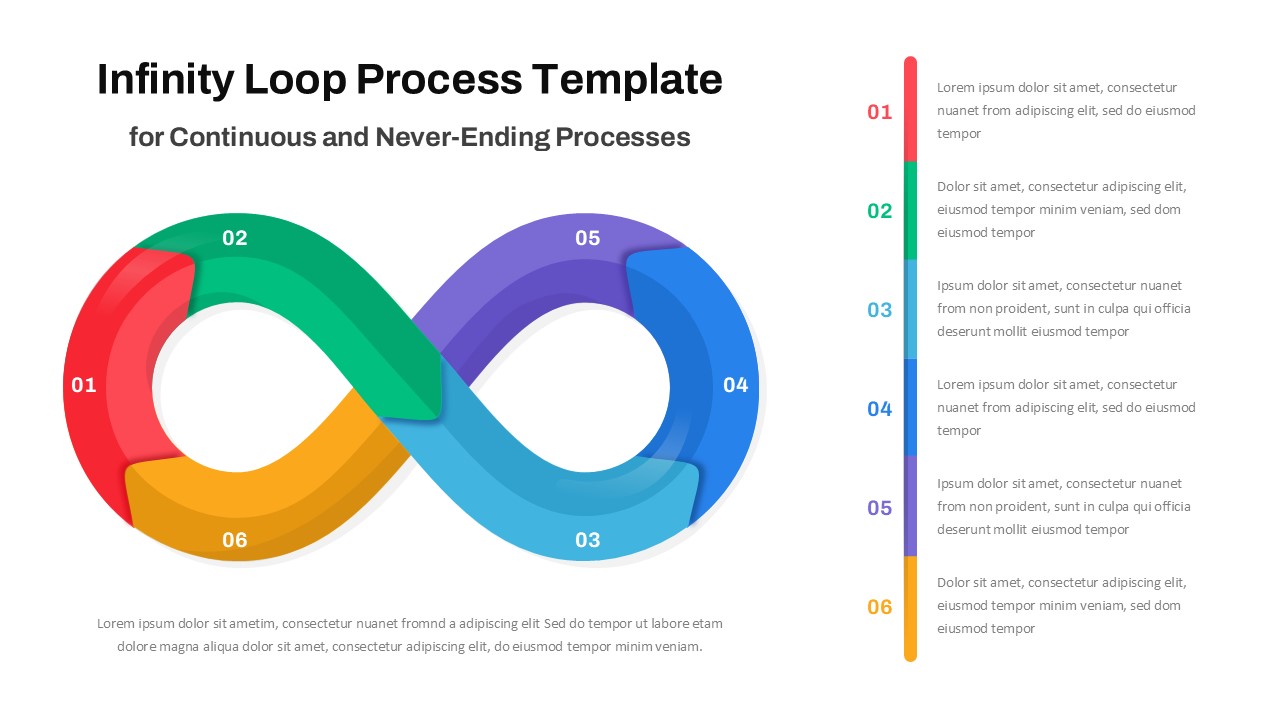
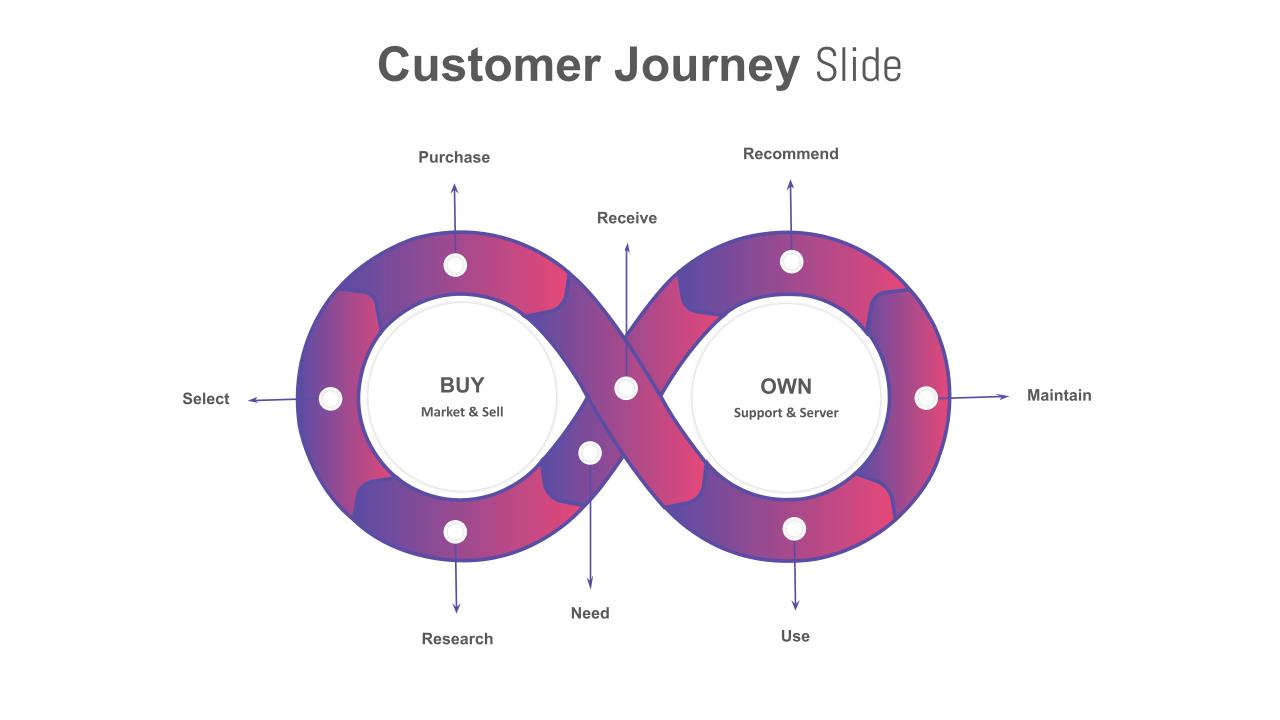
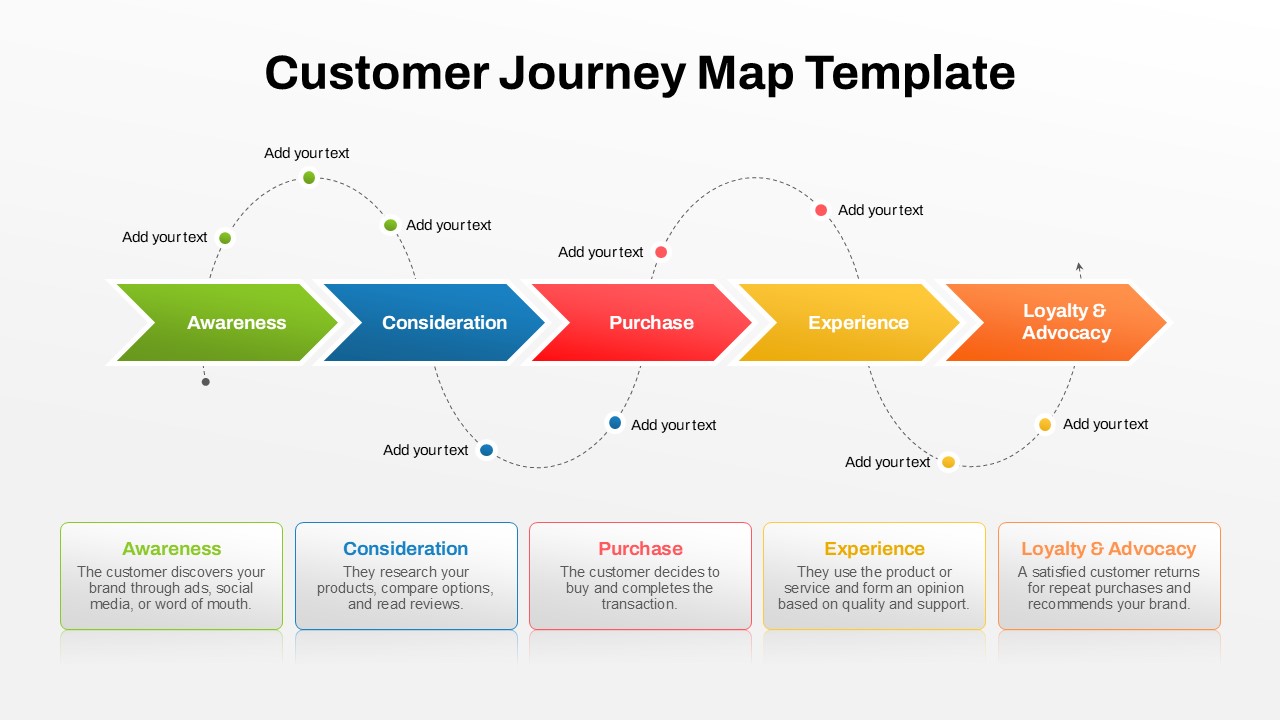
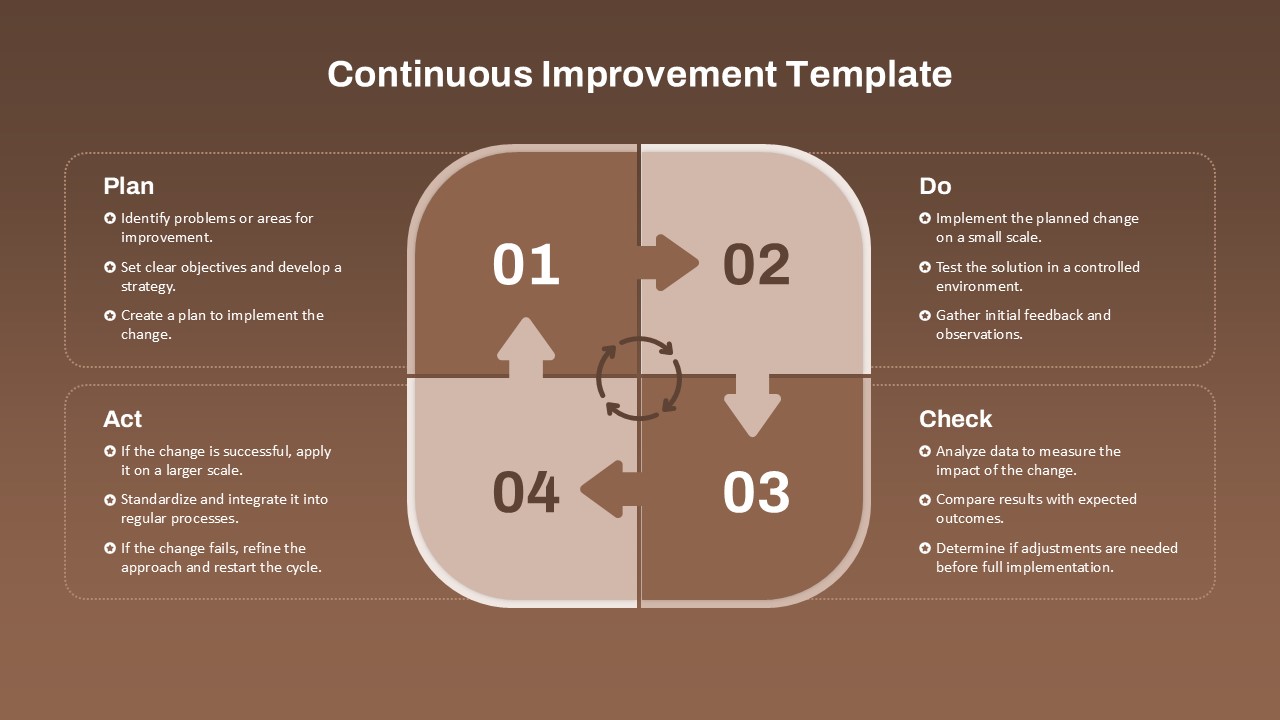
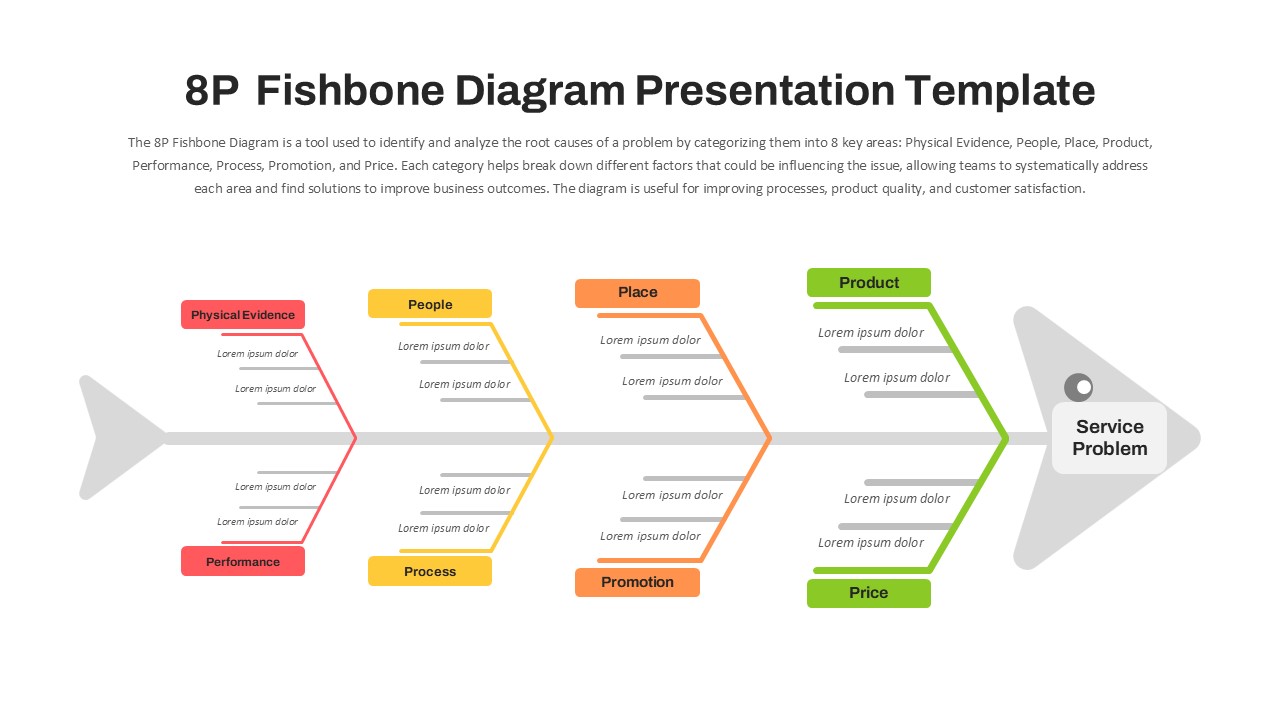
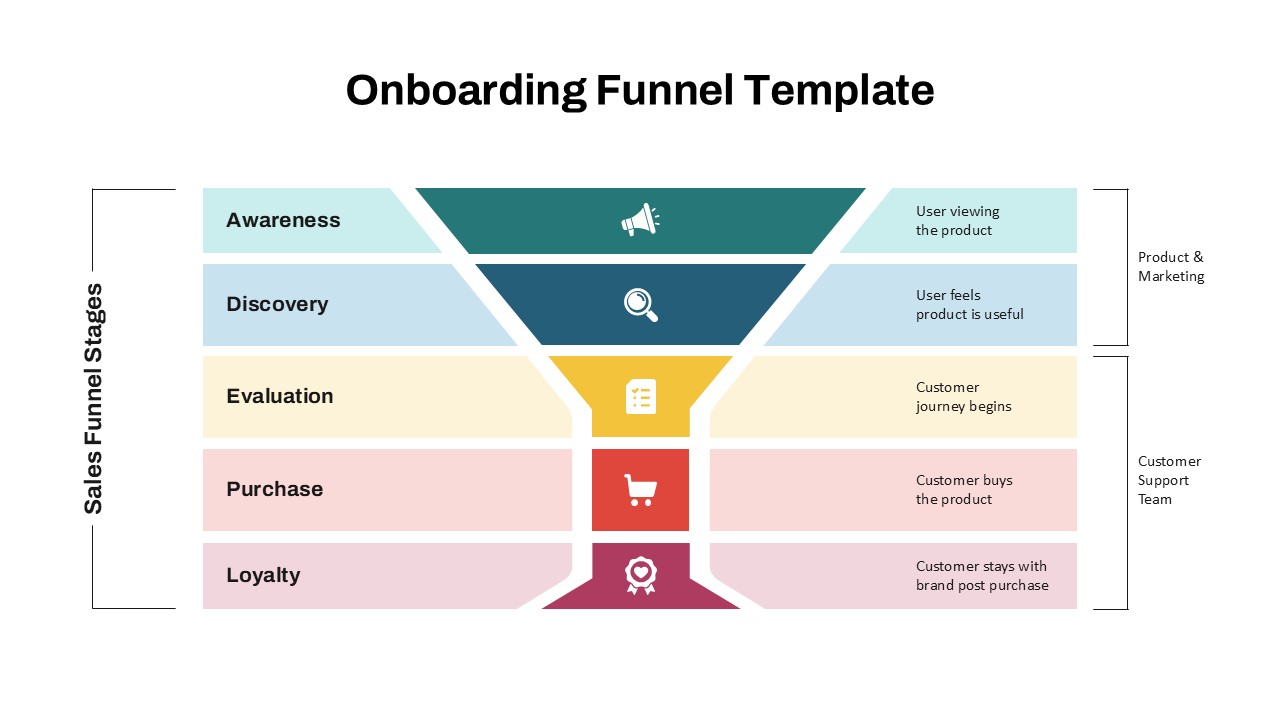
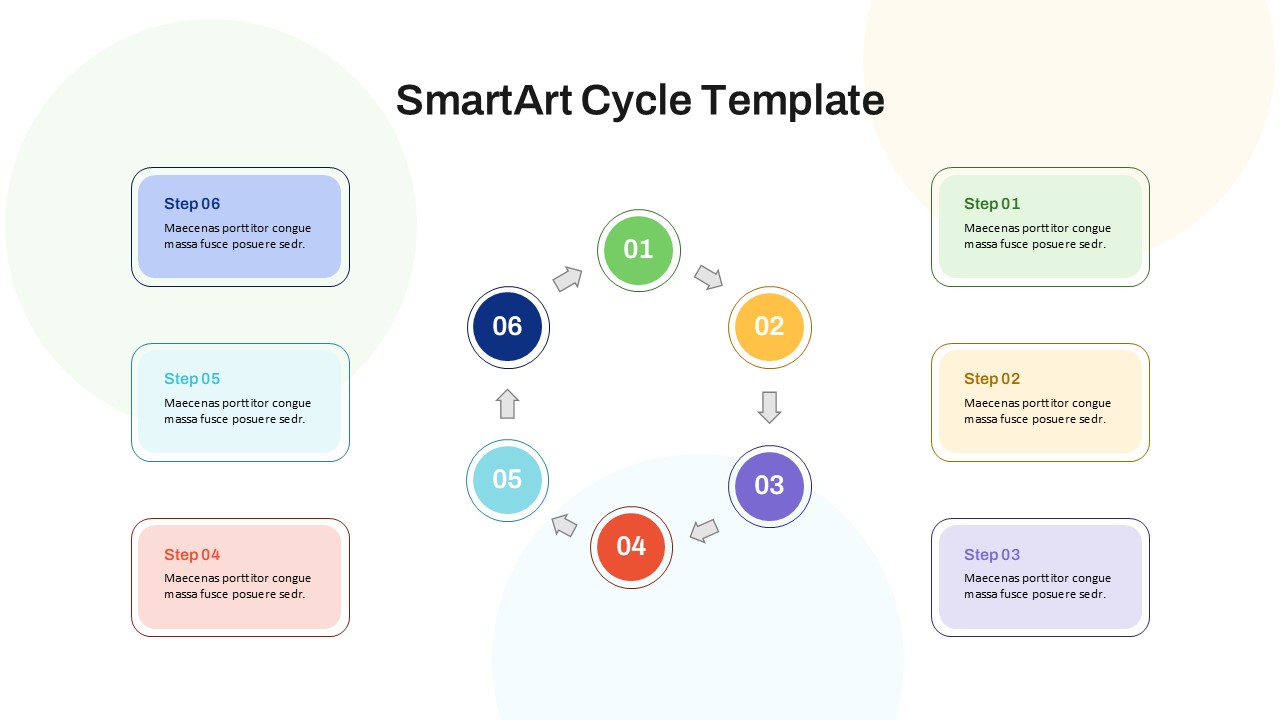
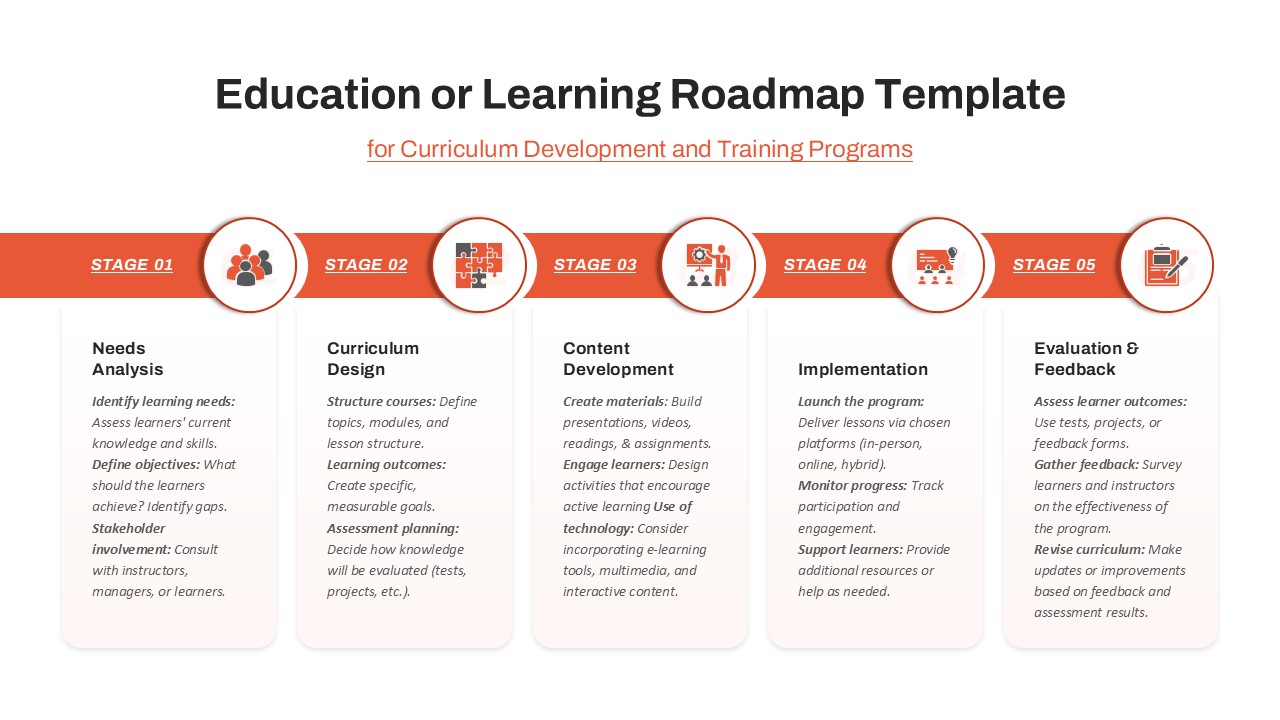
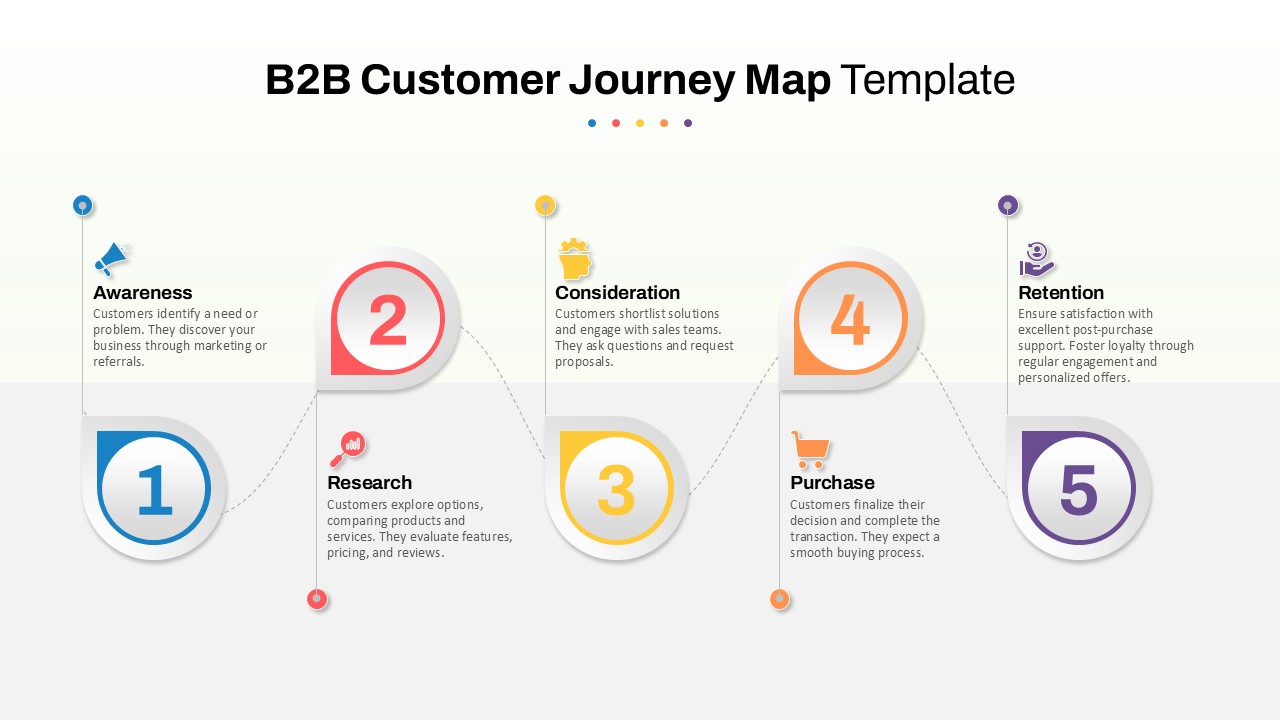
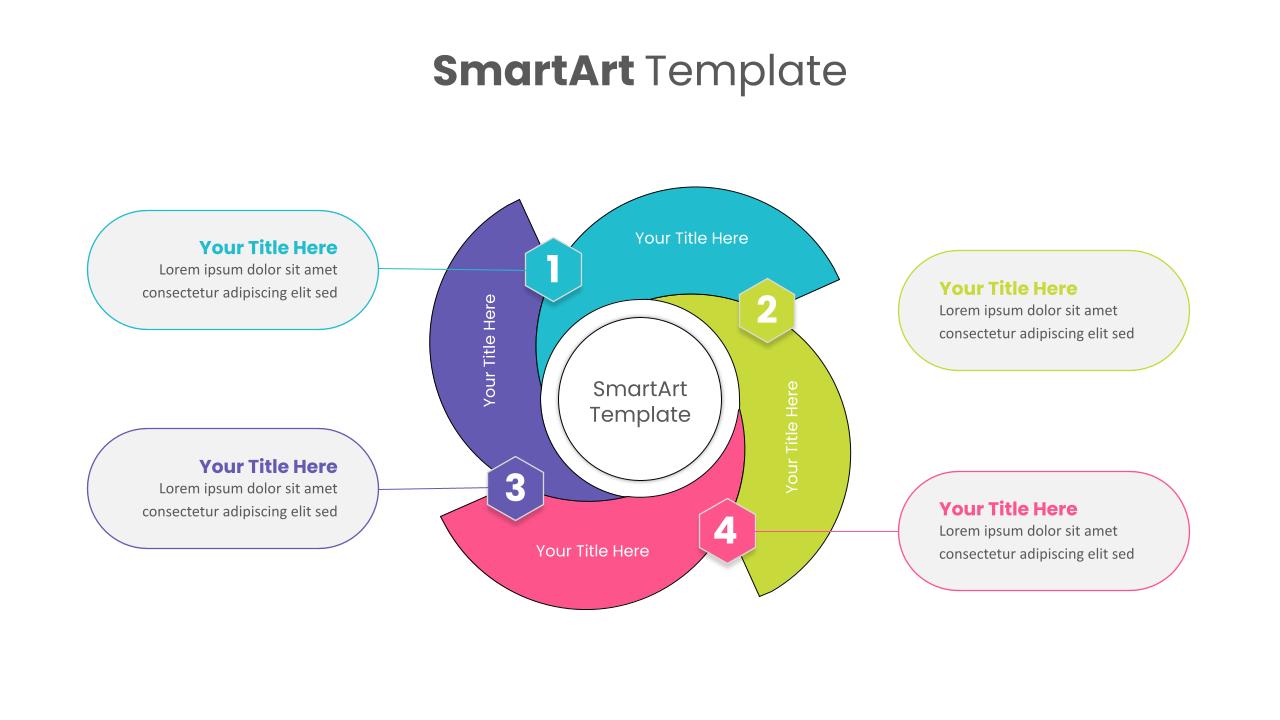
The process begins with Step 1: Collect Feedback, where customer insights are gathered through surveys, interviews, or feedback forms. The collected data is then carefully analyzed in Step 2, identifying key areas for improvement, customer needs, and pain points. In Step 3: Follow up with Customers, companies reach out to acknowledge customer concerns, offer solutions, and build stronger relationships. Finally, Step 4: Implement Changes ensures that actionable insights lead to real-world improvements in processes, products, or services, closing the feedback loop and beginning the cycle anew.
This diagram serves as an ideal framework for customer success teams, product managers, and quality assurance specialists to ensure they consistently listen to and act upon customer feedback, driving continual improvement. The template’s clean, color-coded design makes it easy to communicate the feedback process to teams, clients, or stakeholders.
Designed for seamless use in both PowerPoint and Google Slides, this template is an essential resource for any business focused on creating customer-centric strategies and improving long-term customer loyalty.
See more

Aspect Ratio
16:9Item ID
SKT03578
Features of this template
Other User Cases of the Template:
Customer success management, product improvement strategies, market research presentations, quality assurance processes, client relationship management, service delivery enhancements, team workshops, customer satisfaction surveys, performance review meetings, business process optimization
FAQs
You May Also Like These Presentation Templates

- Free
- Free


- Free
- Free
- Free
- Free
- Free
- Free
- Free