Cyprus Map For PowerPoint and Google Slides
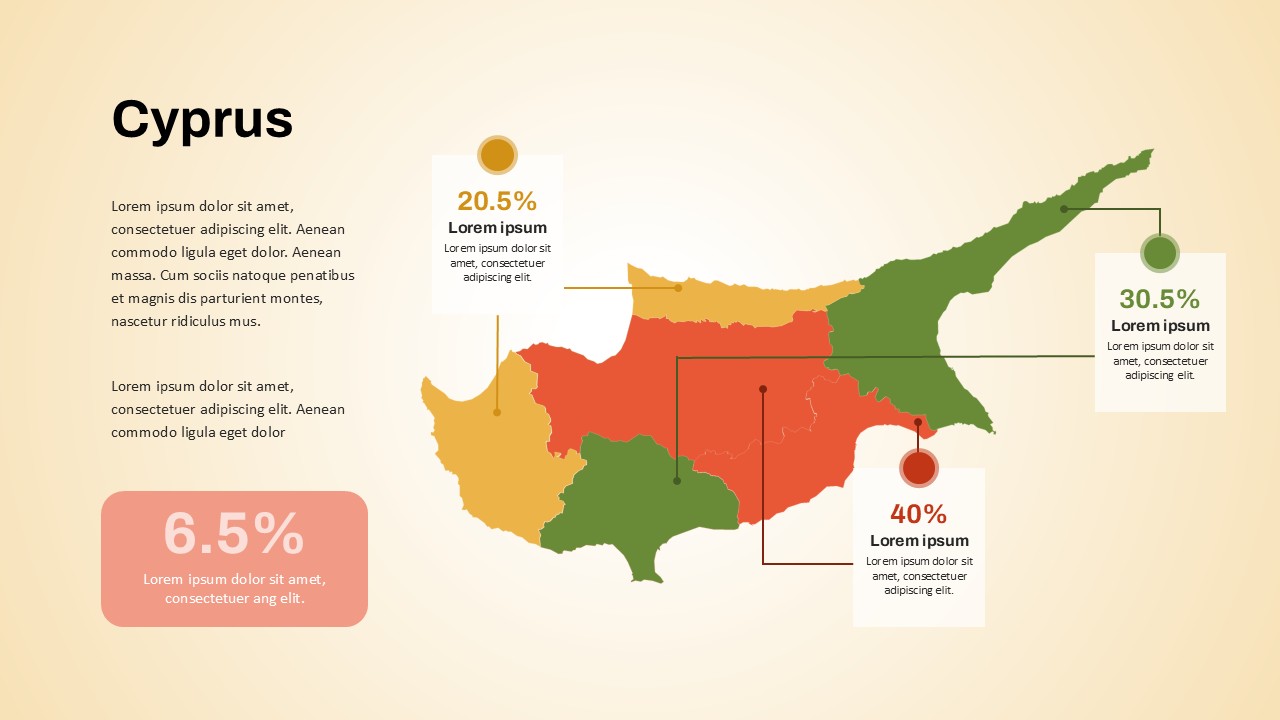
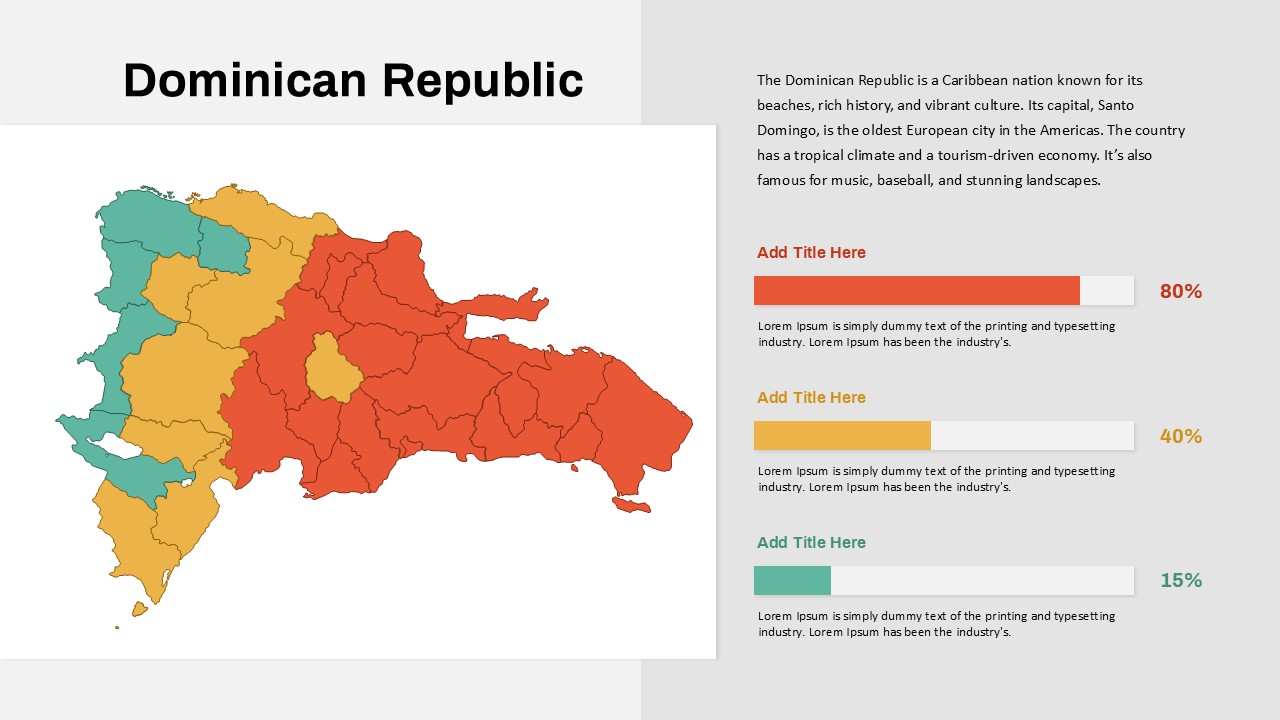
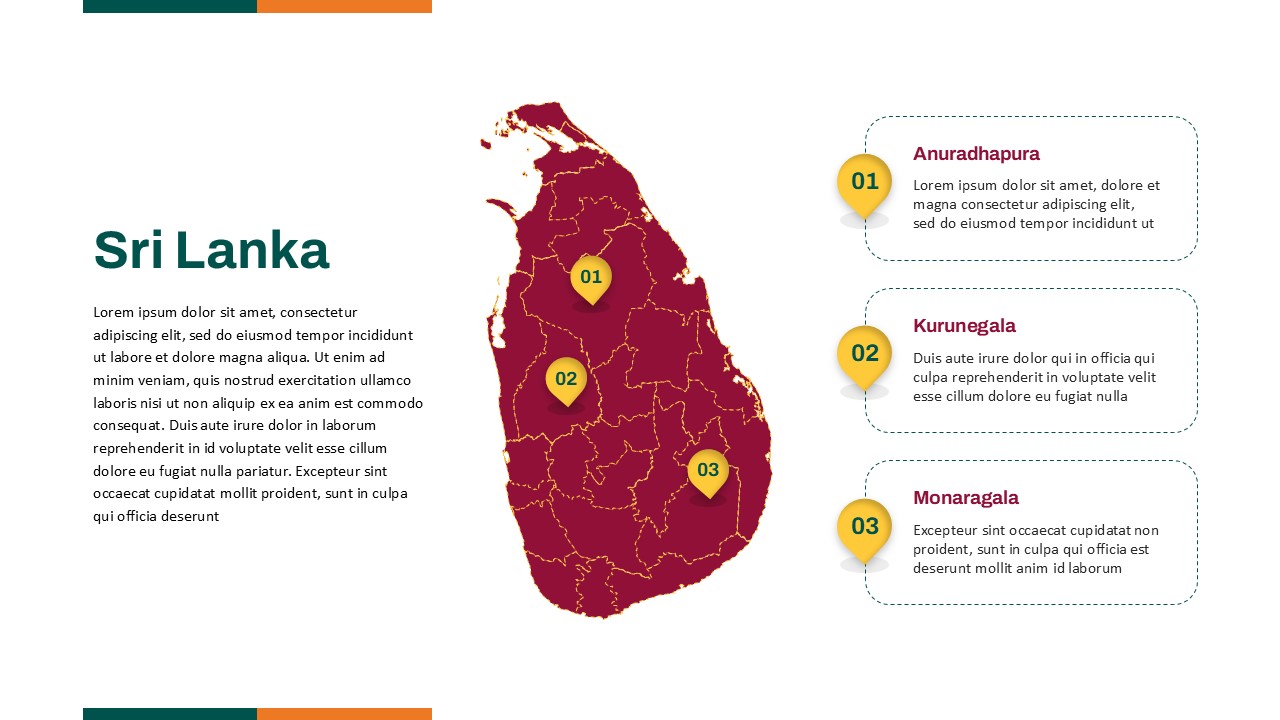
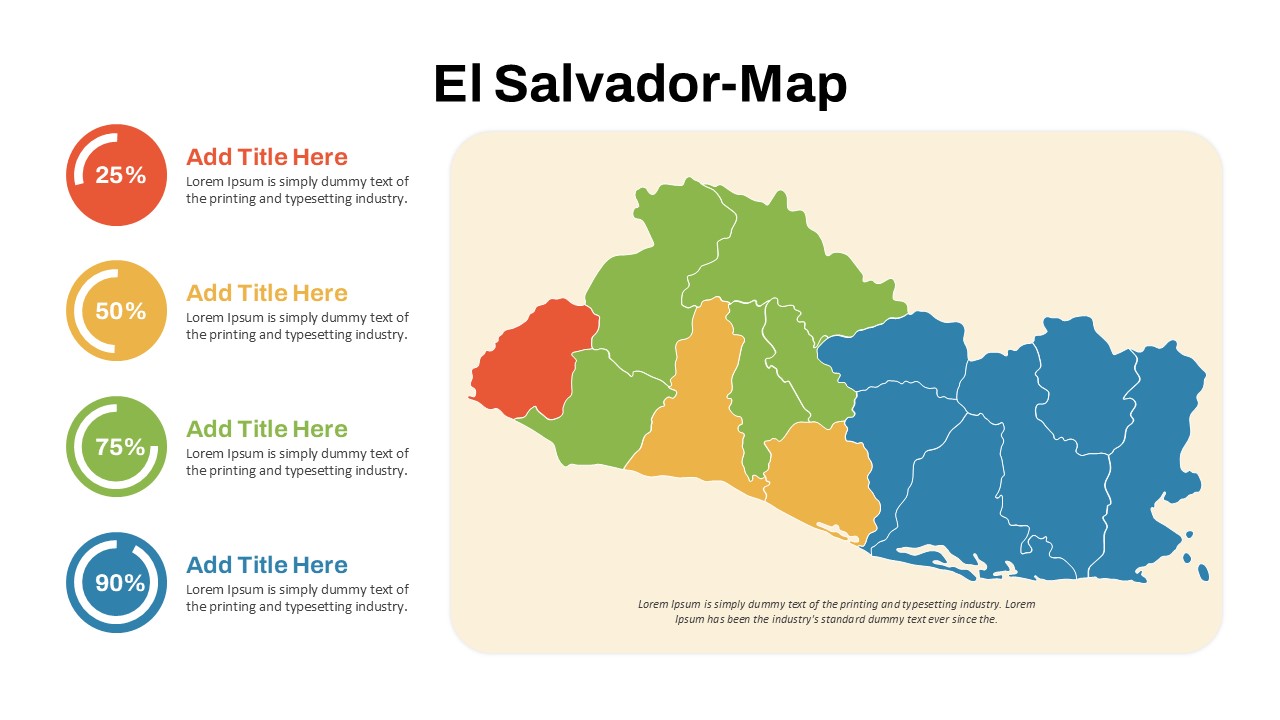
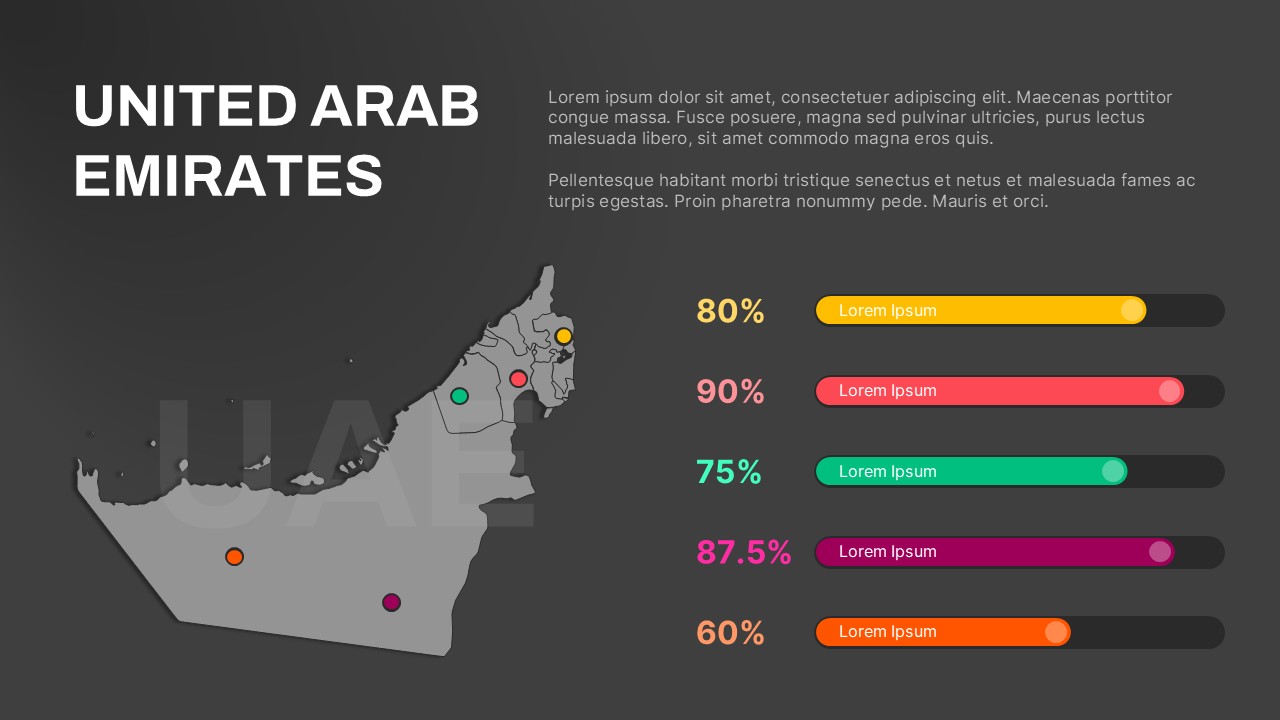
The Cyprus Map Template is a versatile and visually compelling tool designed to present regional data across the island of Cyprus. With its colorful, segmented map design, this map slide template allows users to highlight statistical information in a clear and engaging way. Whether you’re working on demographic data, market research, or any geographical analysis, this template provides an efficient way to visually display key metrics associated with different regions.
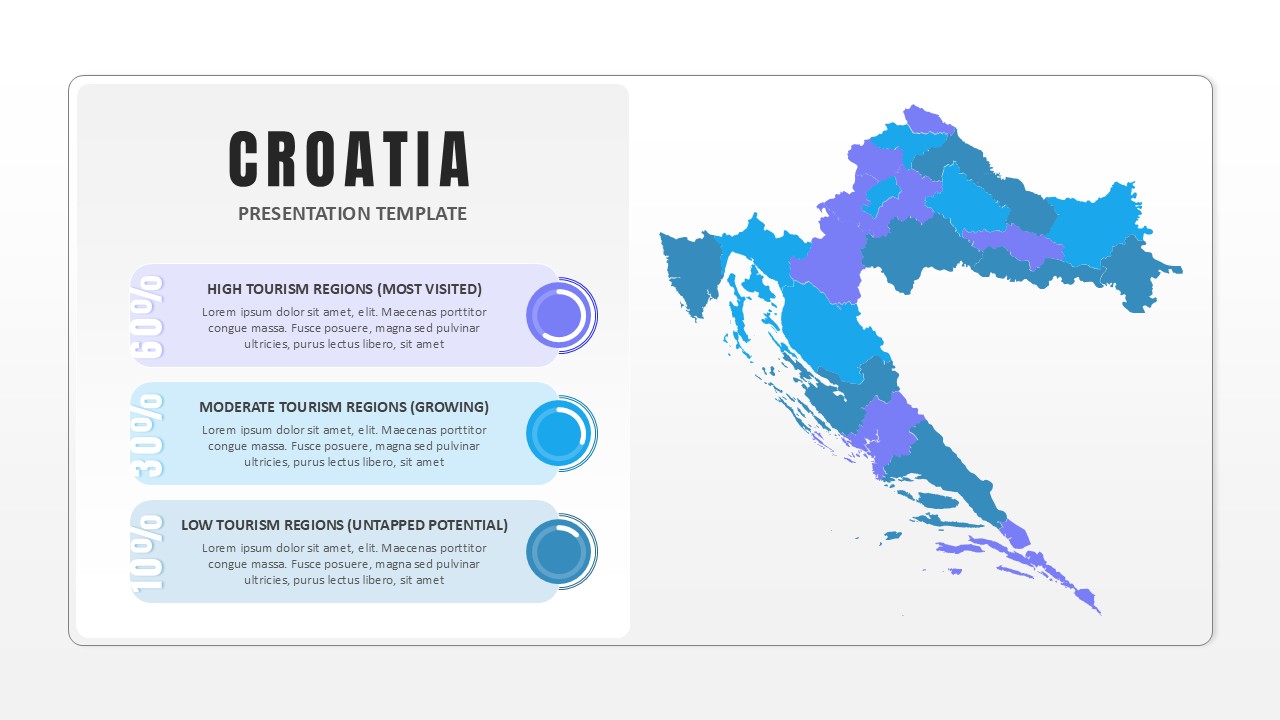
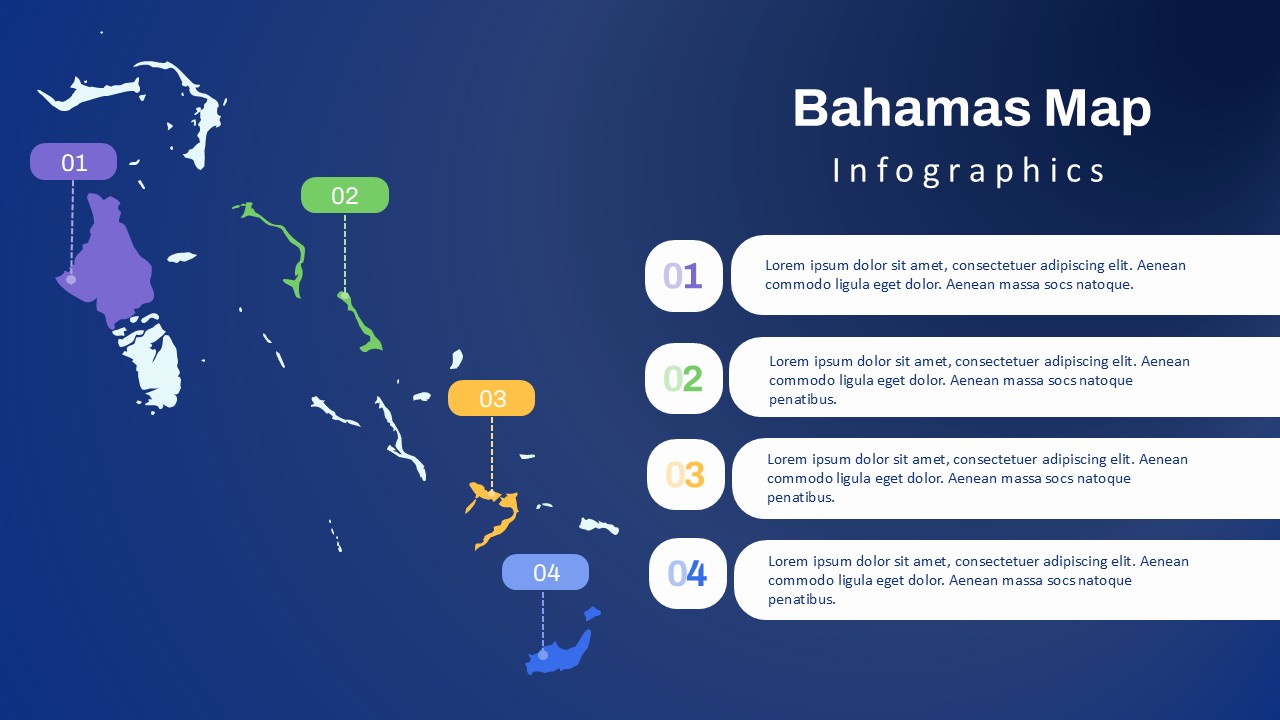
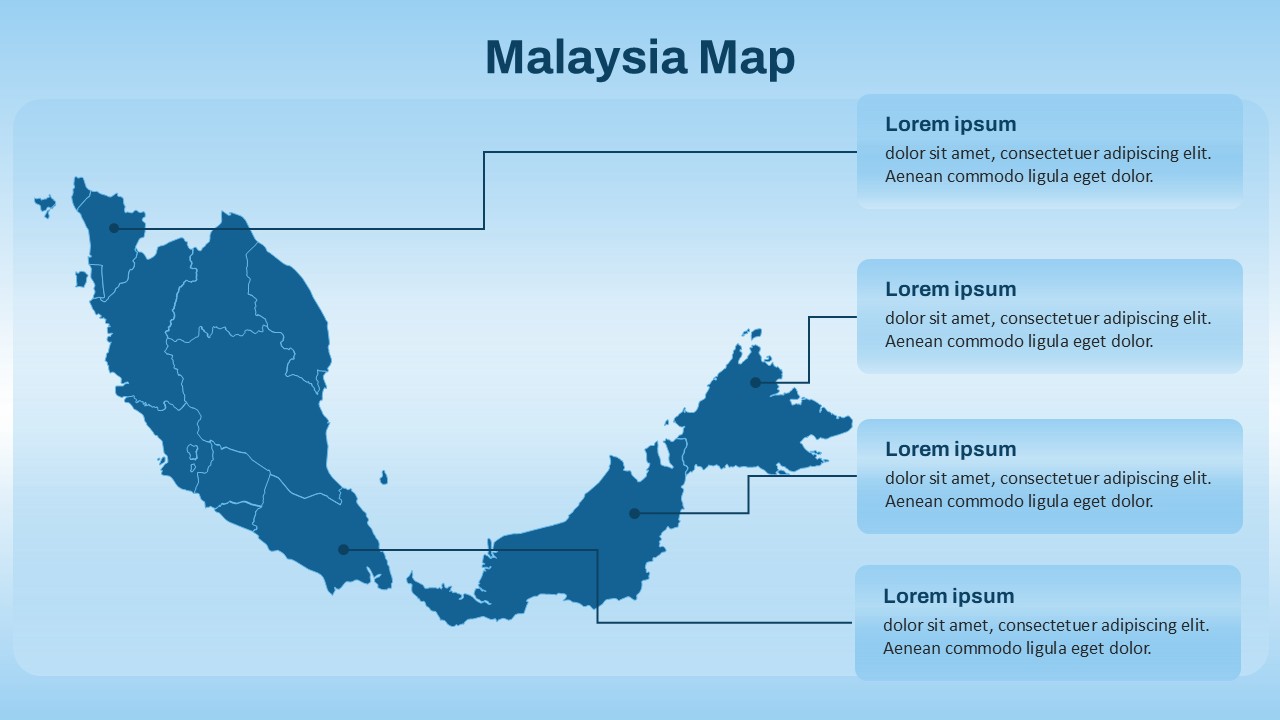
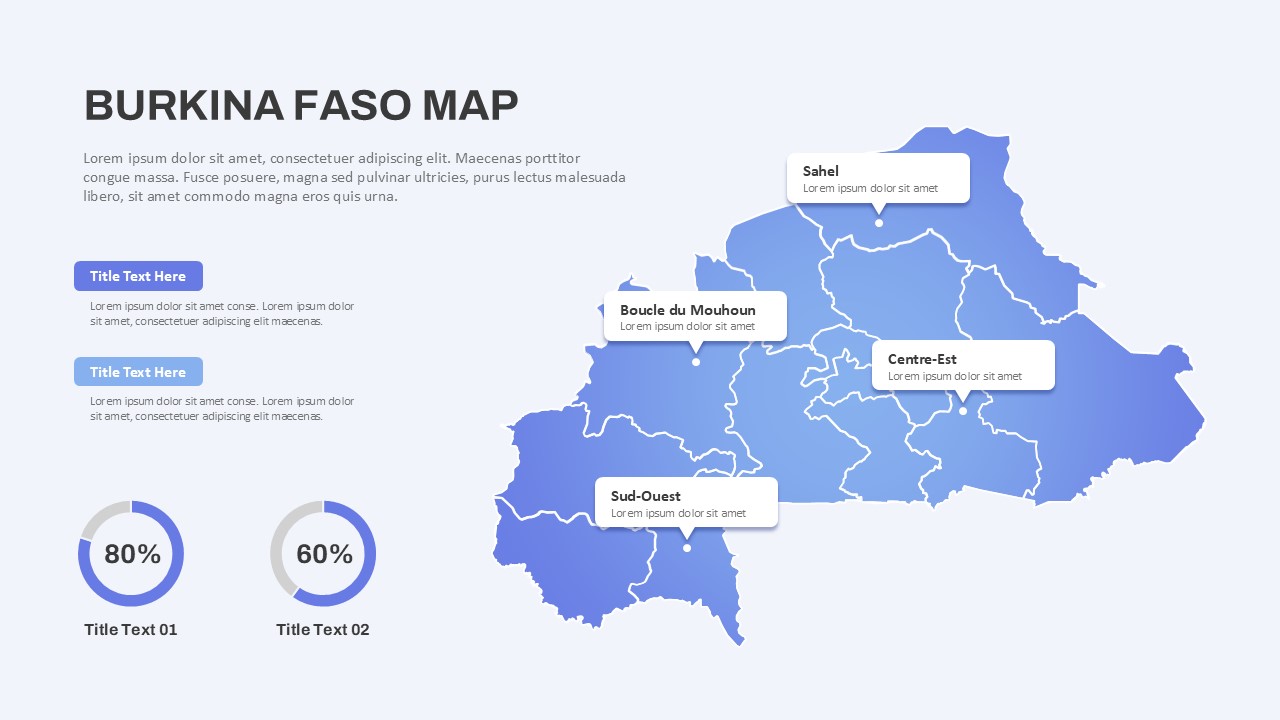
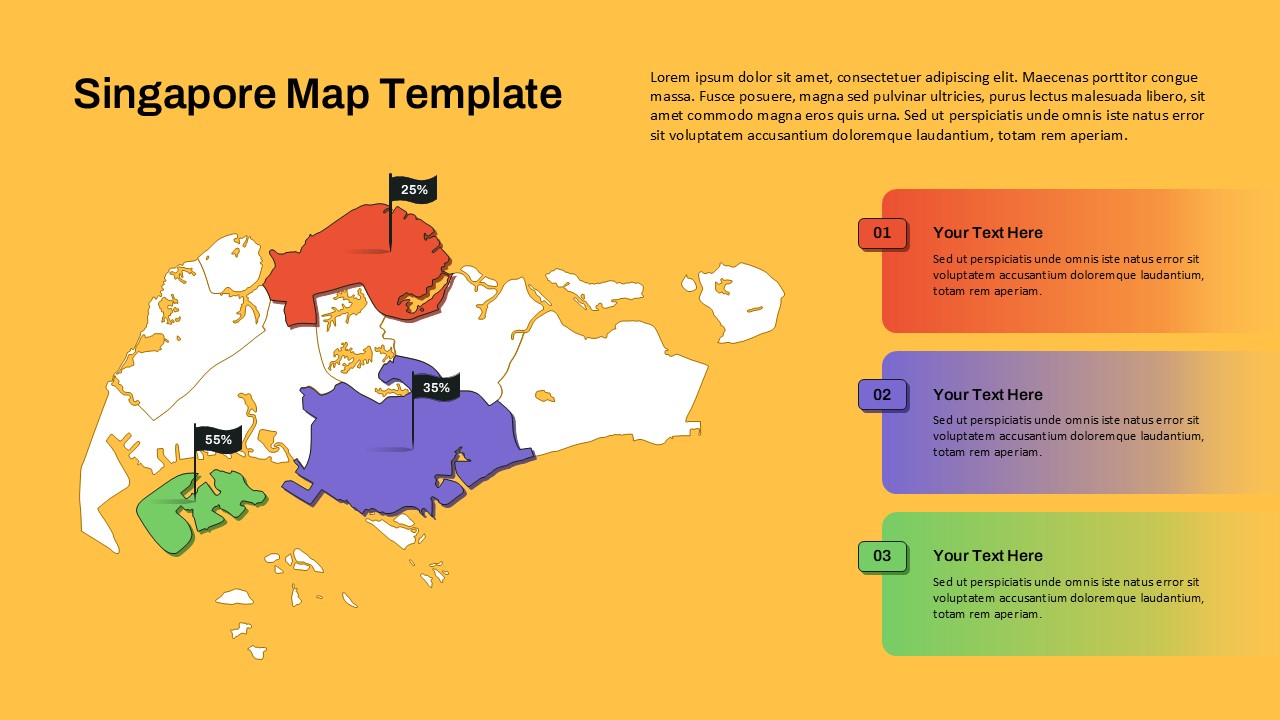
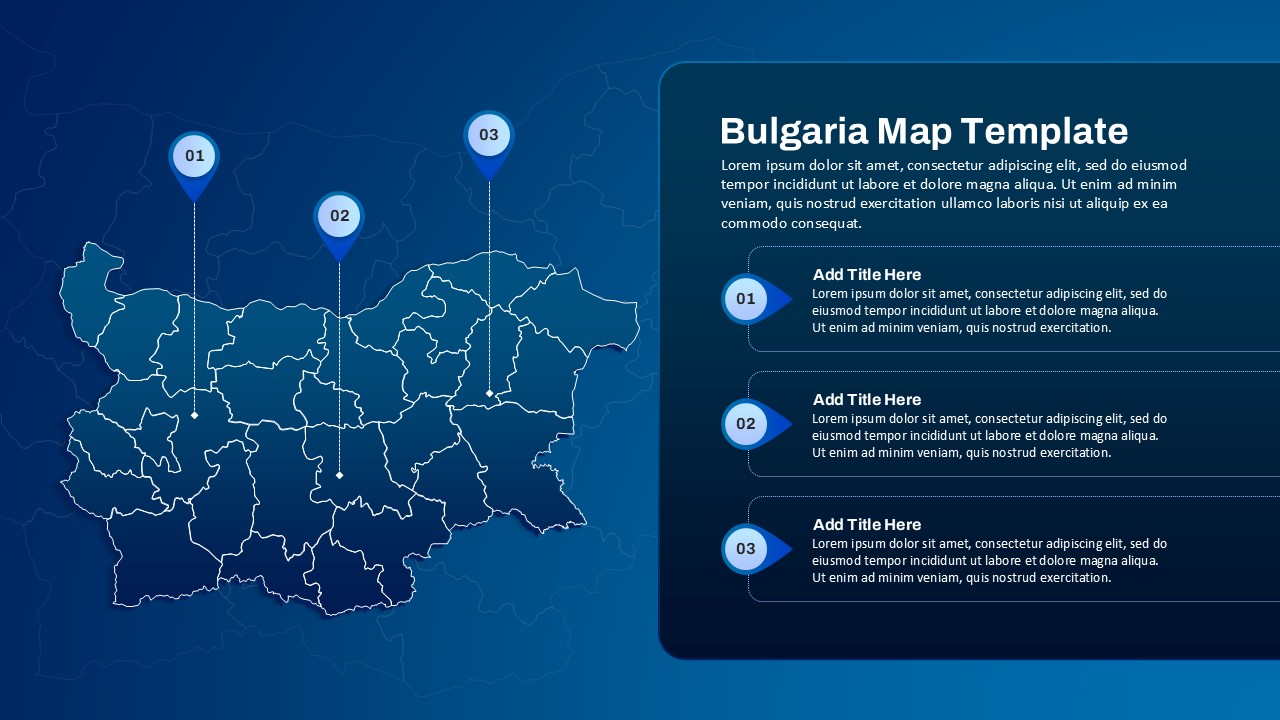
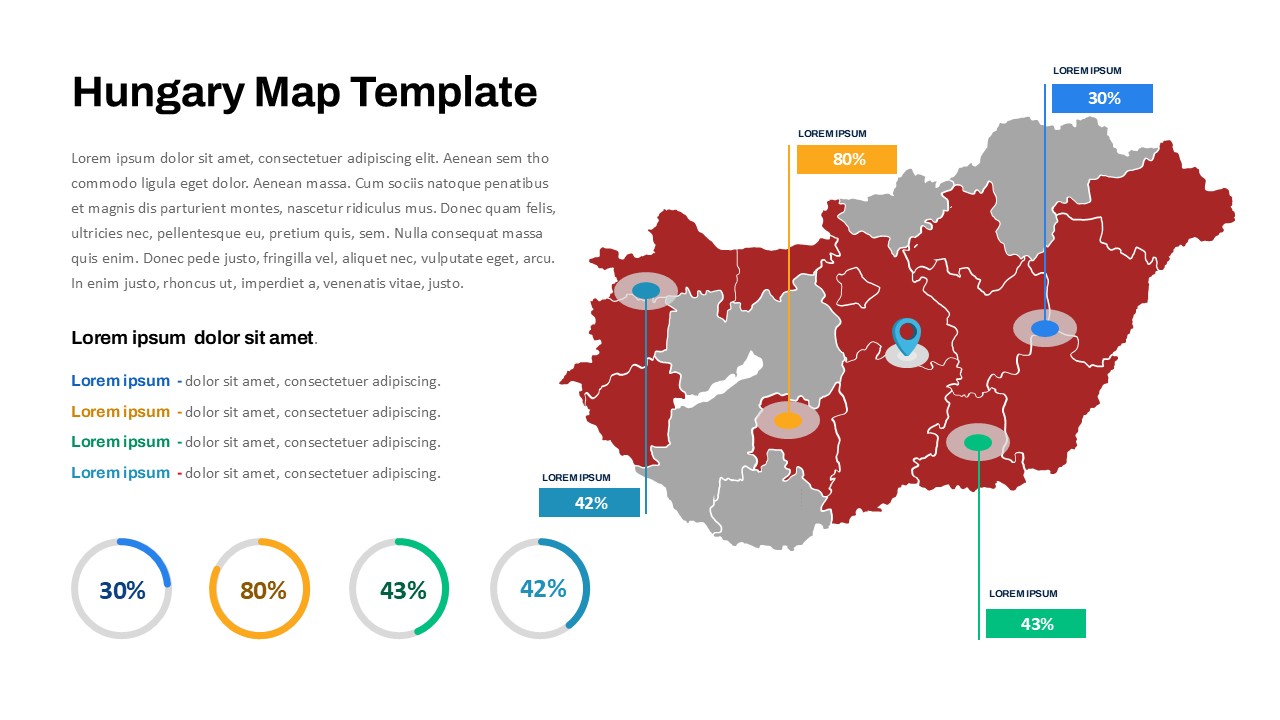
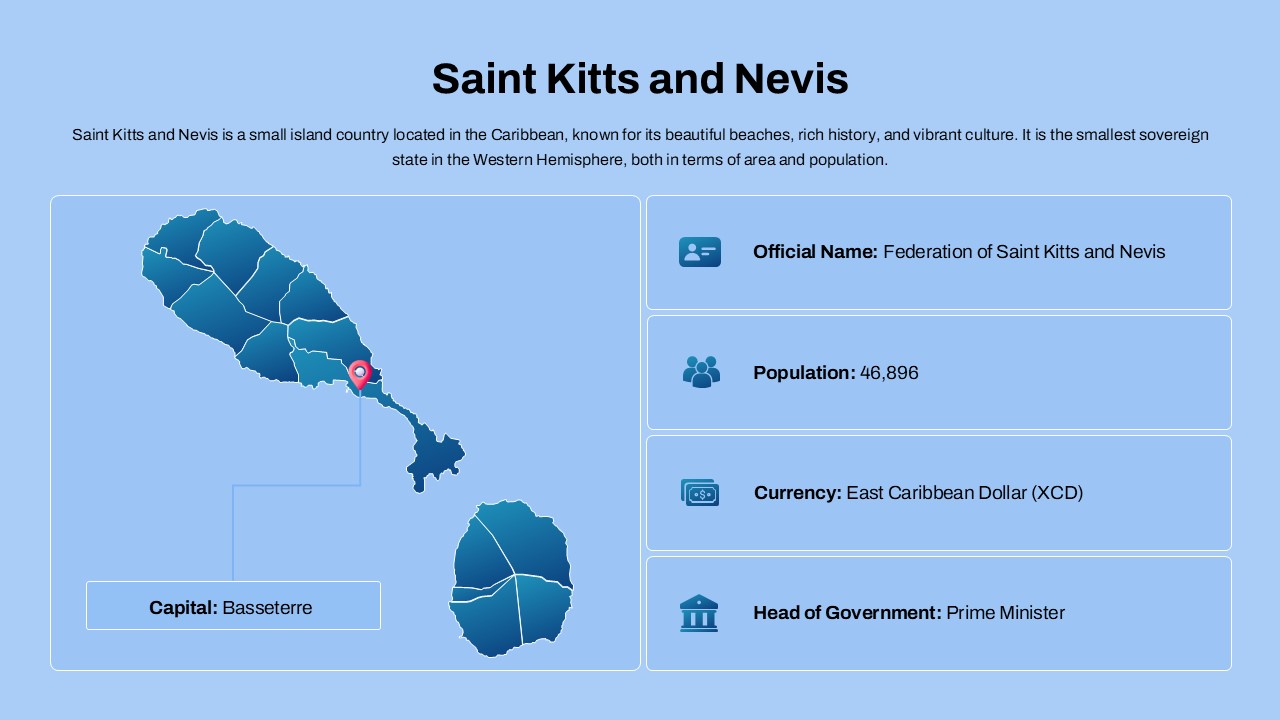
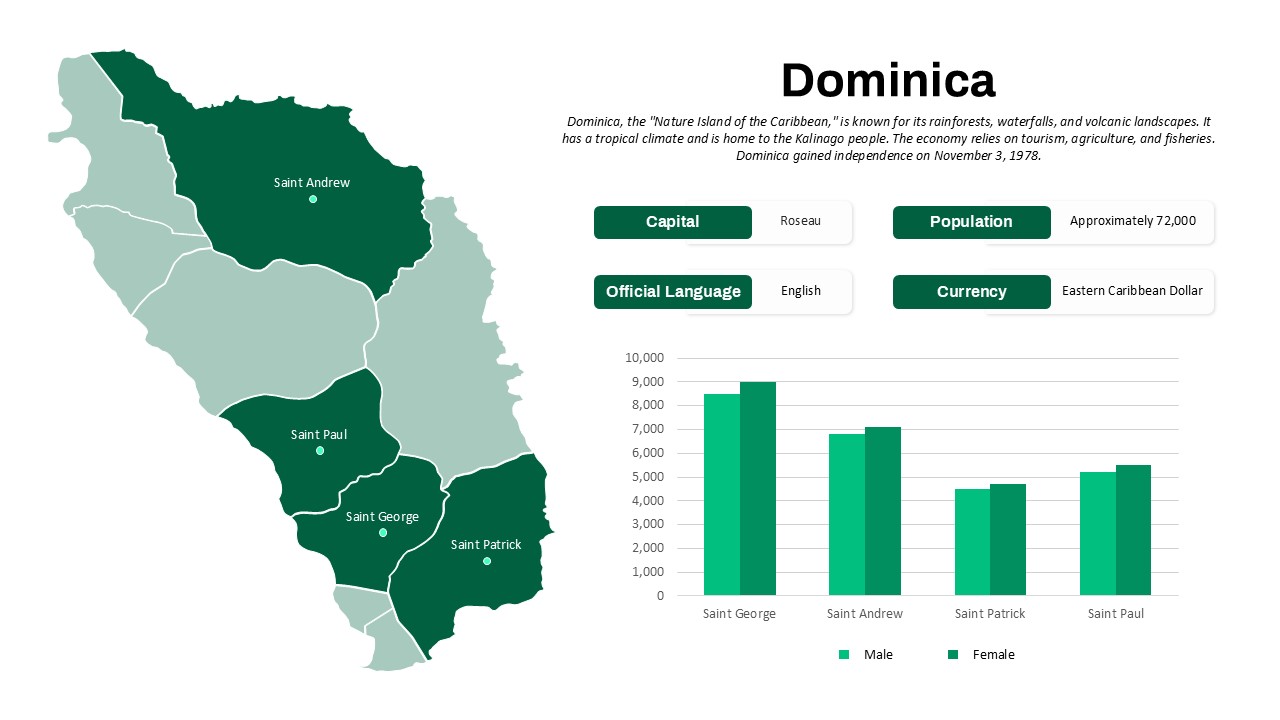
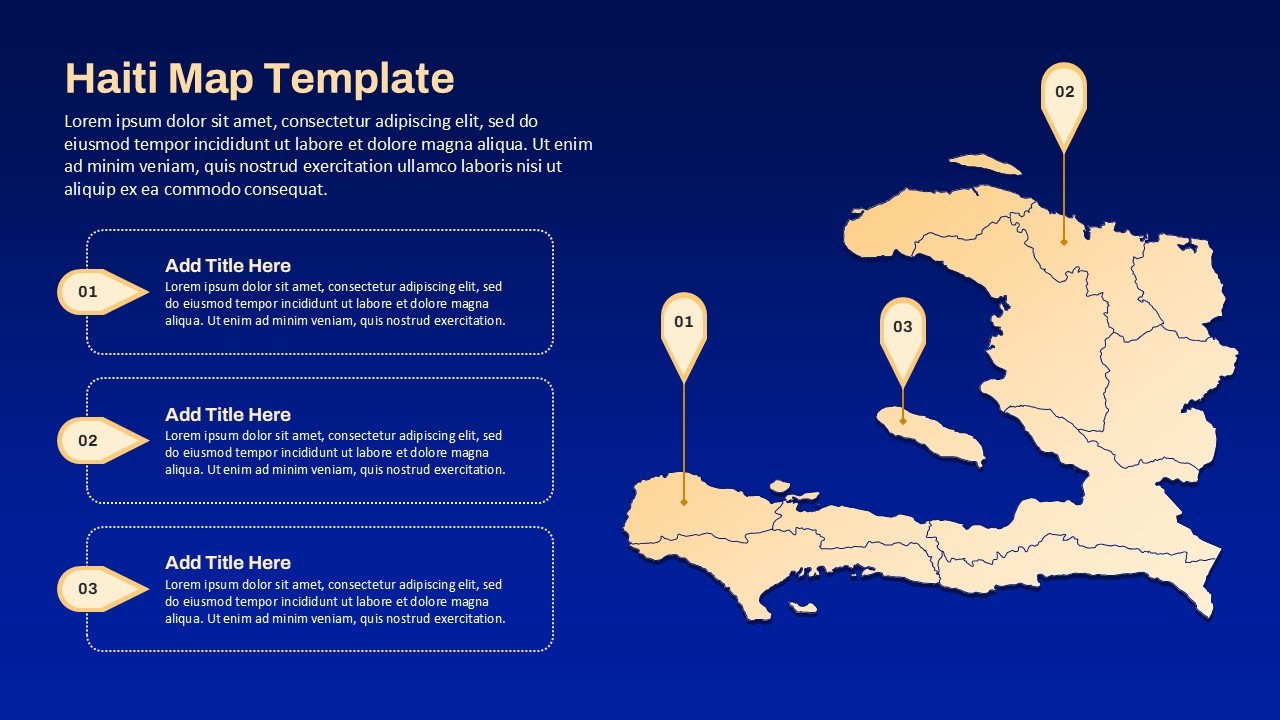
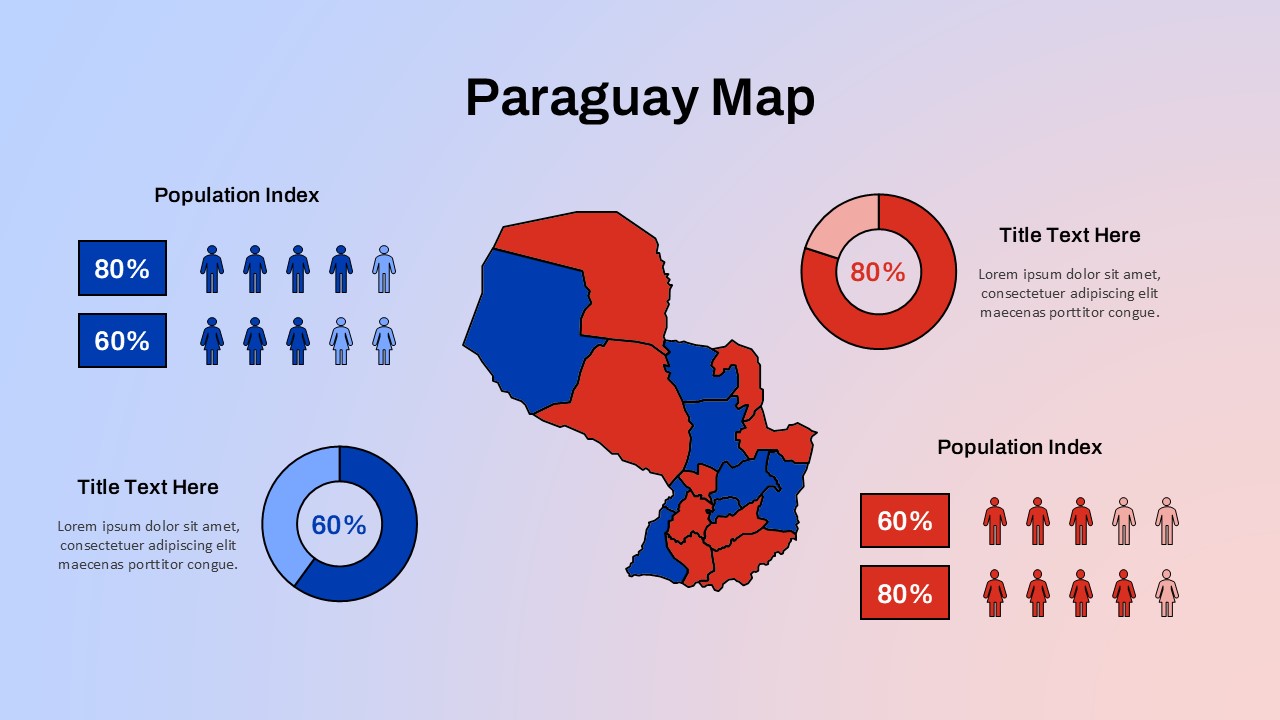
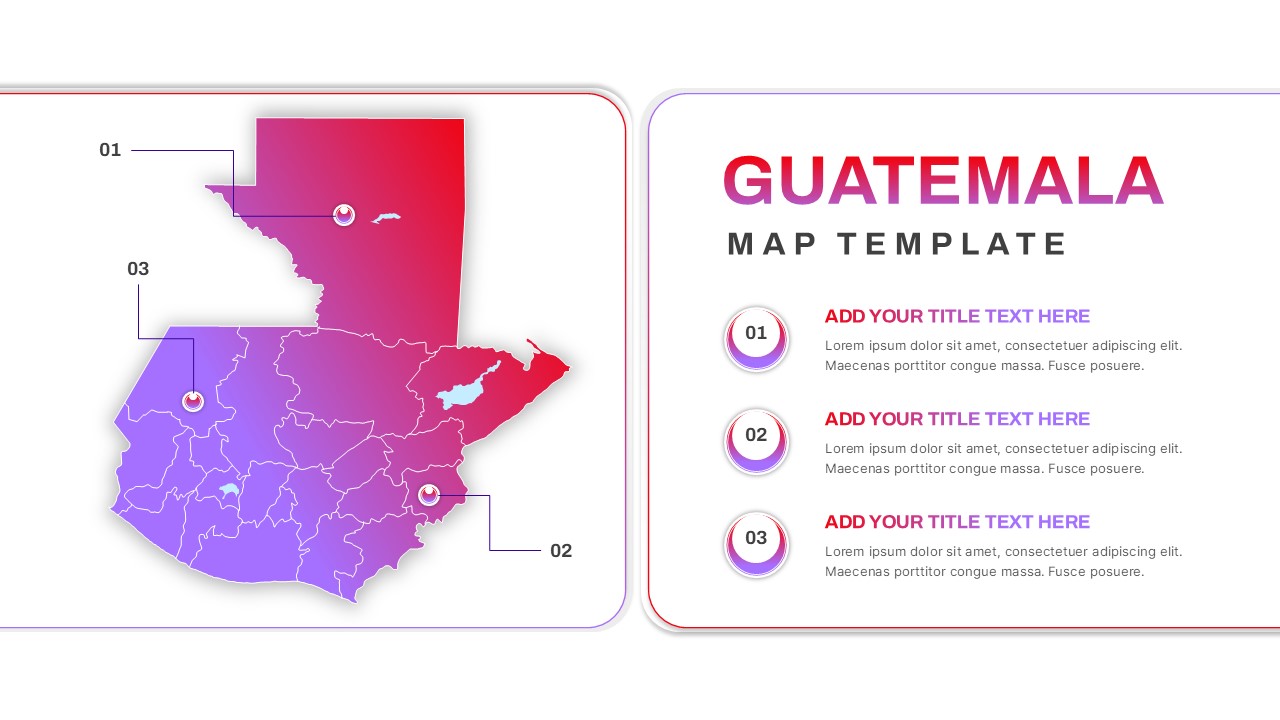
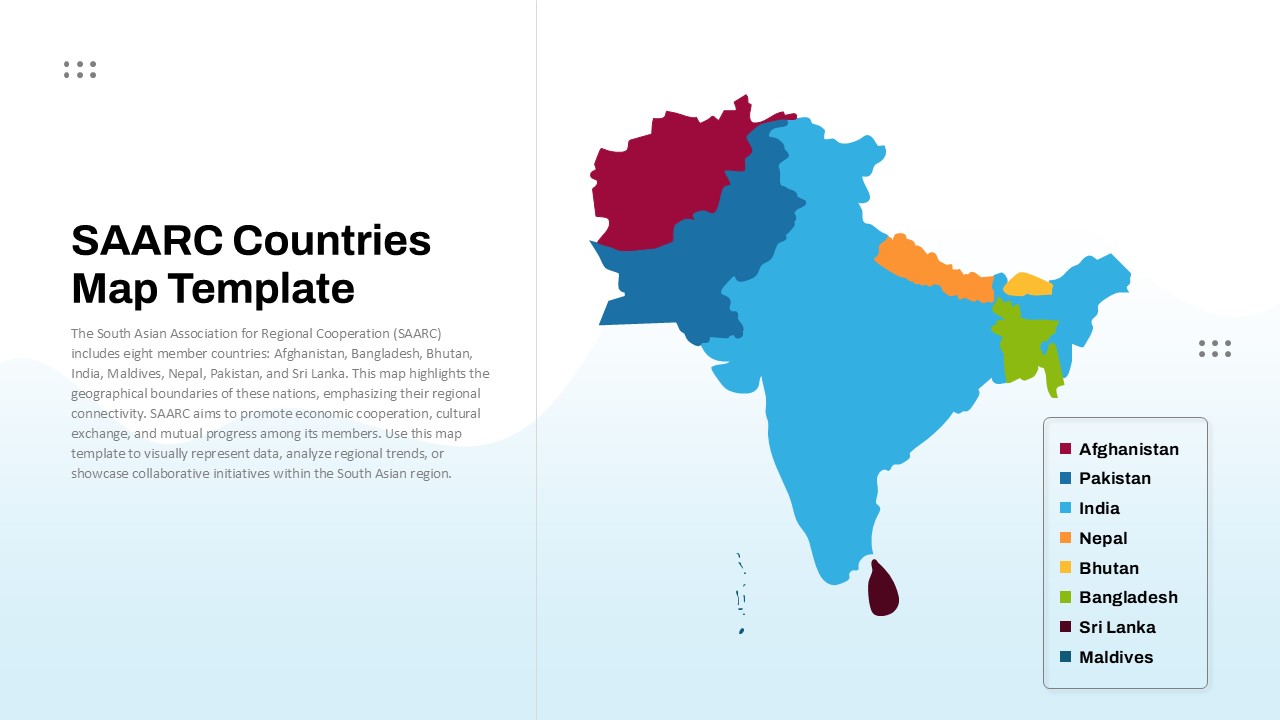
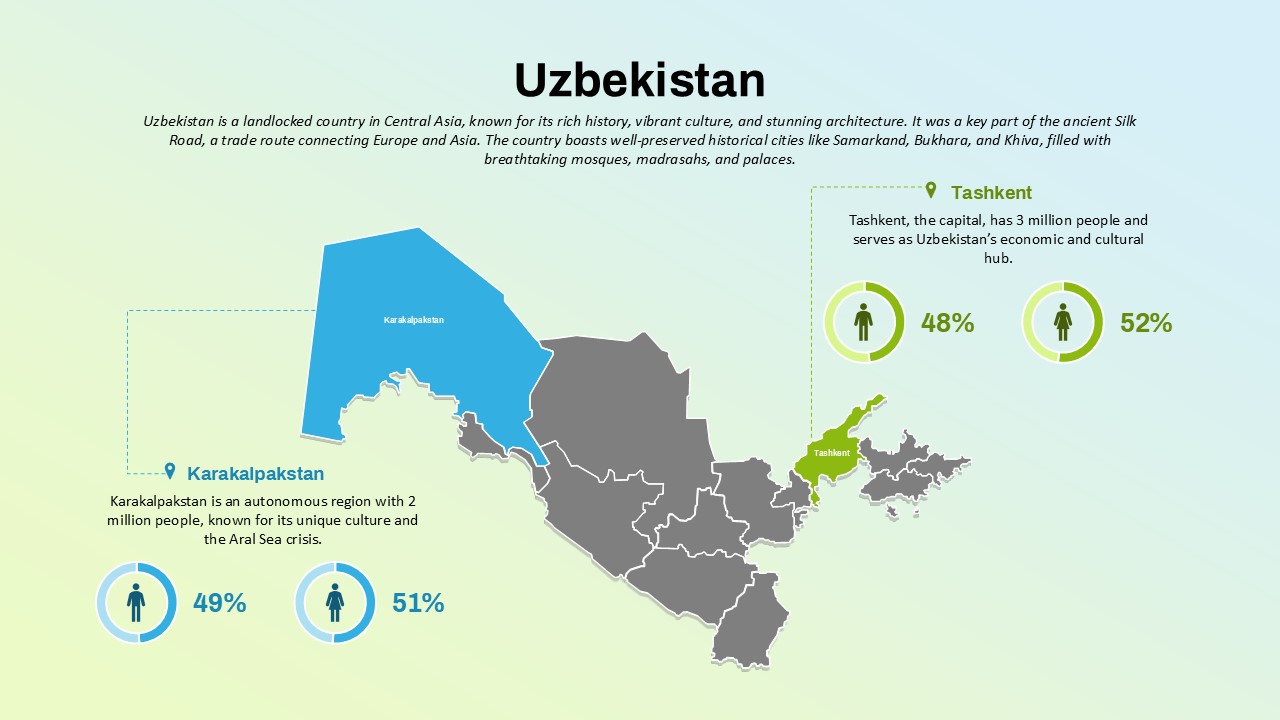
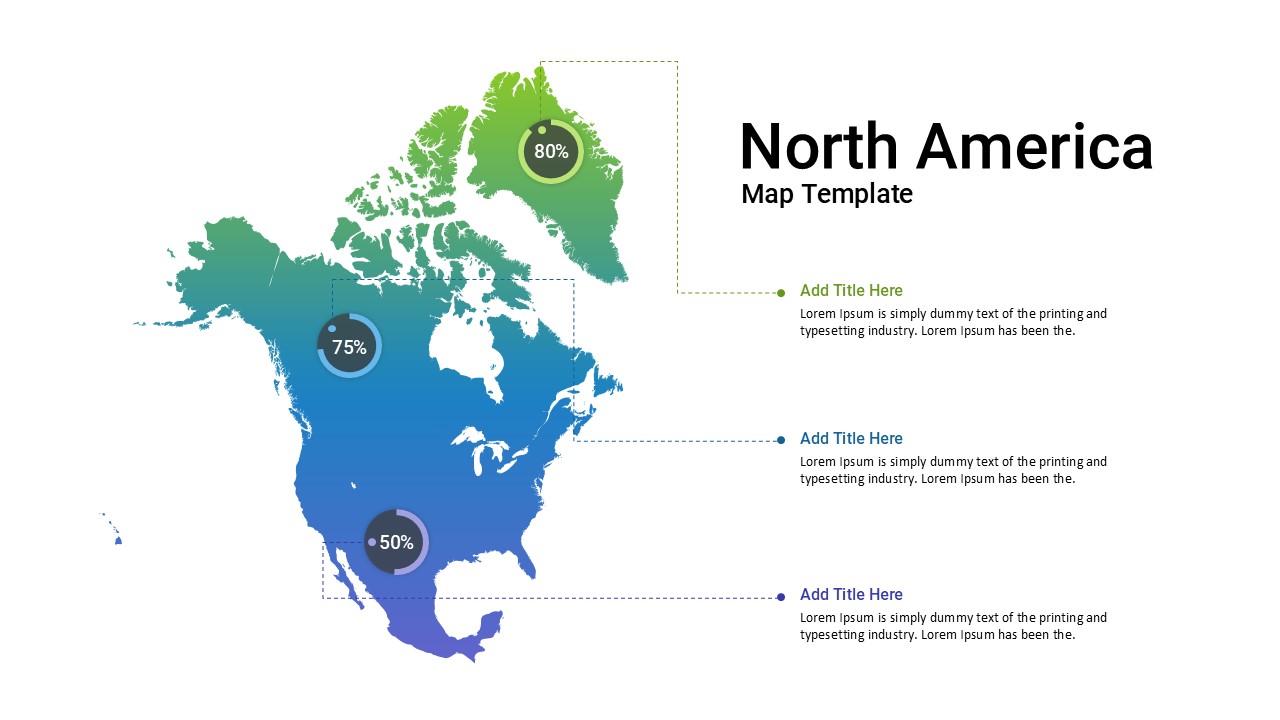
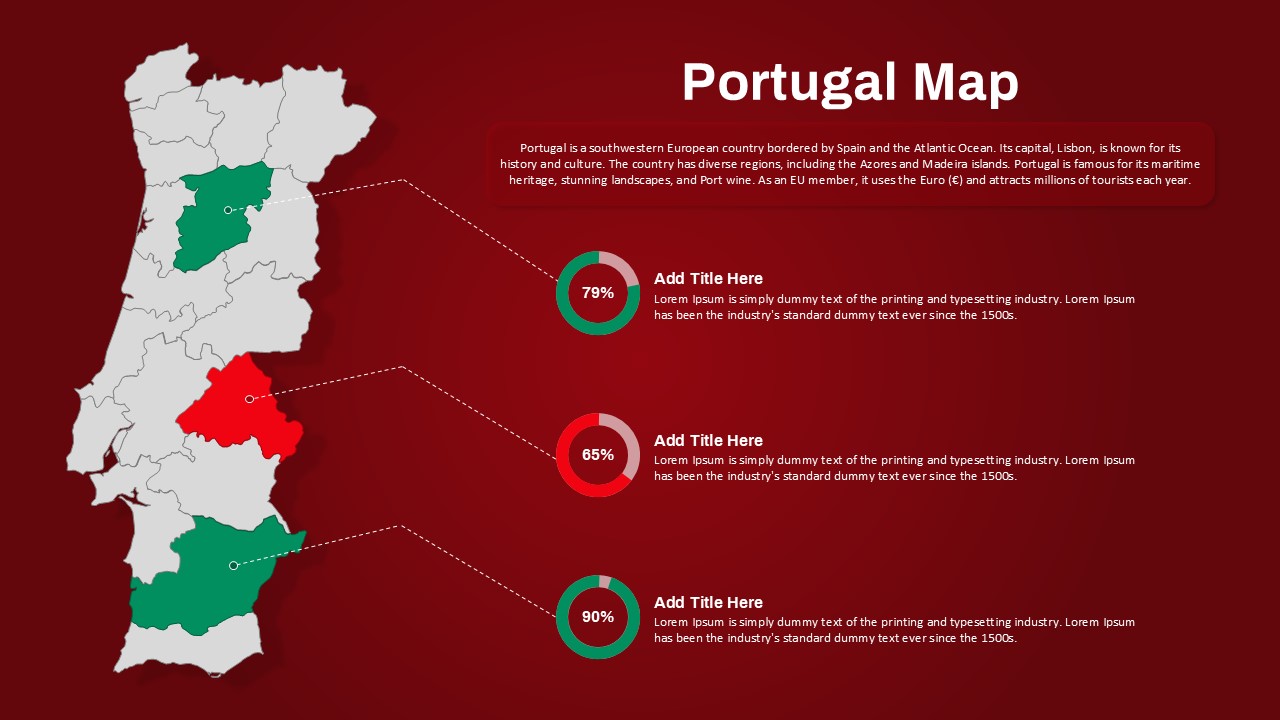
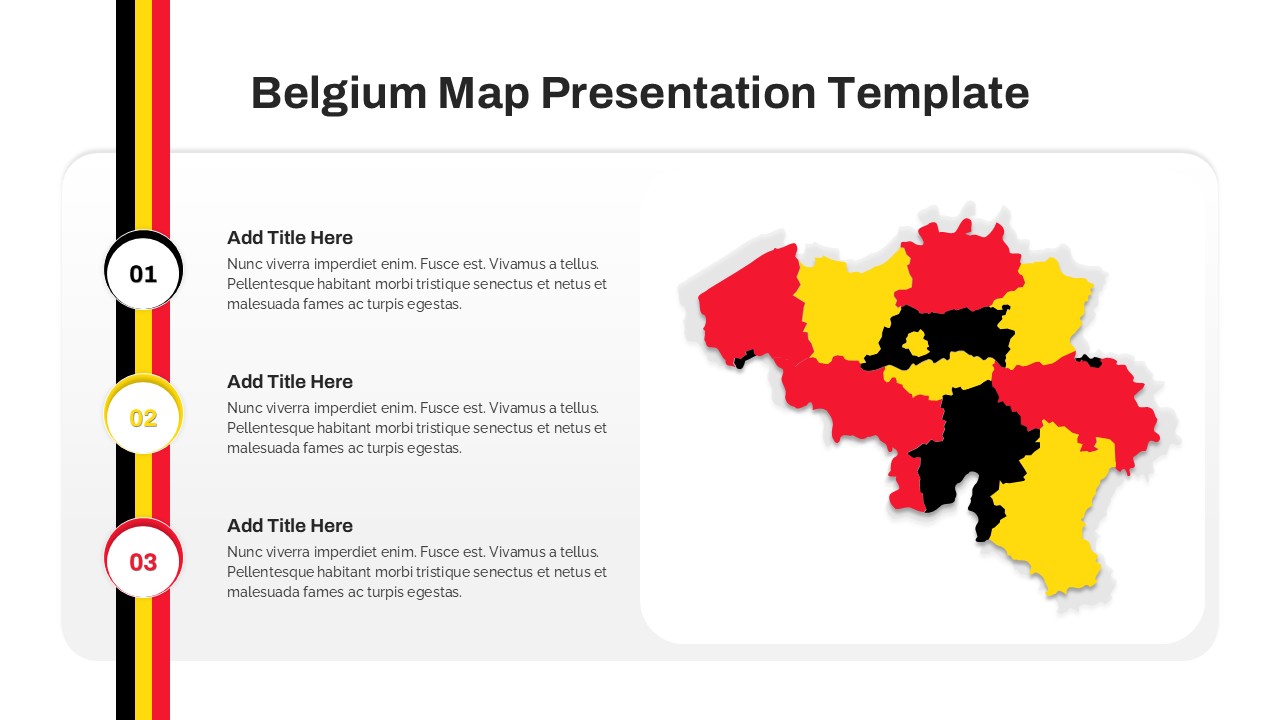
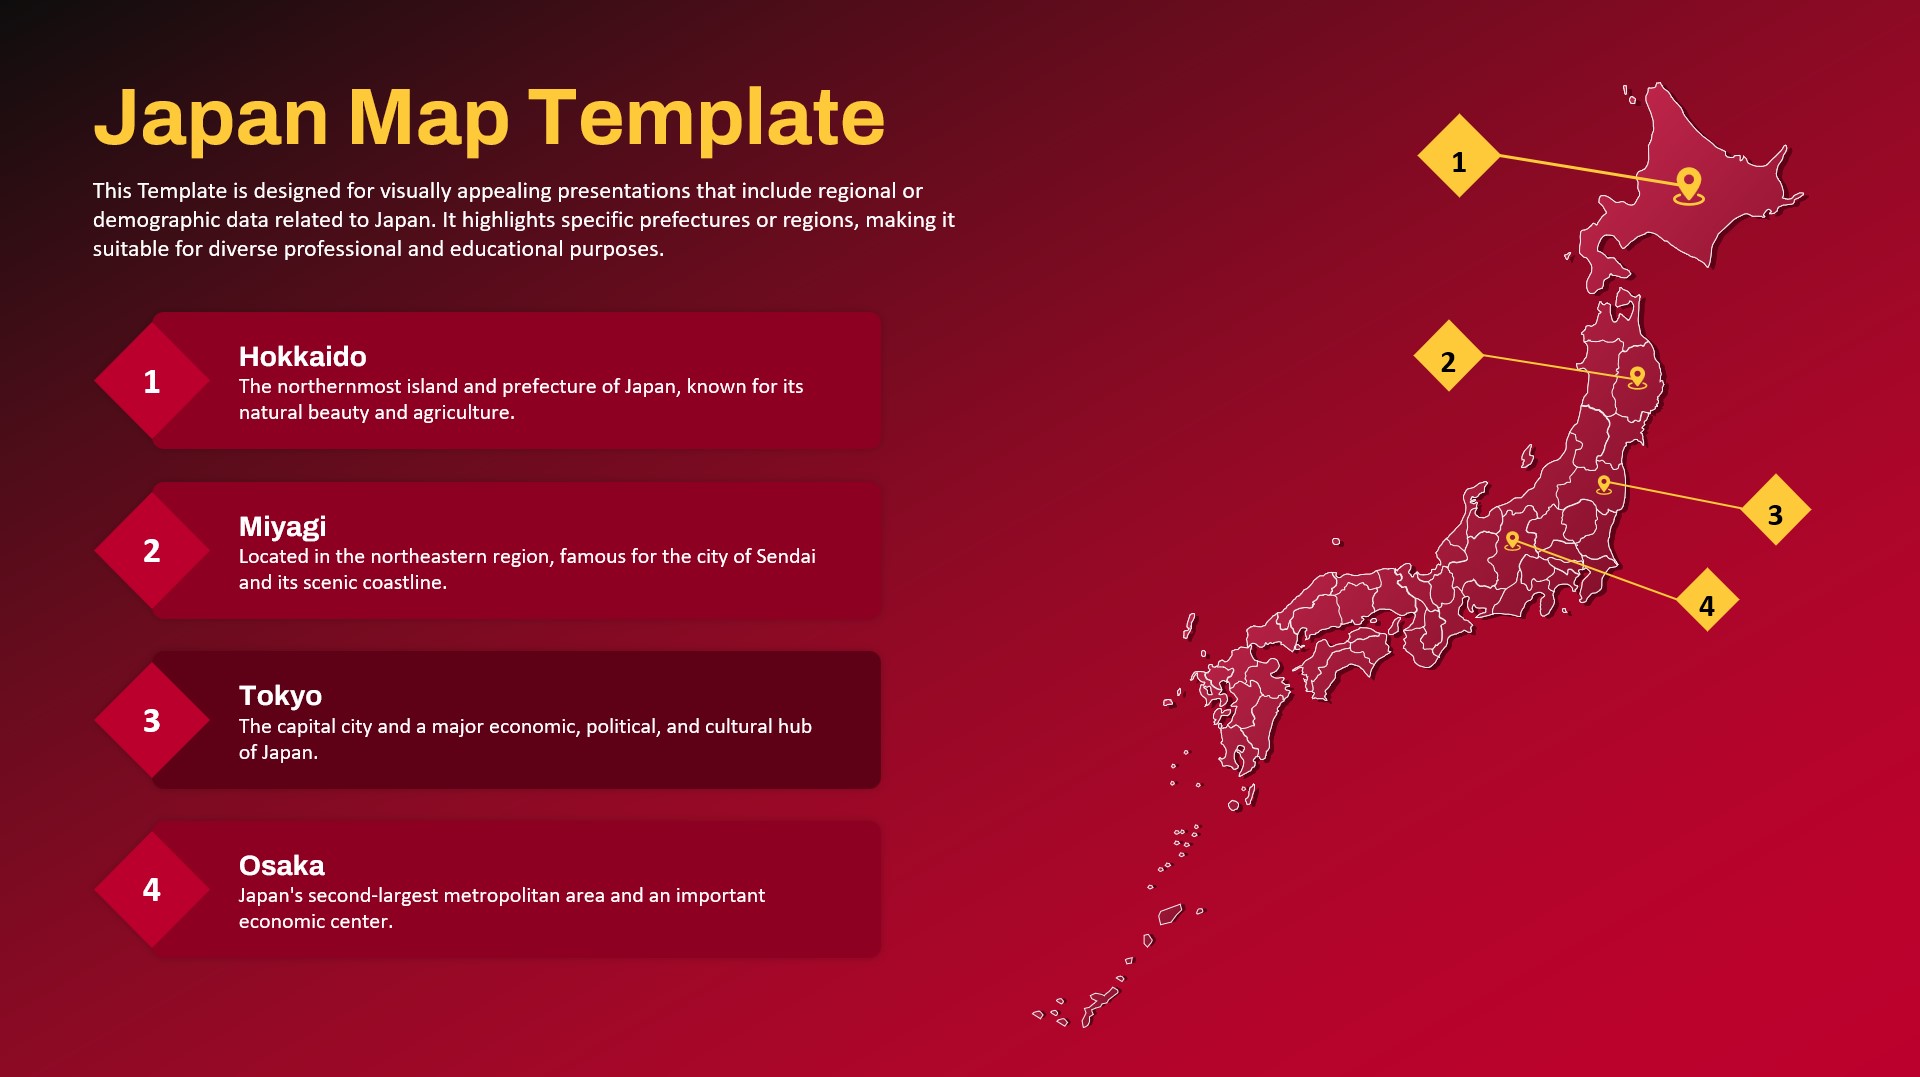
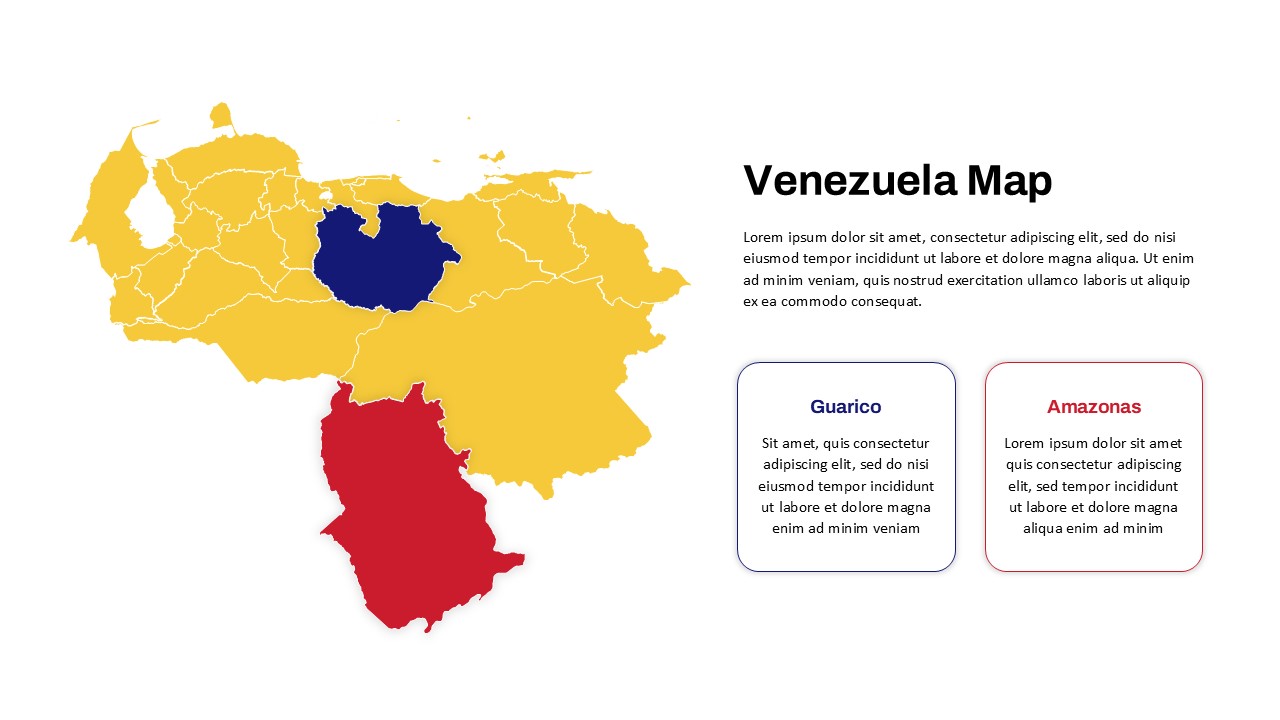
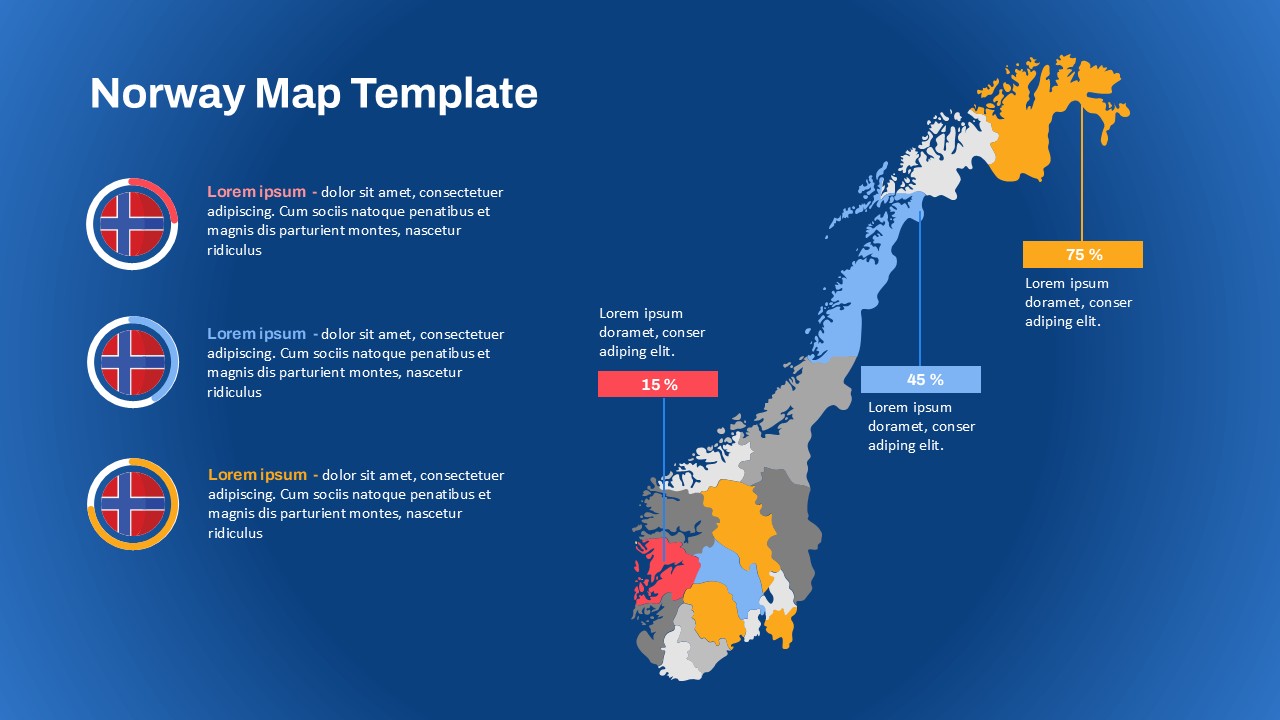
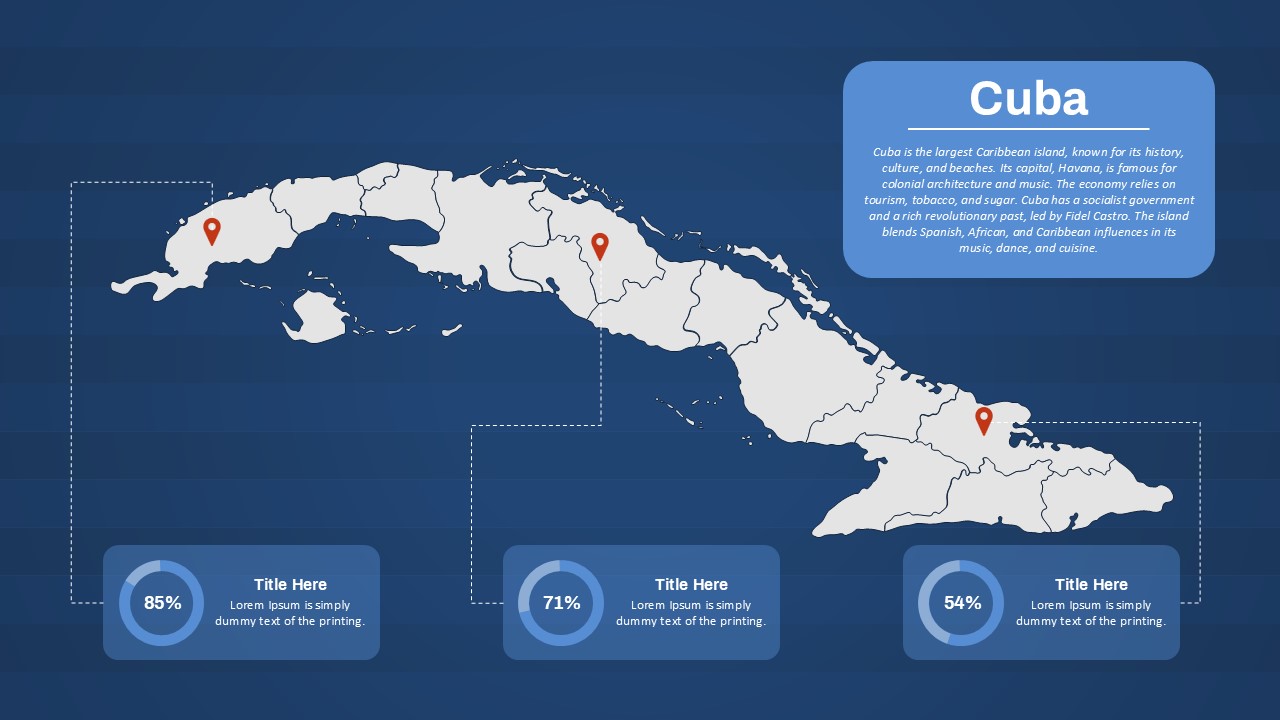
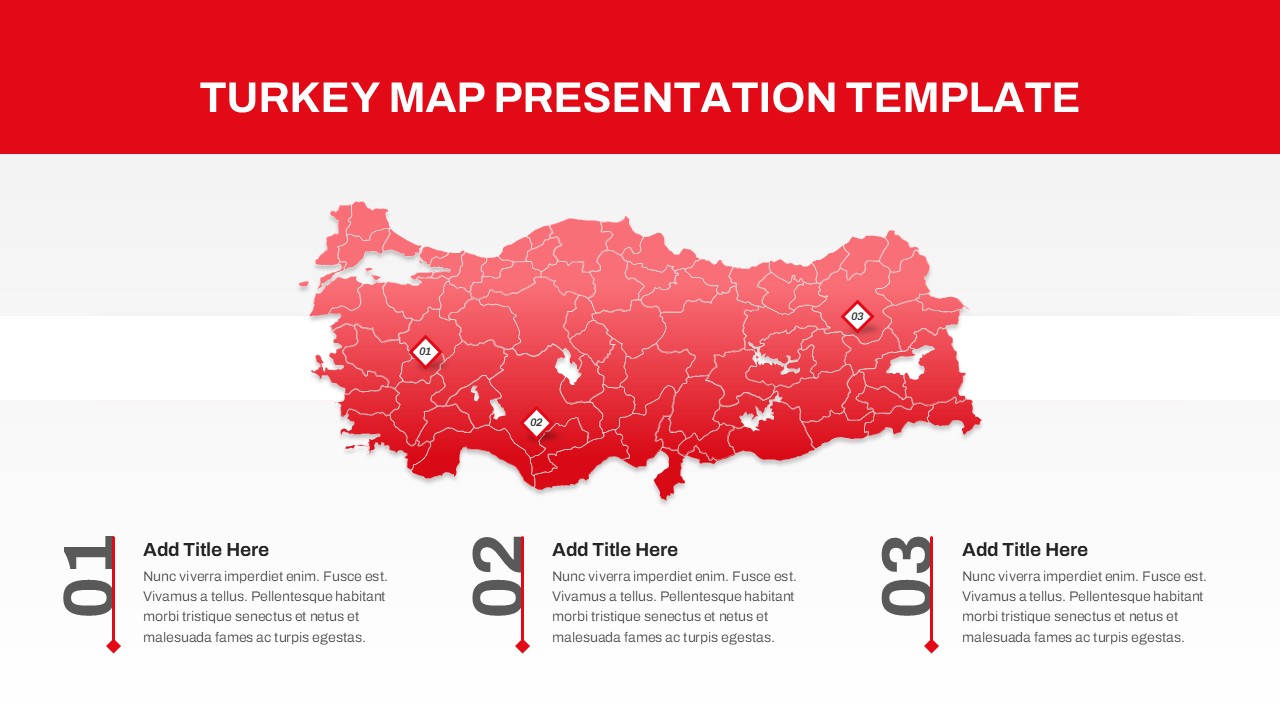
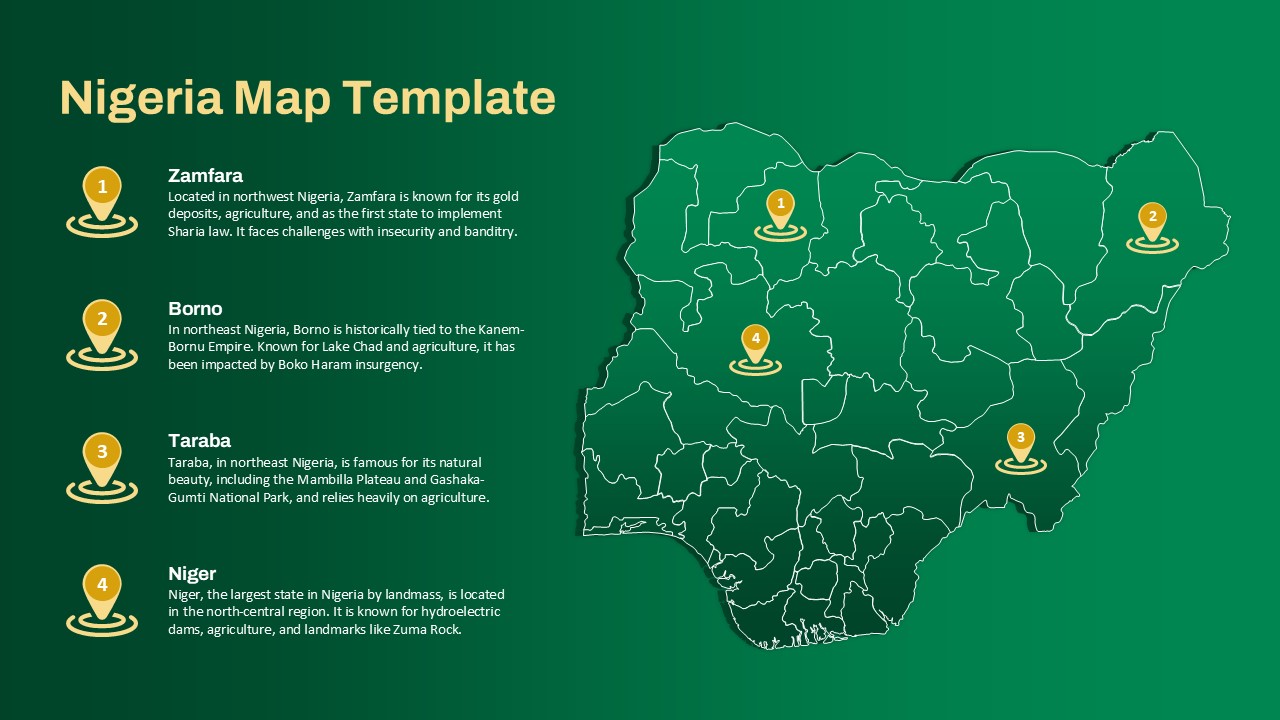
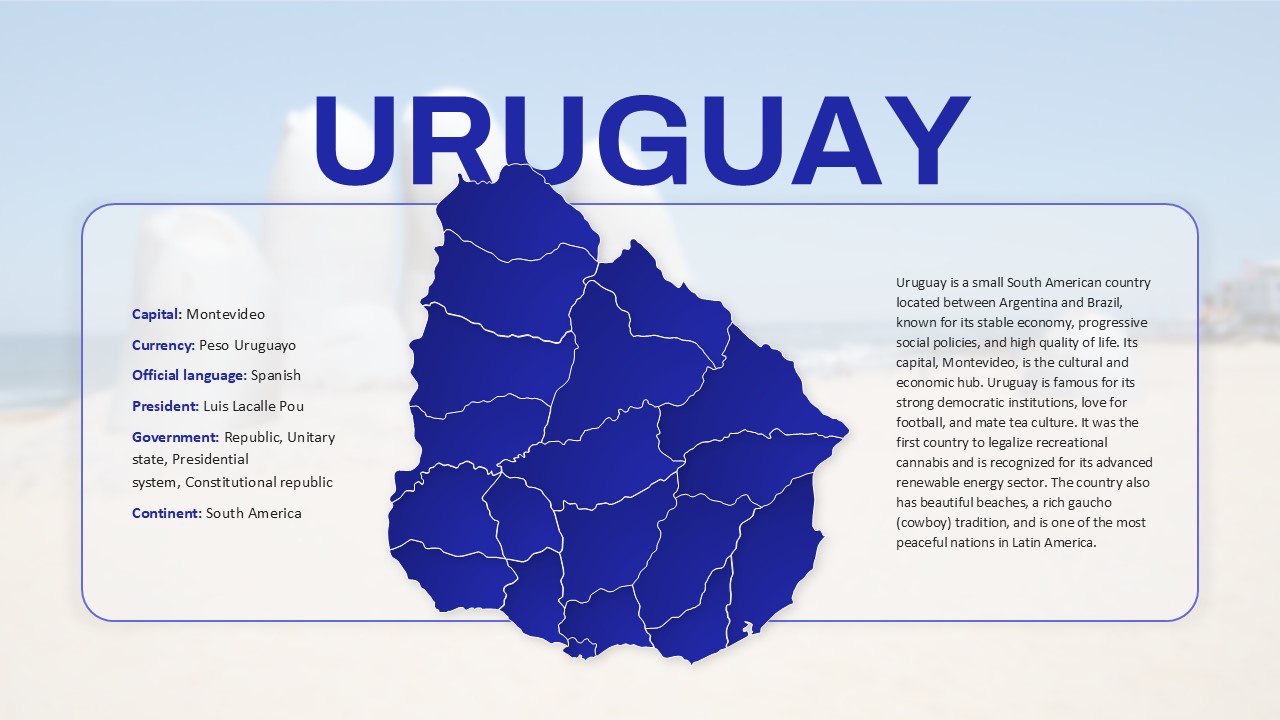
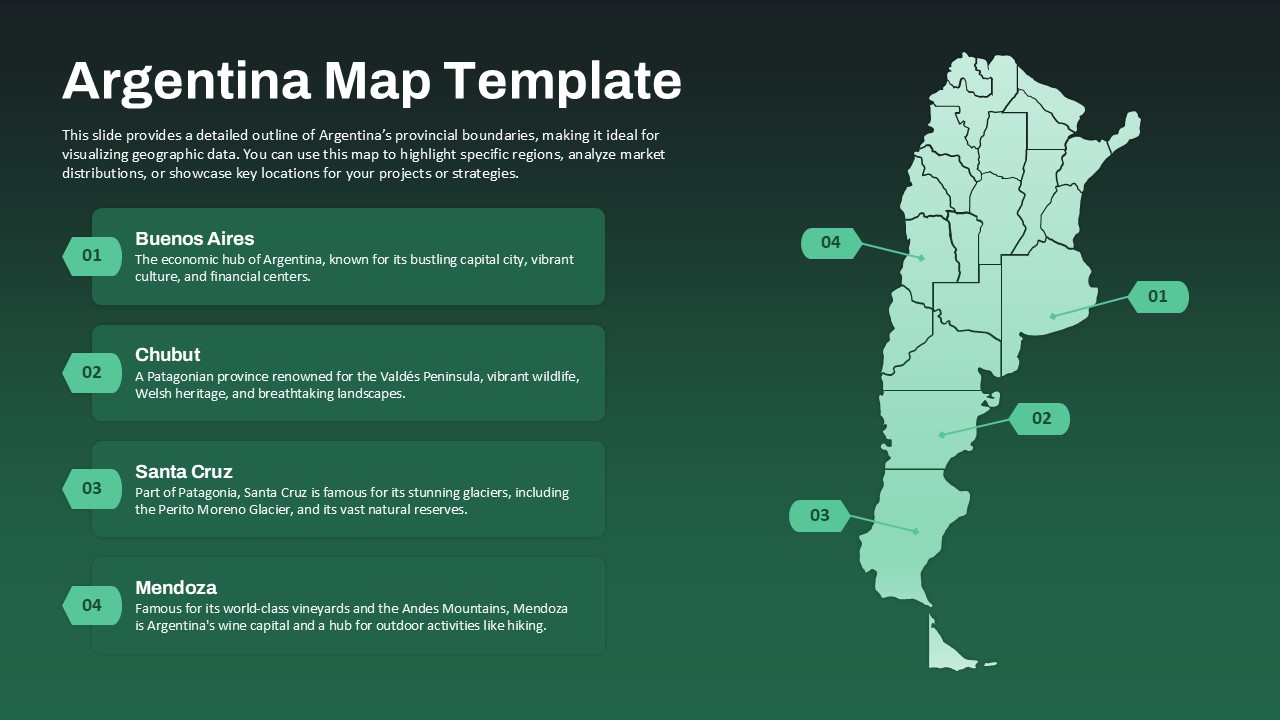
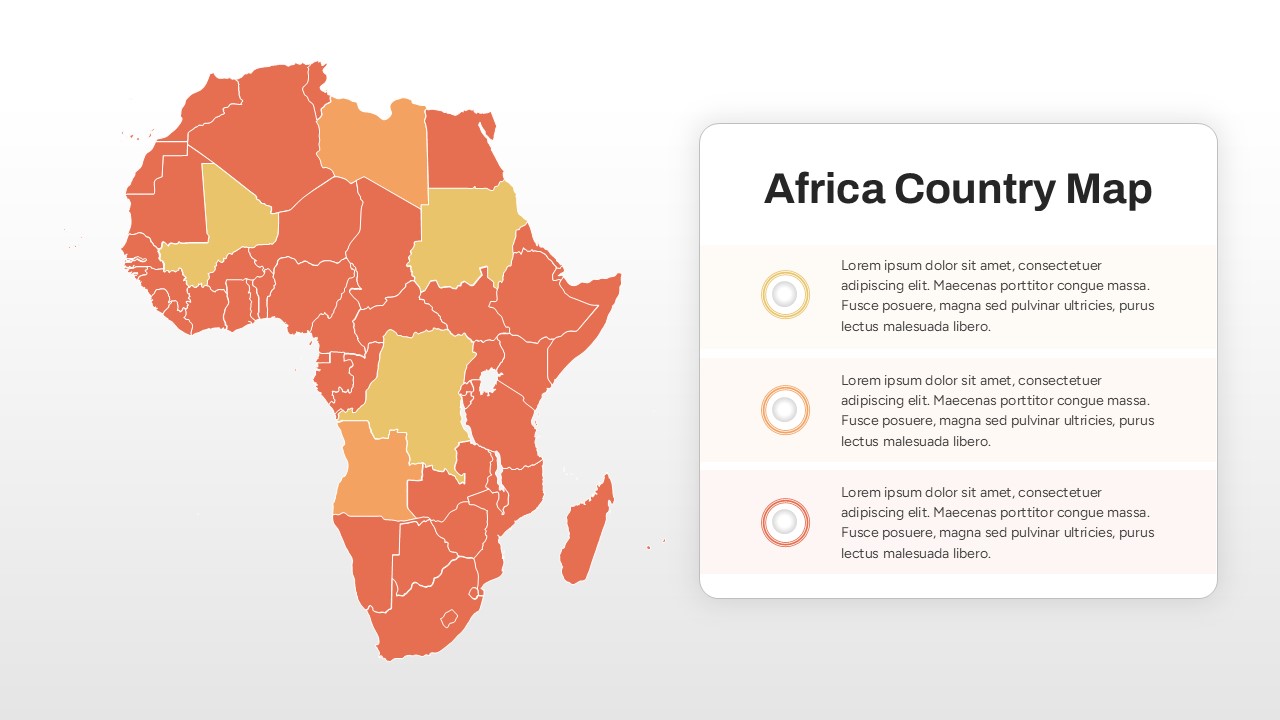
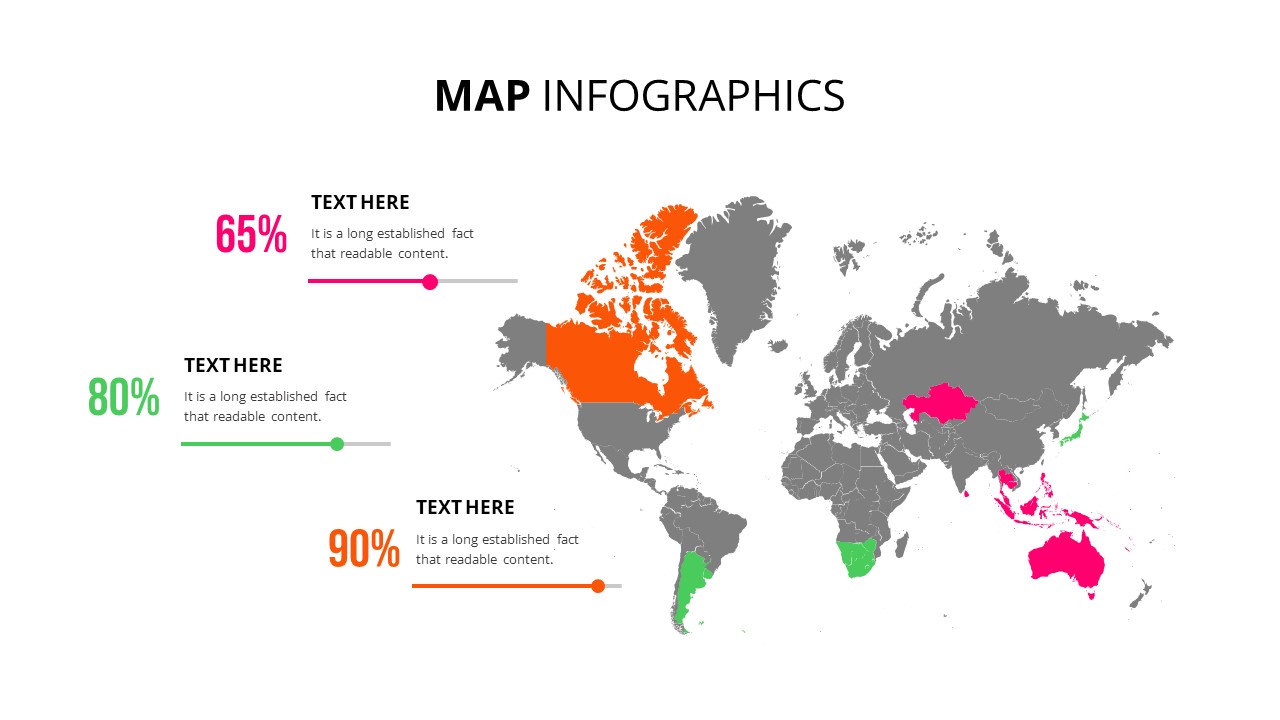
The map is divided into several areas, each color-coded to represent specific data points, making it easy to differentiate and compare values. For example, percentage figures, such as 20.5%, 30.5%, and 40%, can be displayed on different regions of the map, accompanied by relevant textual descriptions for each area. This format ensures that the data is not only accessible but also visually attractive, making it ideal for presentations and reports.
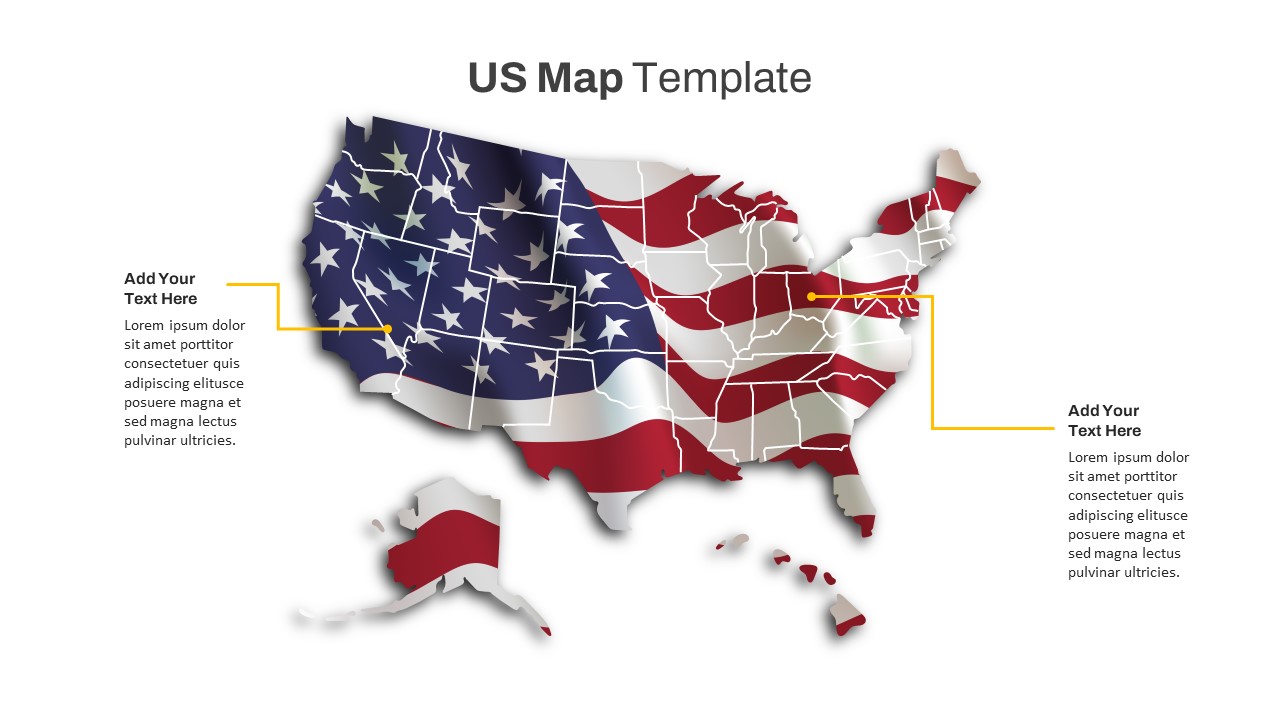
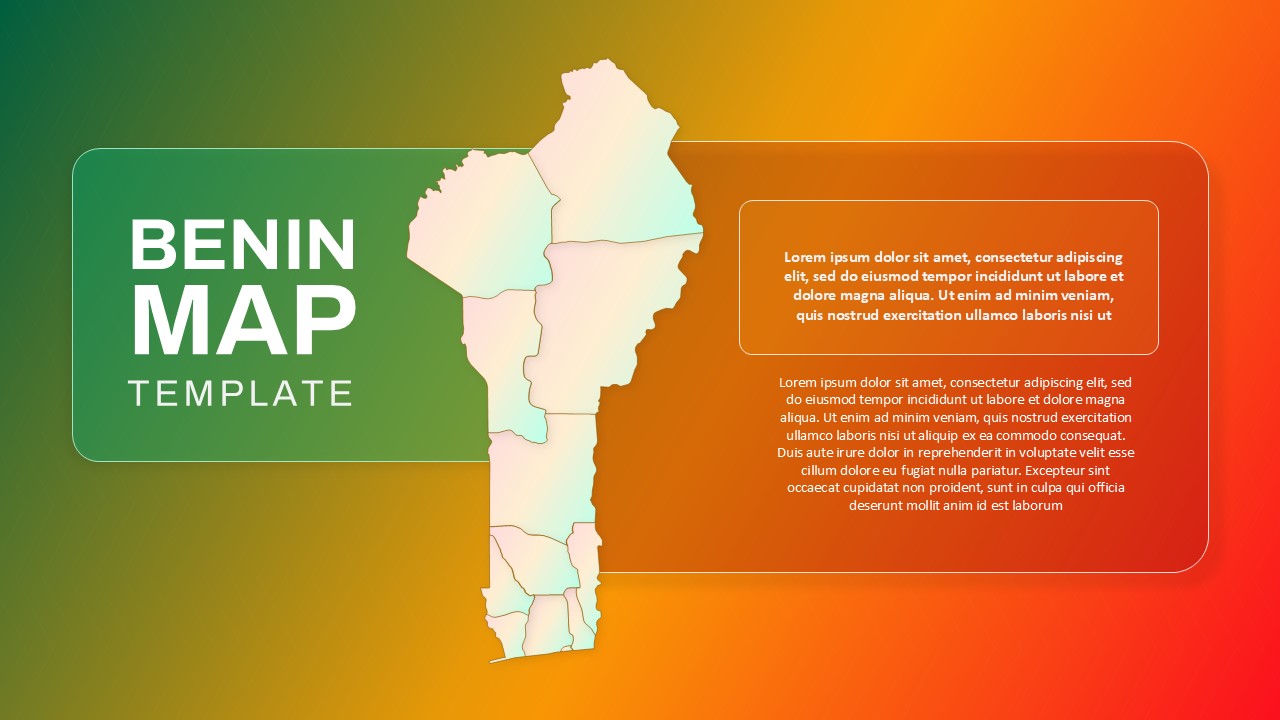
The accompanying placeholders for text offer the flexibility to explain the data, provide context, or present additional insights in a structured manner. Whether for business, academic, or governmental purposes, this template is an excellent resource for communicating complex geographical data in an intuitive and easy-to-understand format.
It is fully editable in both PowerPoint and Google Slides, ensuring compatibility and ease of use across platforms.
See more

Aspect Ratio
16:9Item ID
SKT03481
Features of this template
Other User Cases of the Template
Market Research, Demographic Analysis, Regional Sales Reports, Geographical Data Presentation, Business Presentations, Political Data, Economic Surveys, Academic Research, Governmental Reports.
FAQs
You May Also Like These Presentation Templates


- Free
- Free


- Free
- Free
- Free
- Free
- Free