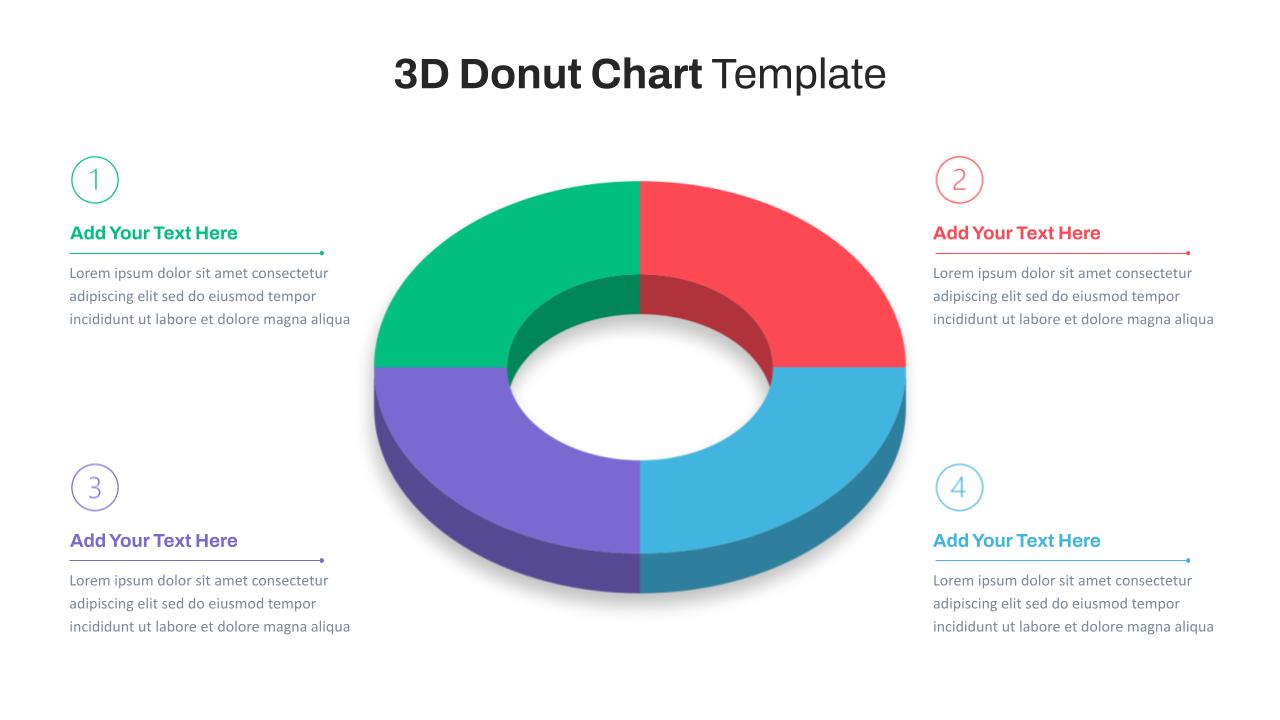
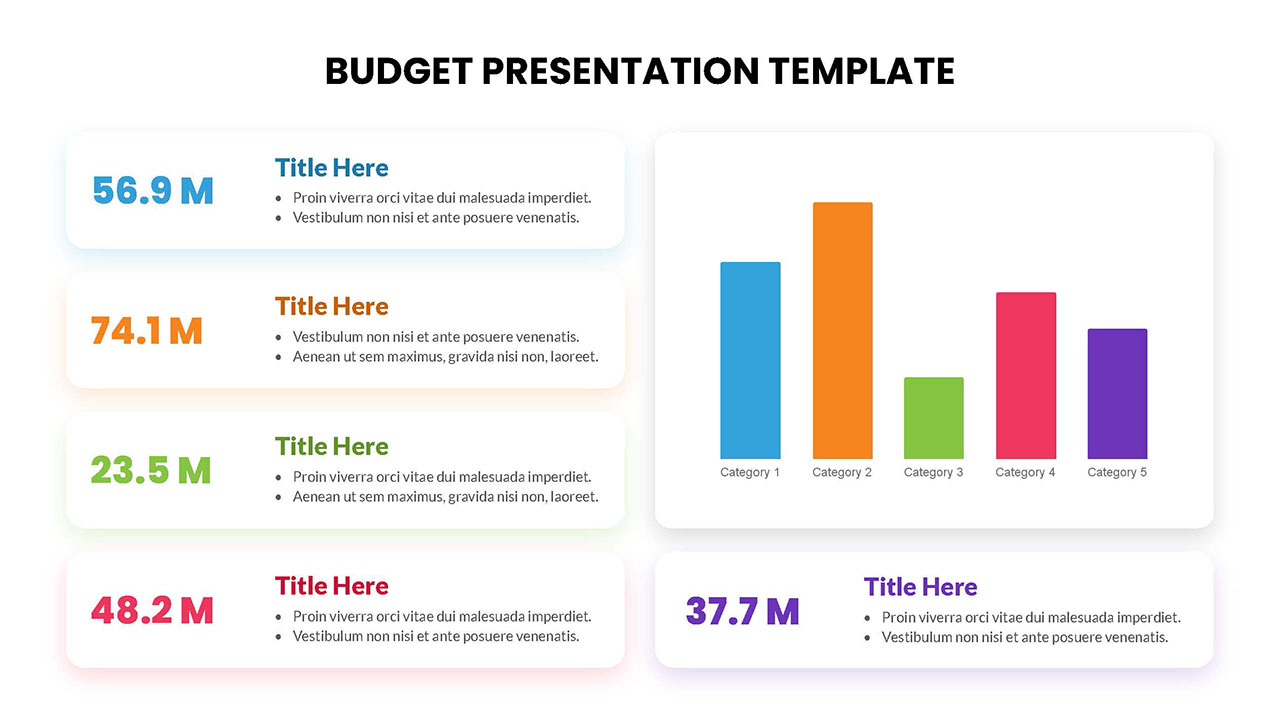
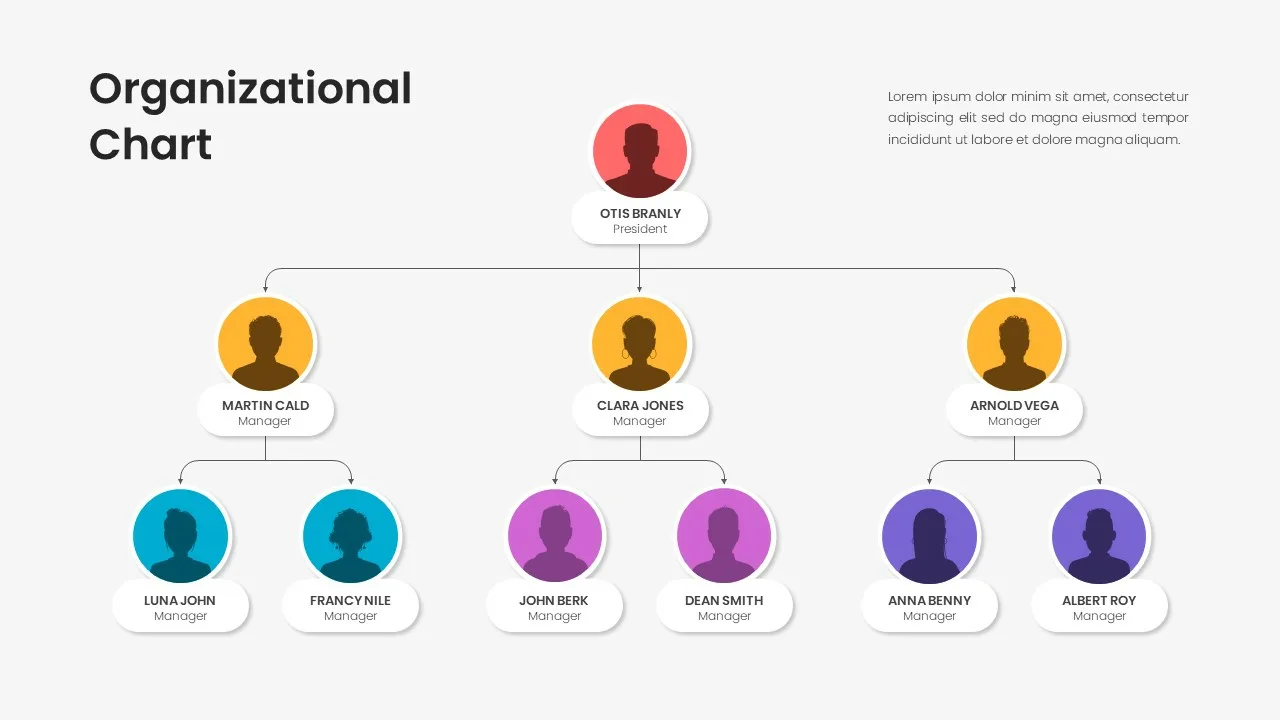
Dashboard Infographic Template
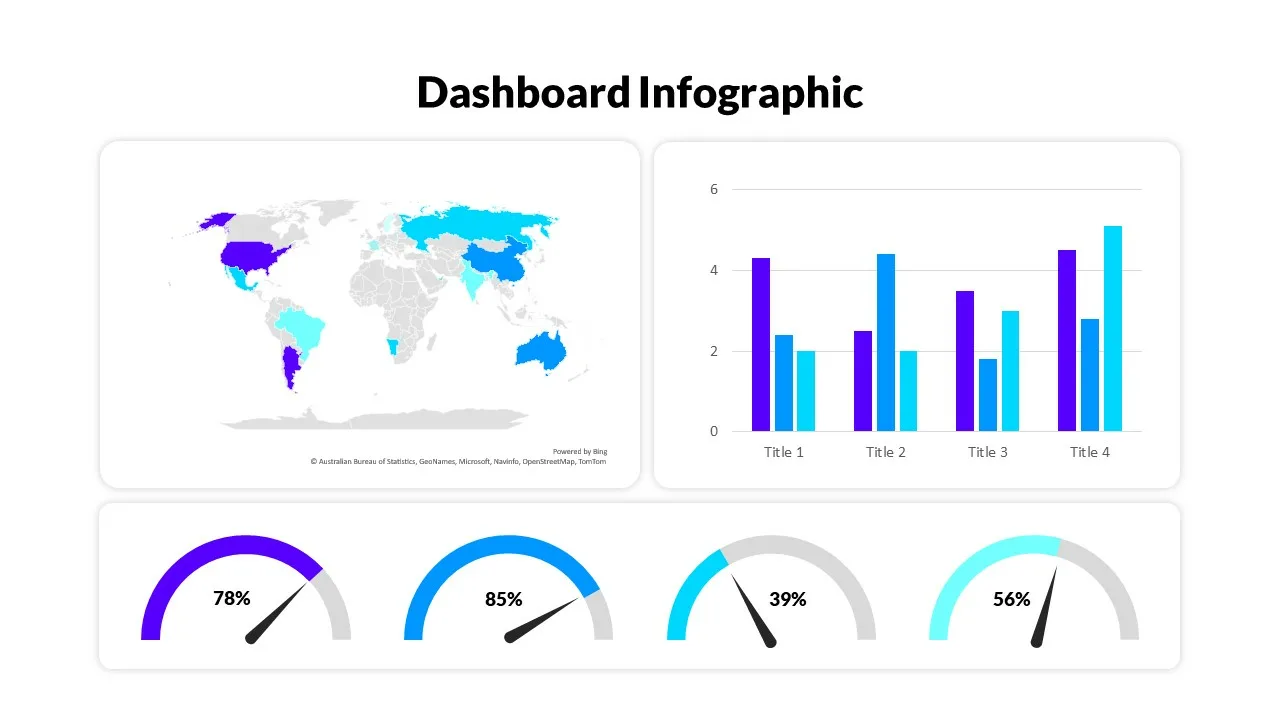
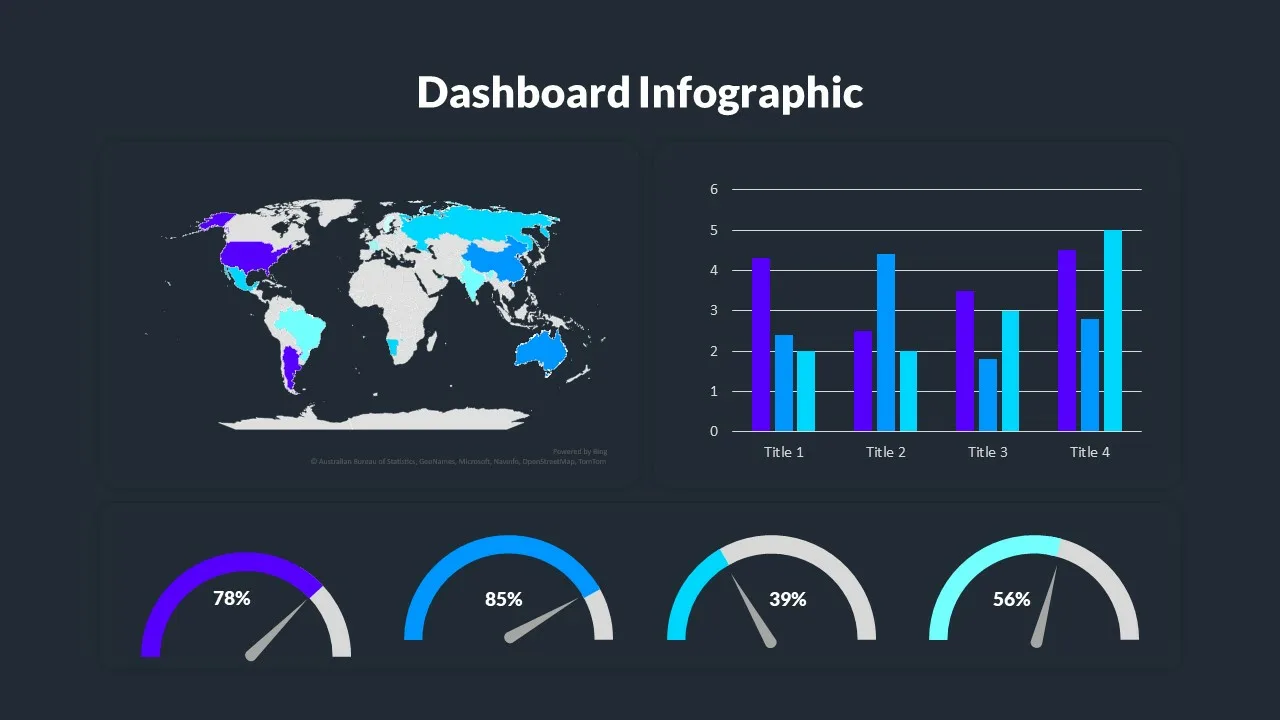
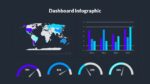
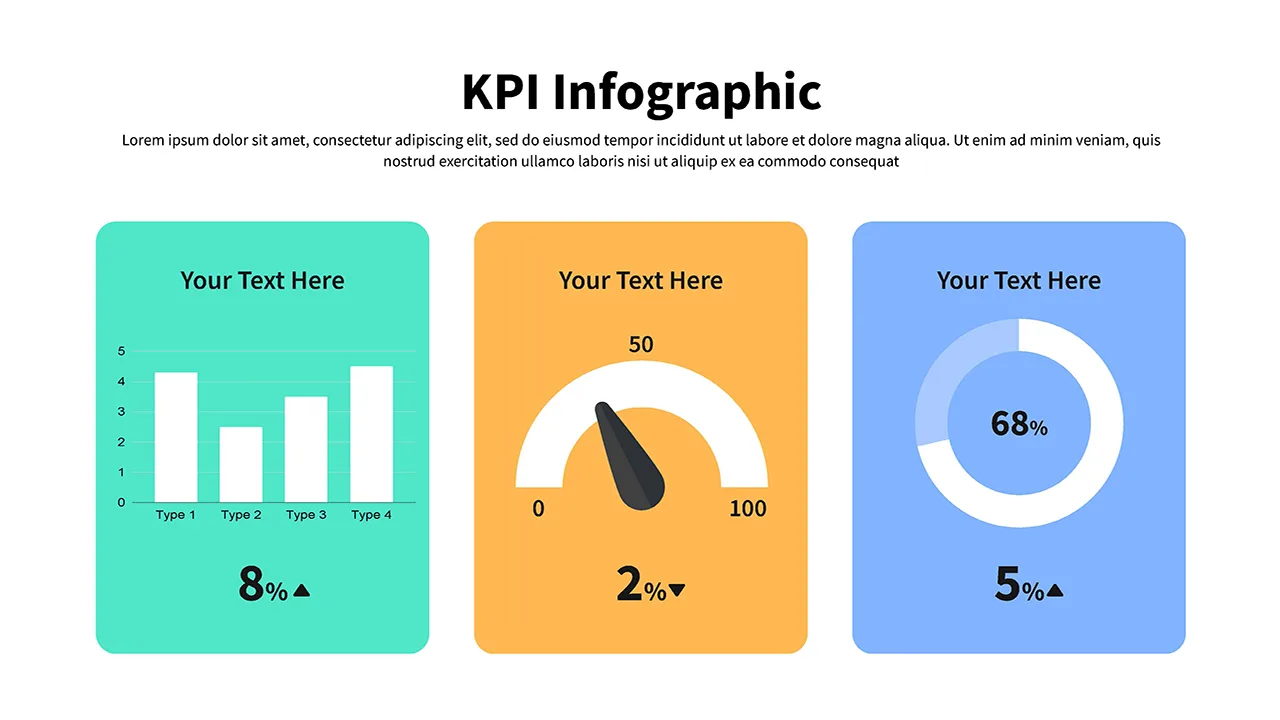
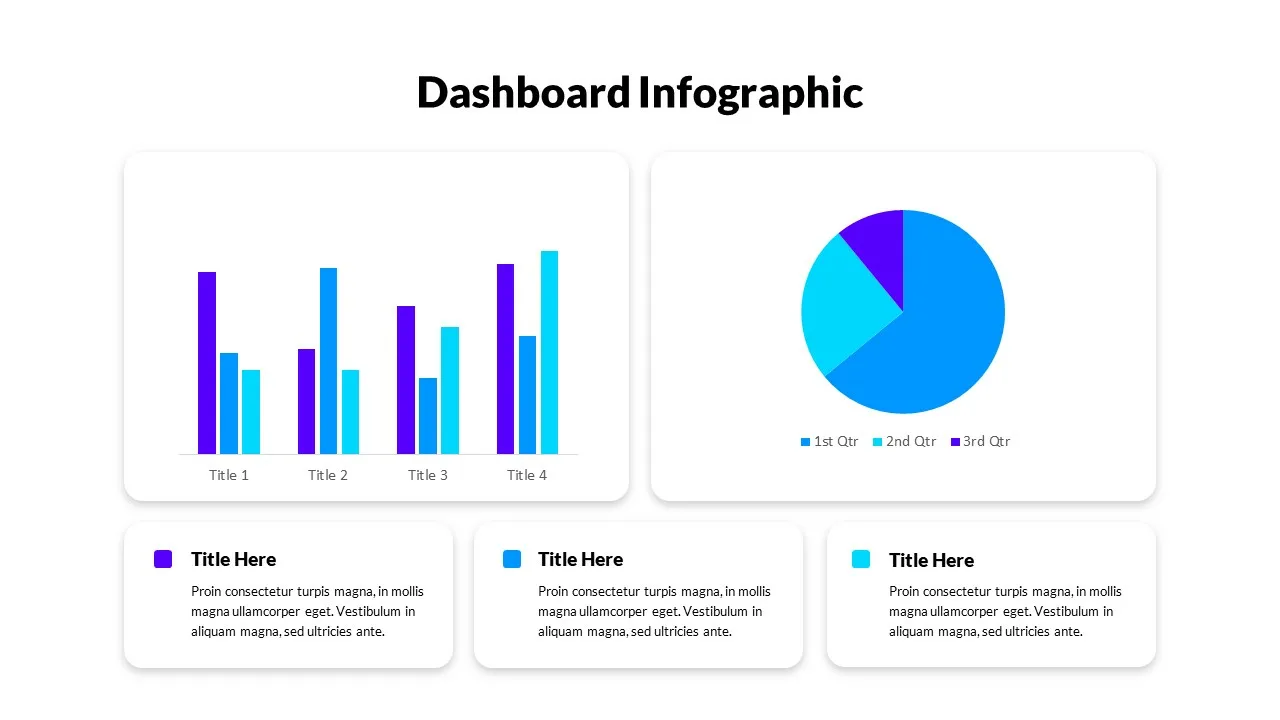
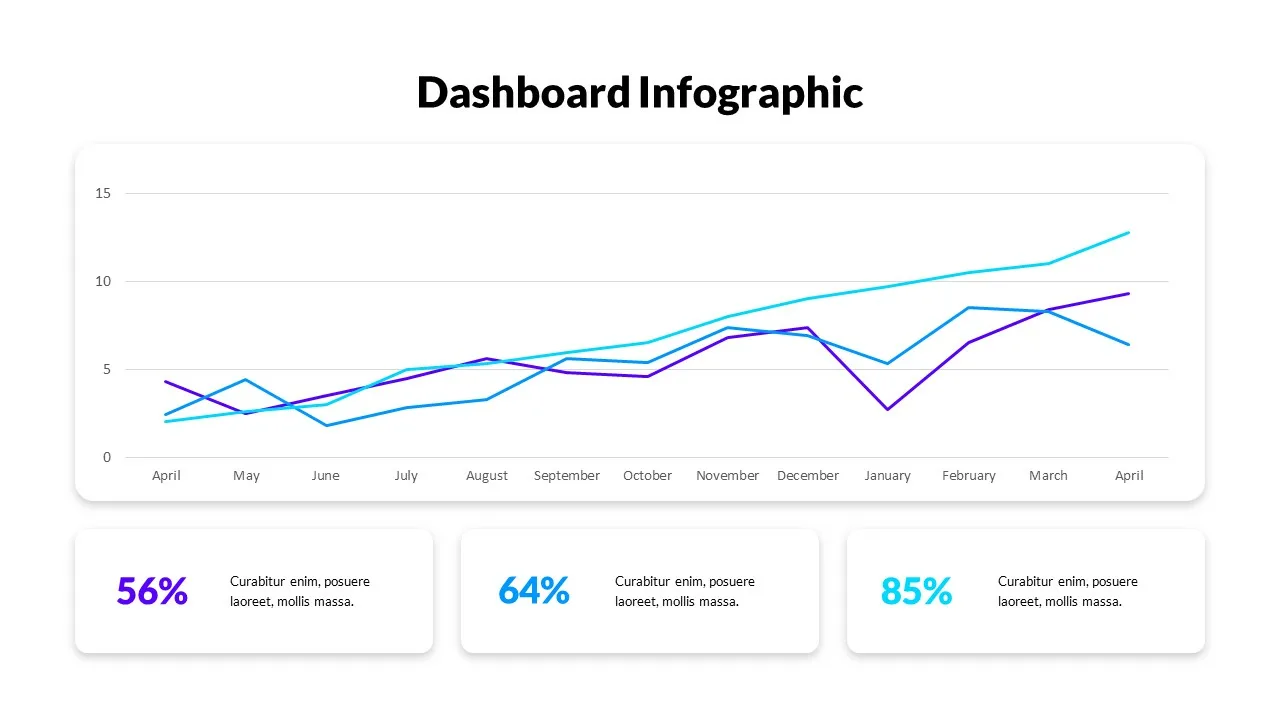
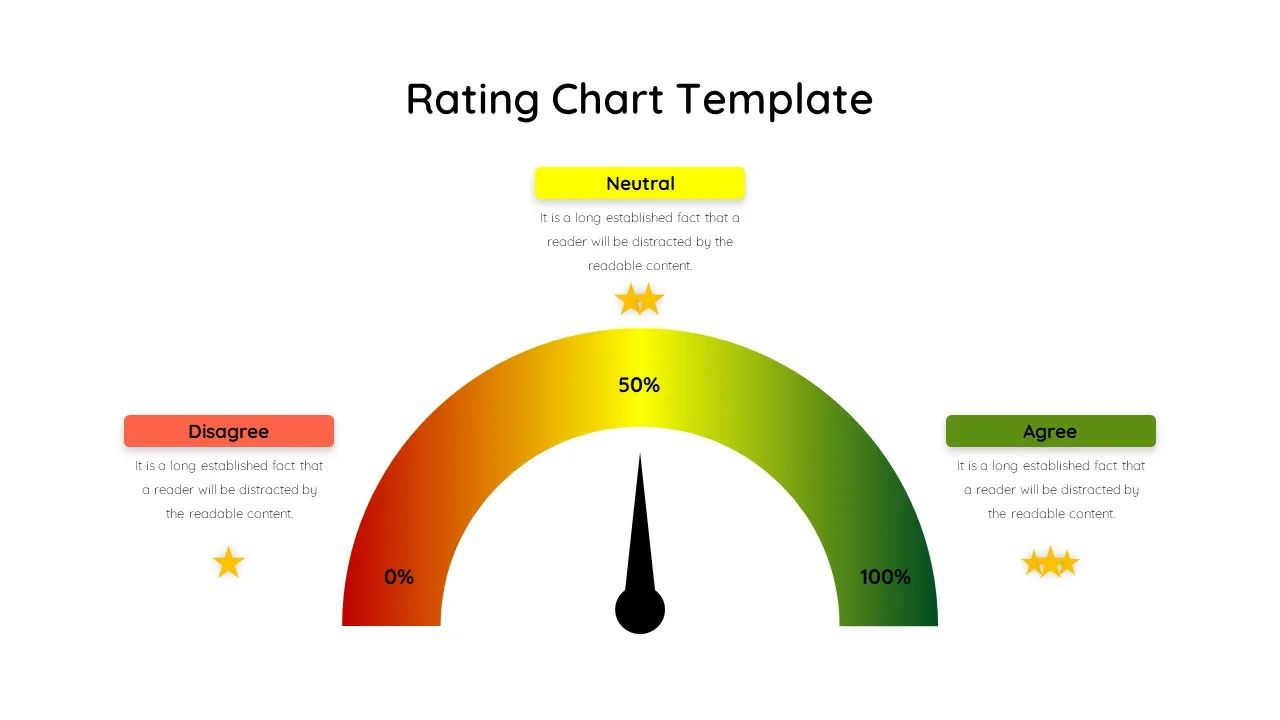
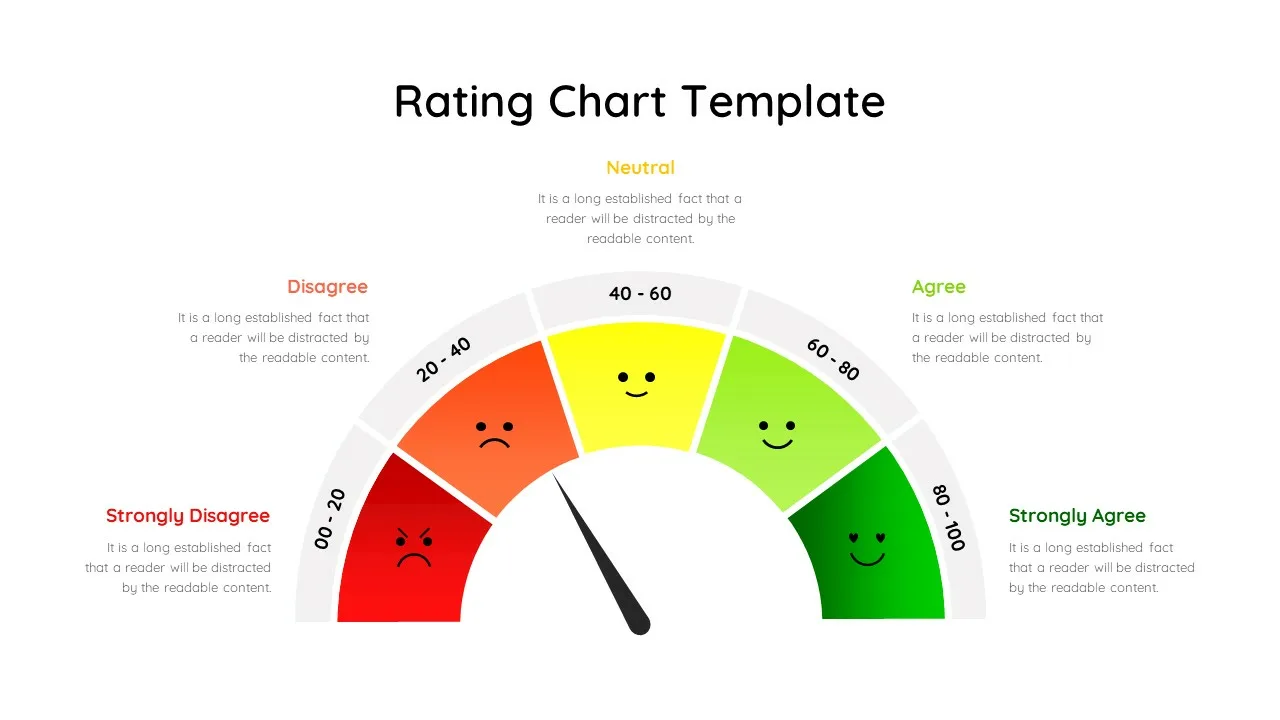
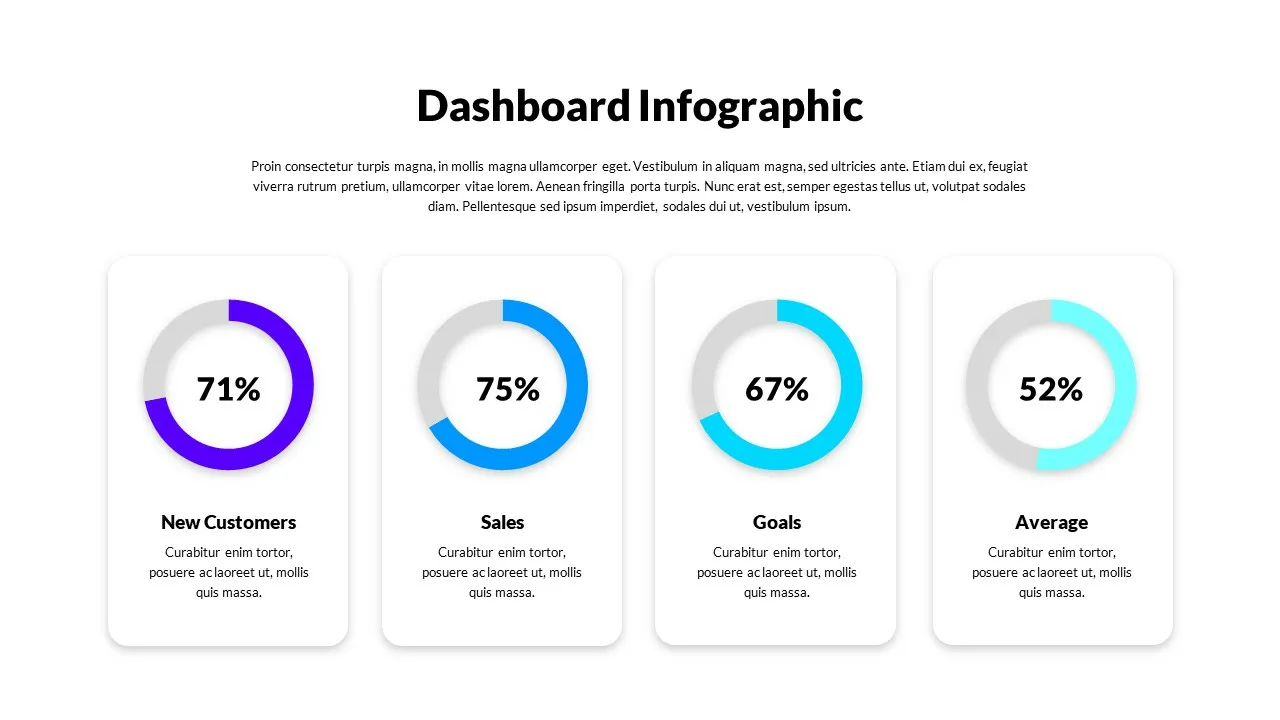
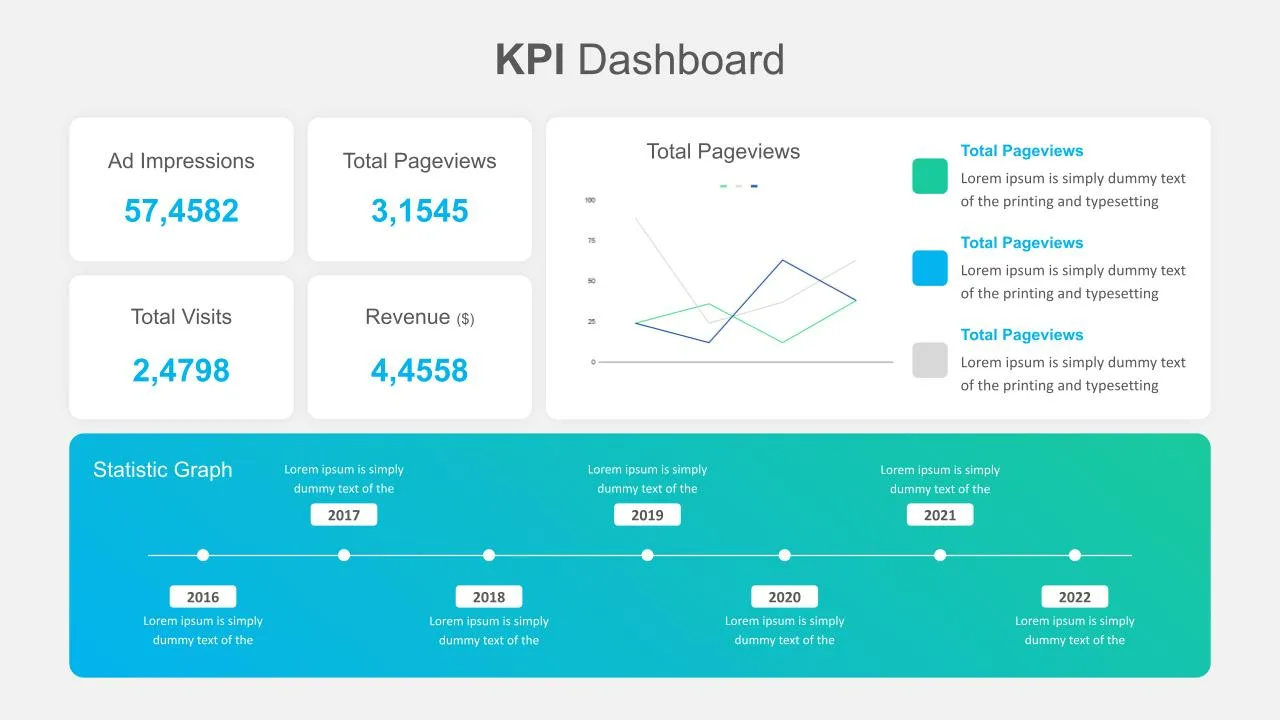
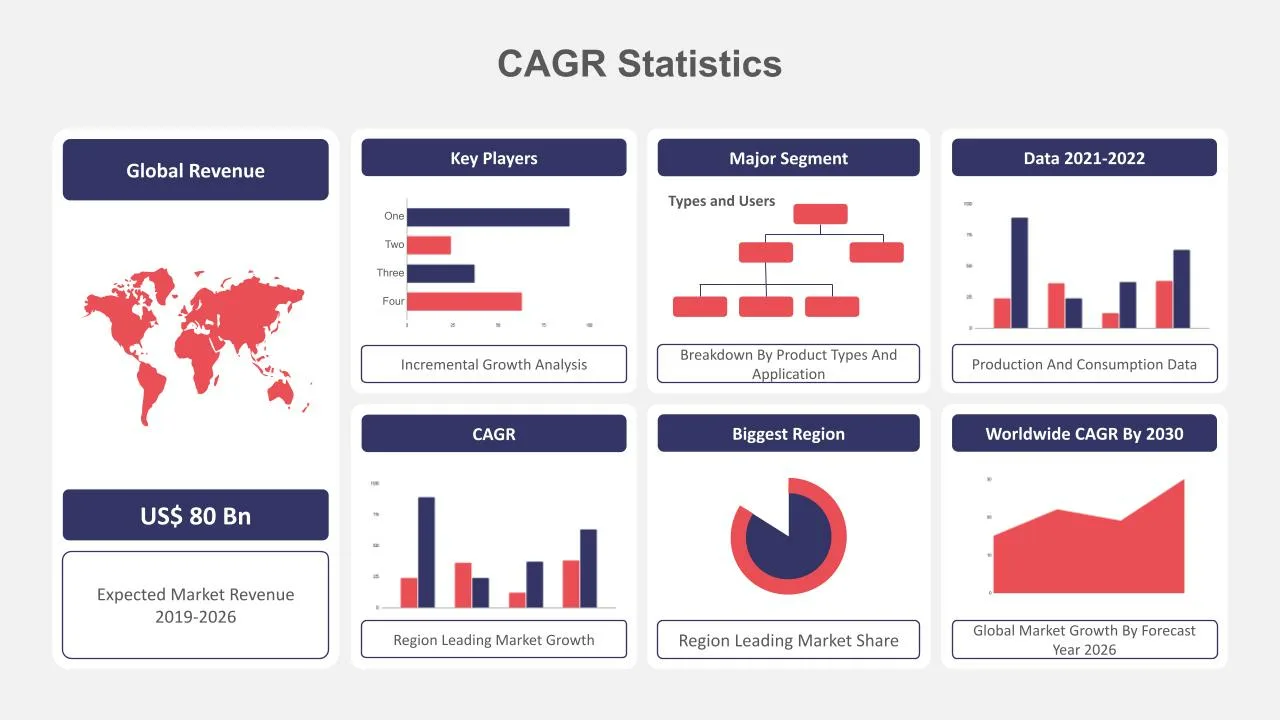
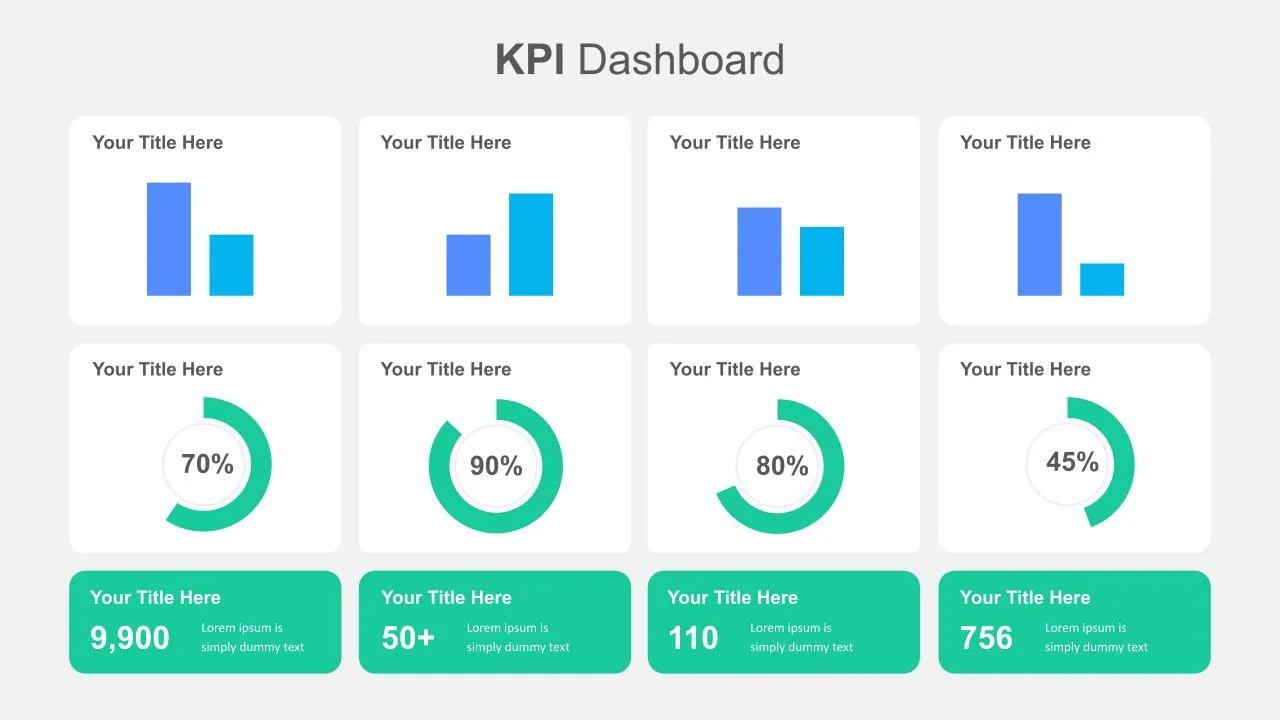
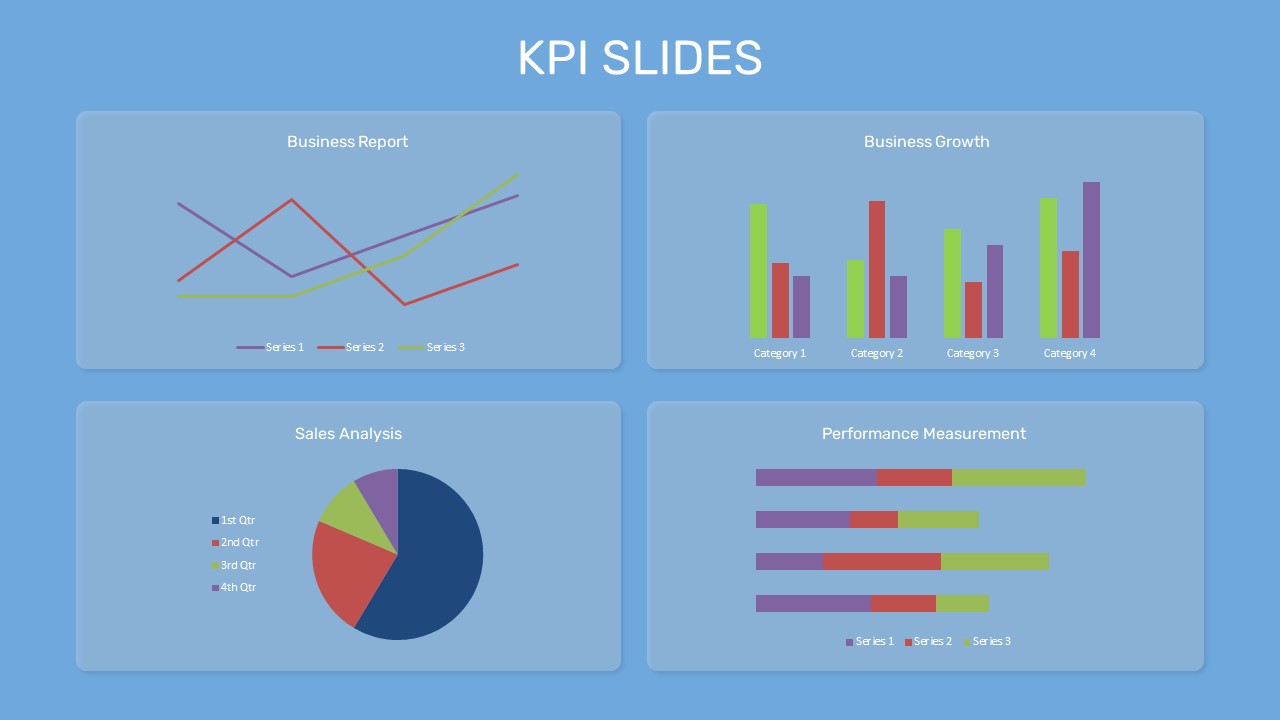
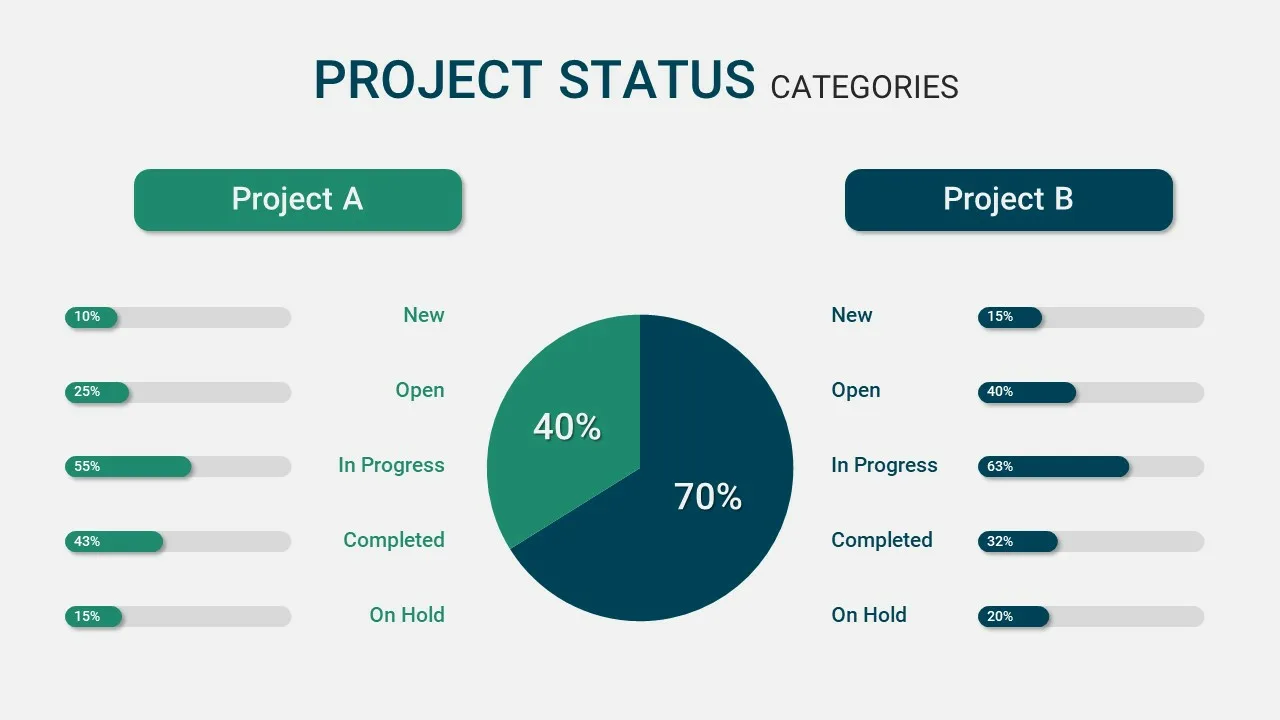
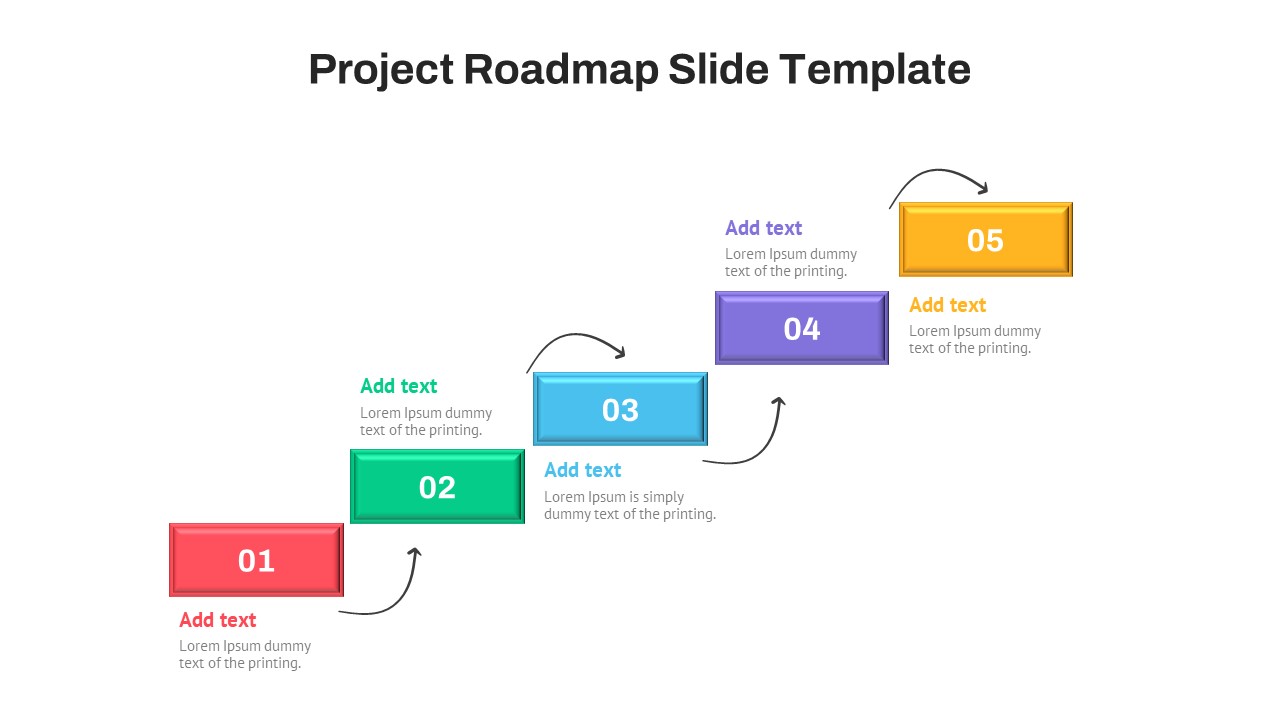
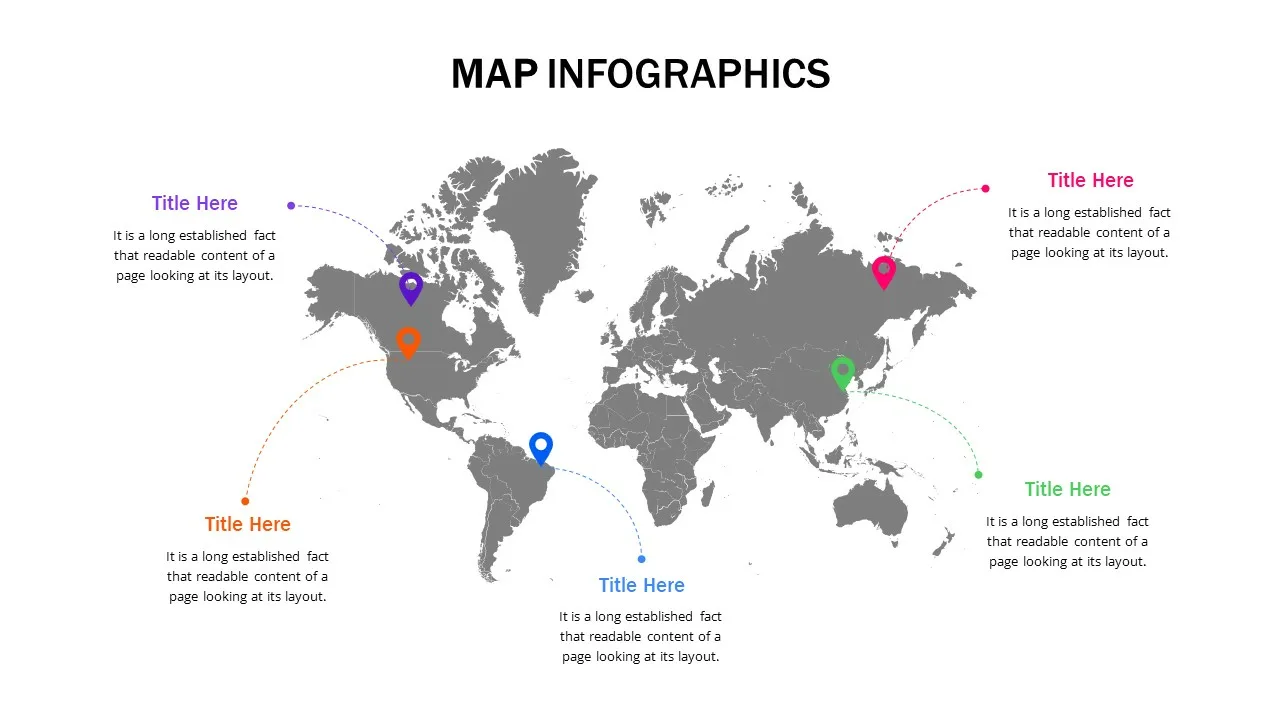
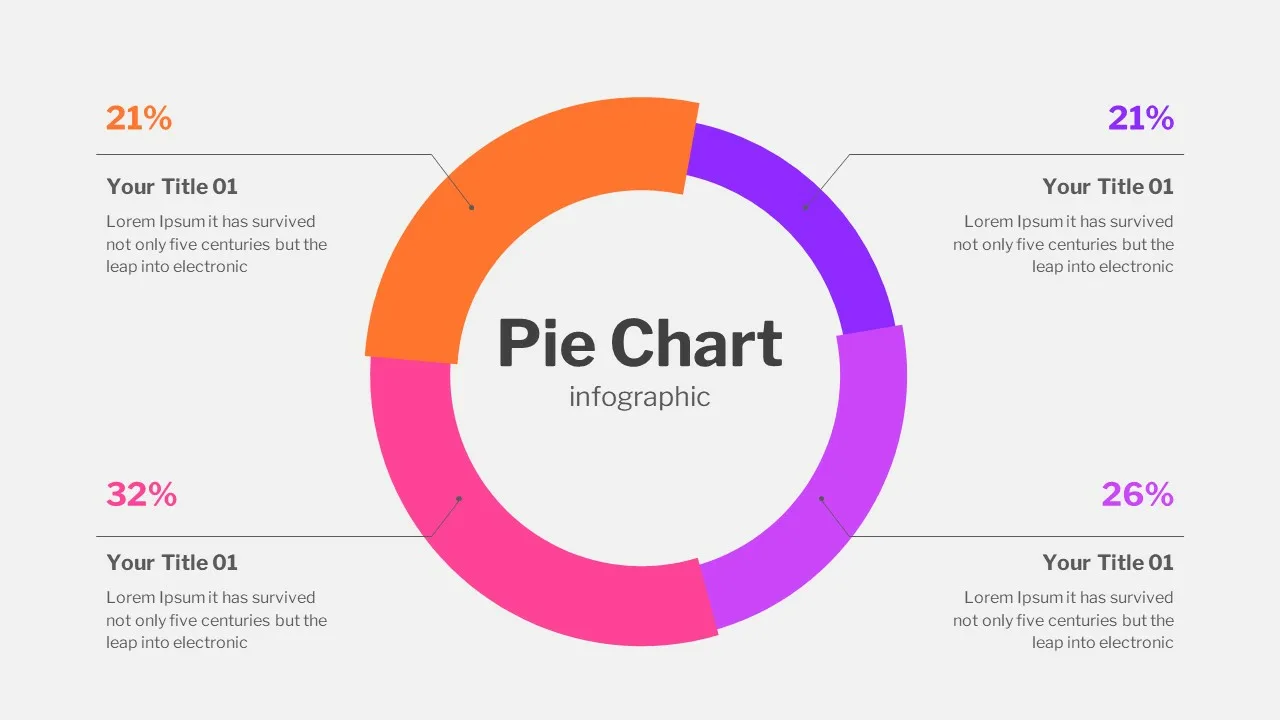
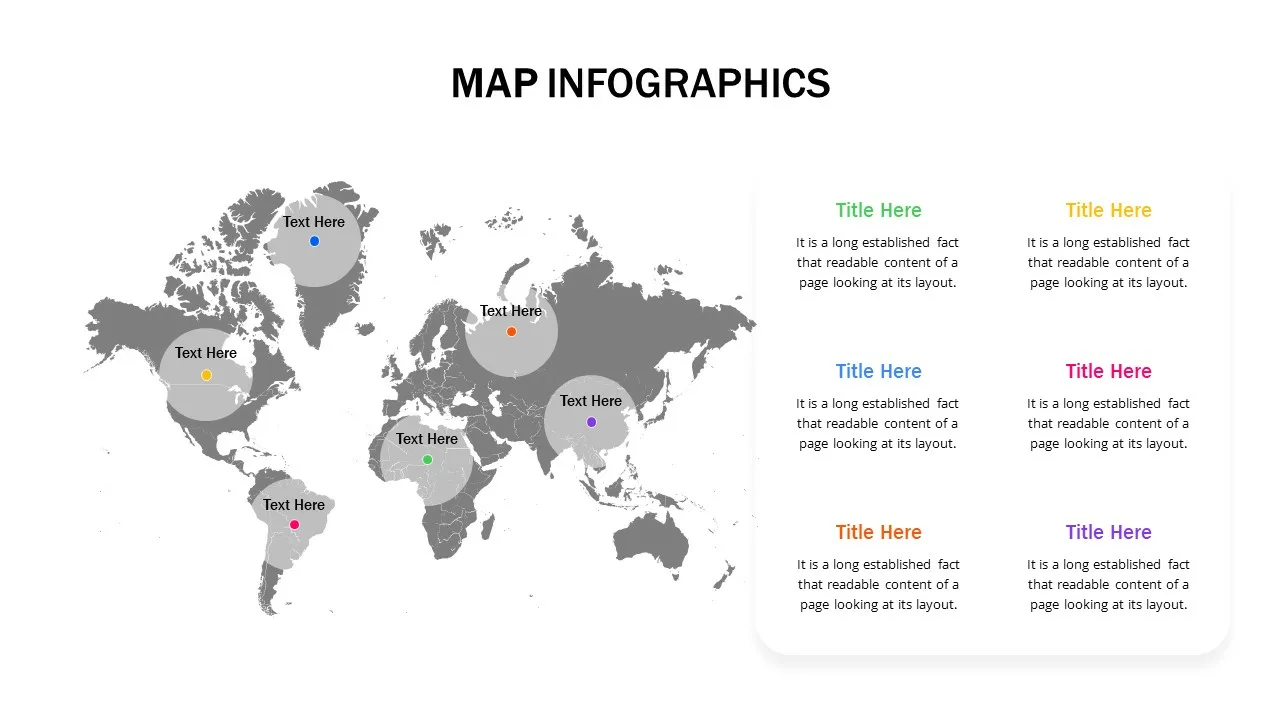
Dashboard slides are statistical presentation templates for quick views. For example, this simple dashboard infographic combines a data-driven bar chart, speedo meter gauges, and a world map slide in a single design. Dashboard reporting enables viewers a quick view across. So, people like dashboard presentation slides because of the comprehensive information they provide and the simplicity of catching up on the content.
A business professional can organize an impactful presentation using these slides’ simple structure and sections. The presenters can change the background theme of the slides if they need a different look. You can use summary presentation slides for financial data, performance analysis, and many other metrics. Get them now!
See more

Aspect Ratio
16:9Item ID
SKT00226
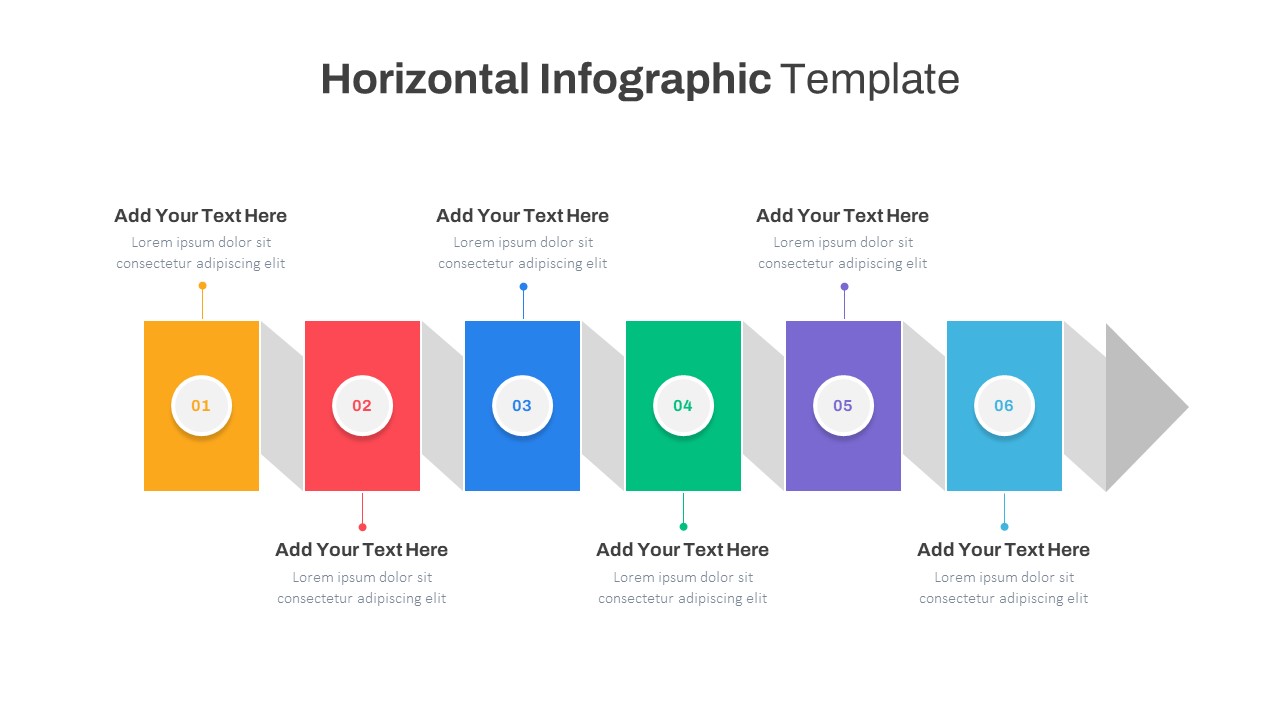
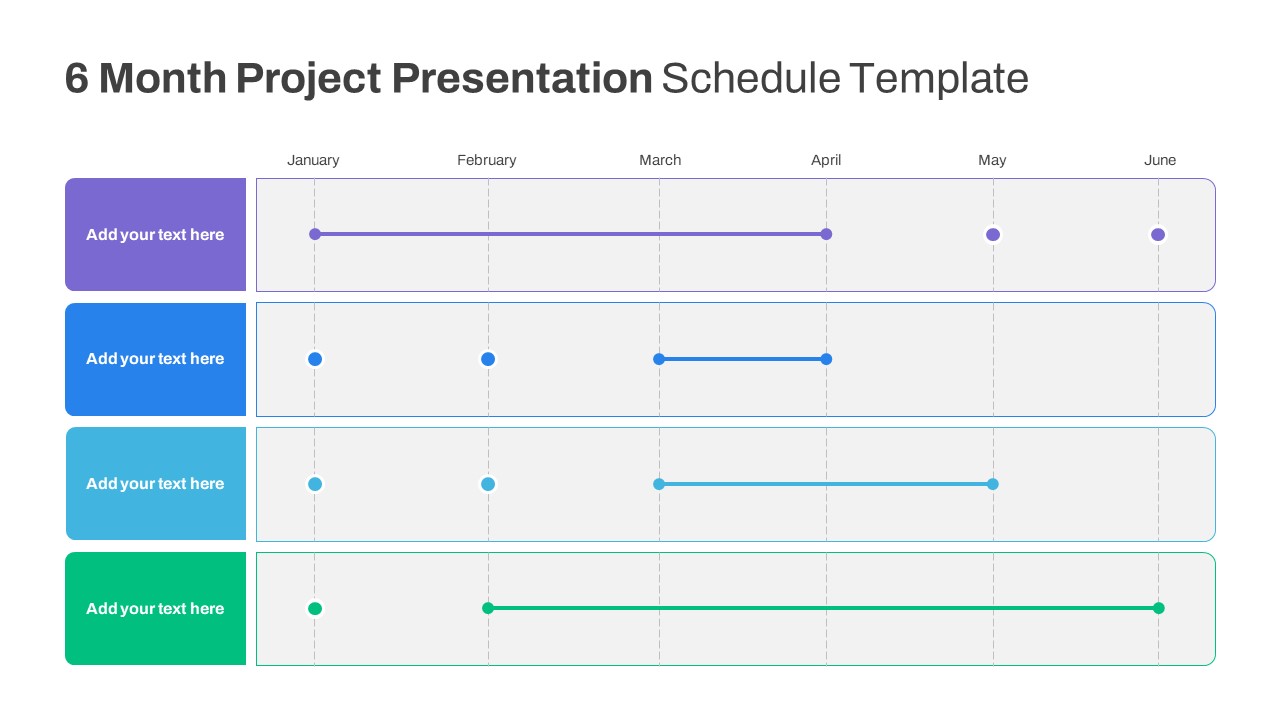
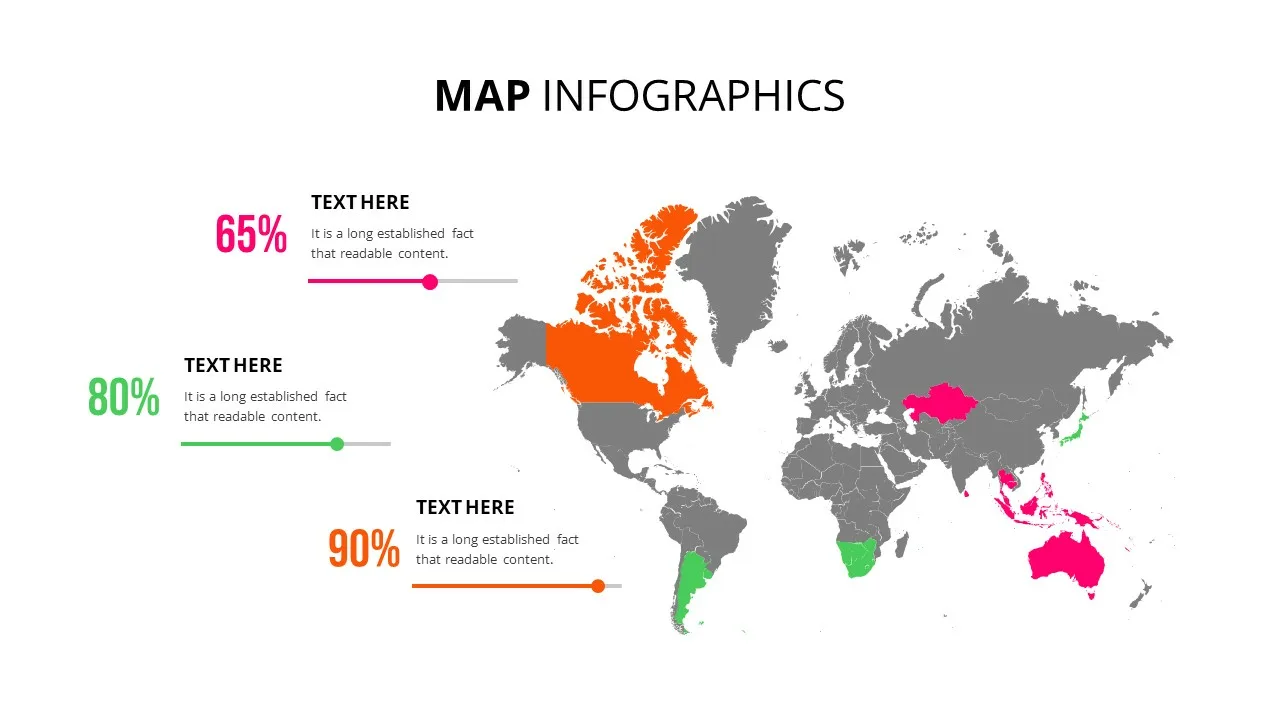
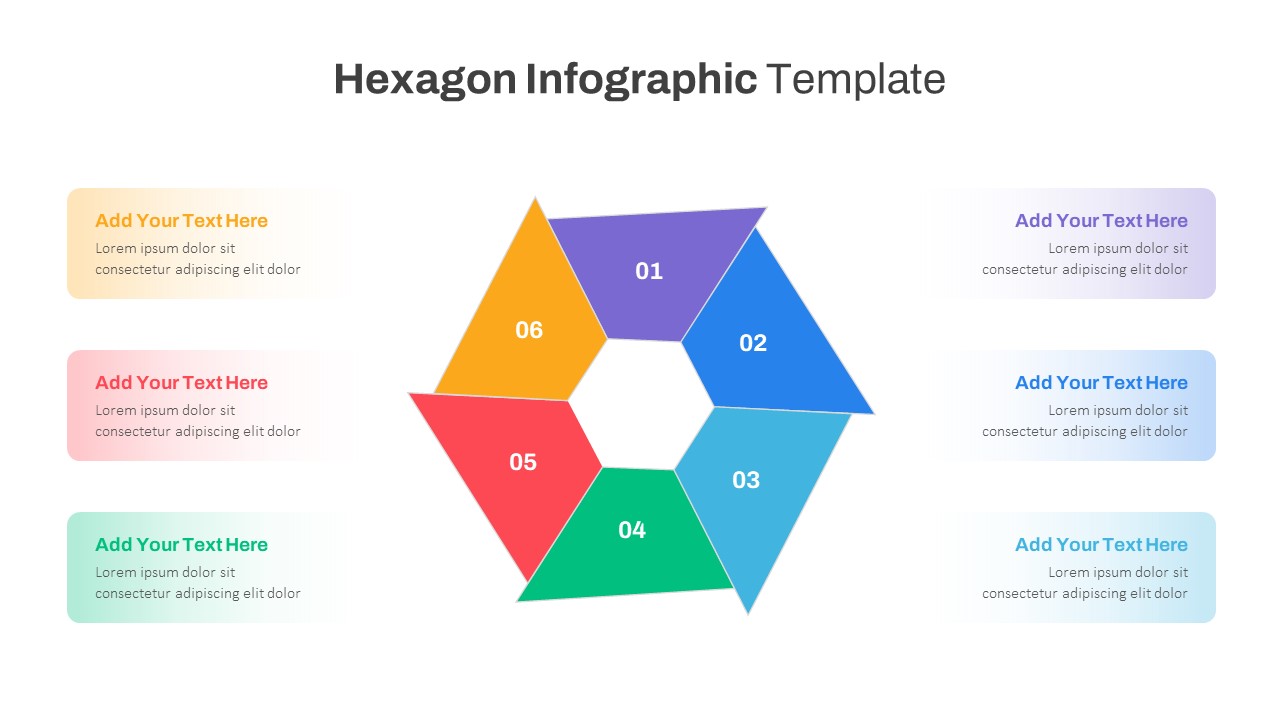
You May Also Like These Presentation Templates


- Free
- Free
- Free
- Free