Data Analysis PPT Template and Google Slides

Present your business insights and market trends effectively with our Data Analysis PPT Presentation Template. This template is designed for business analysts, data scientists, financial experts, and strategists looking to visually communicate key metrics, performance trends, and comparative data in a professional and engaging manner.
Key Features:
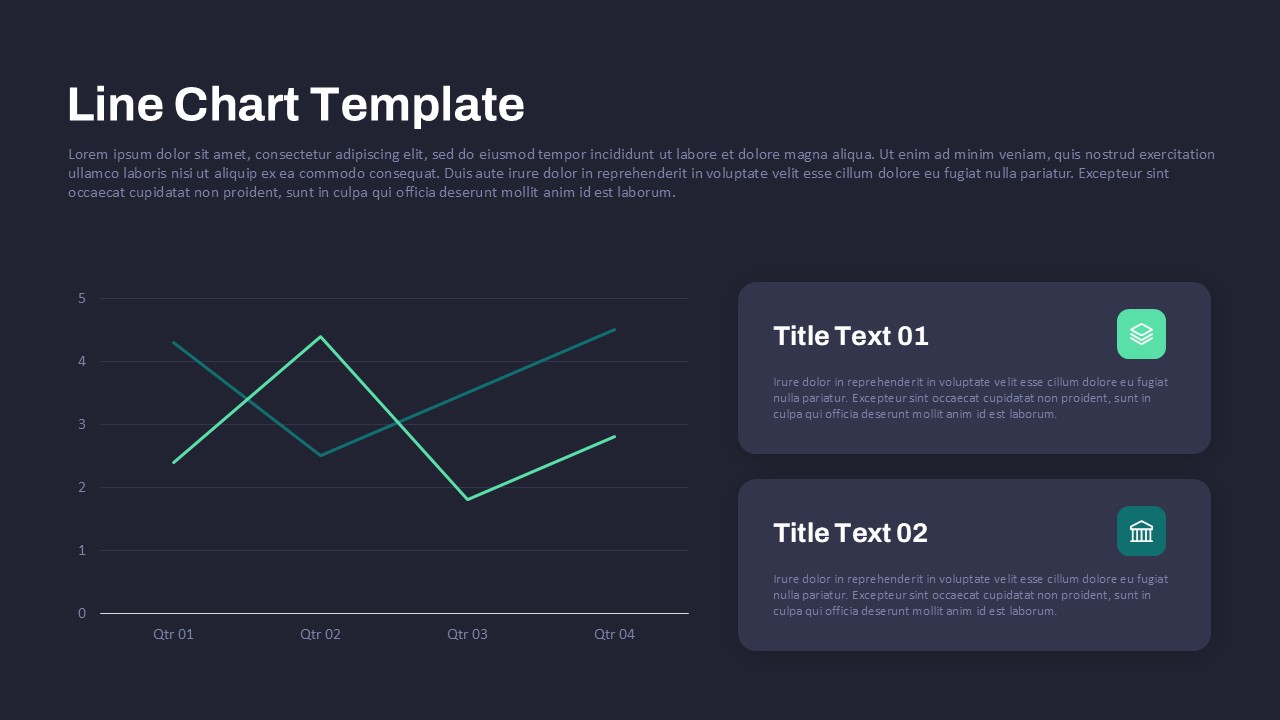
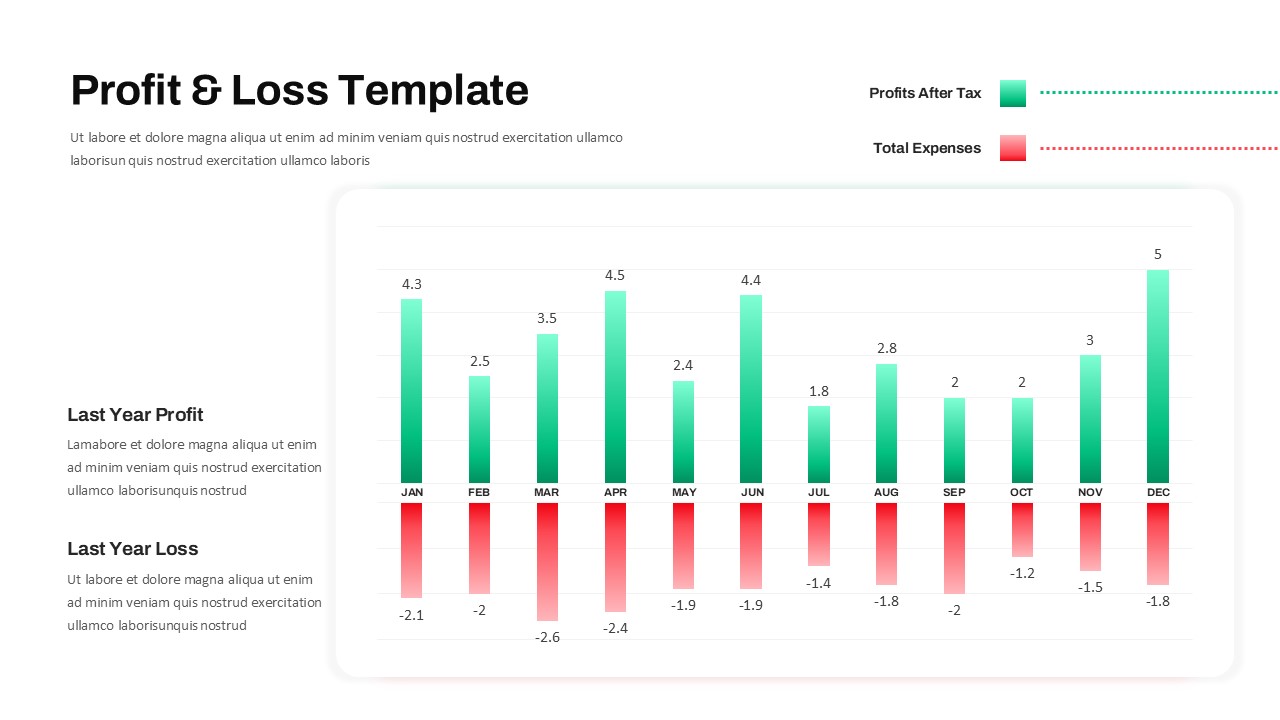
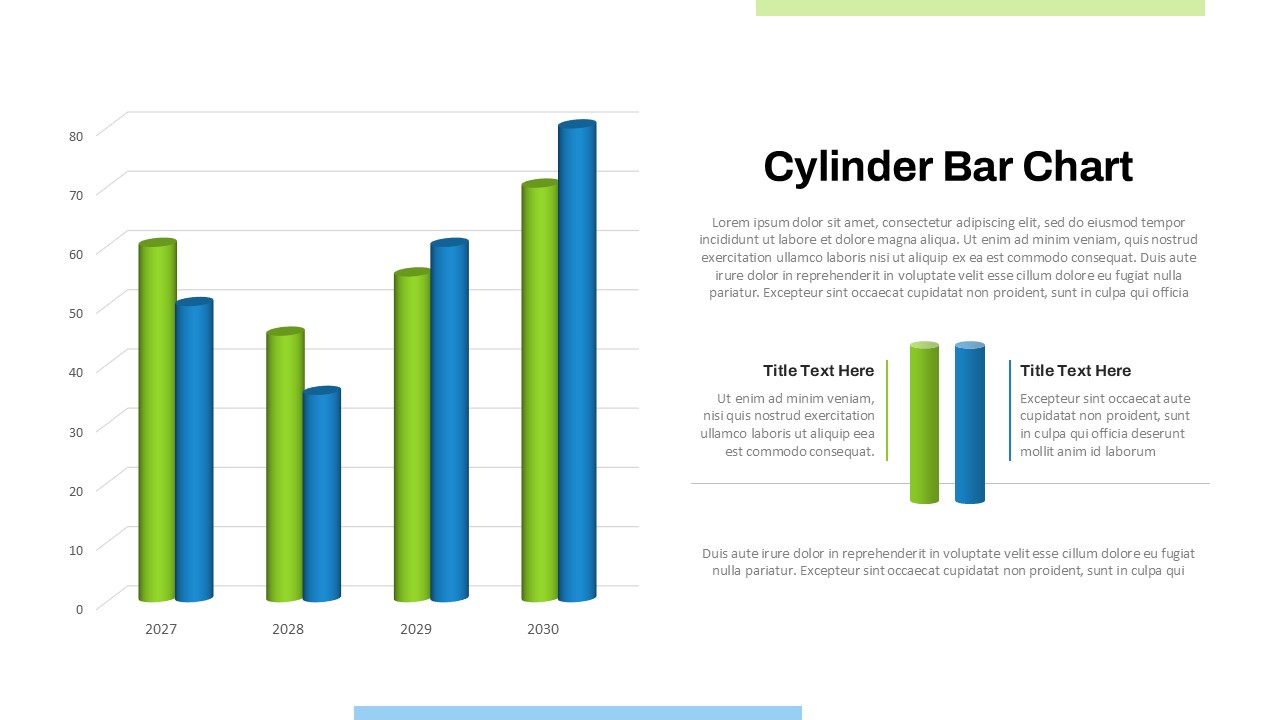
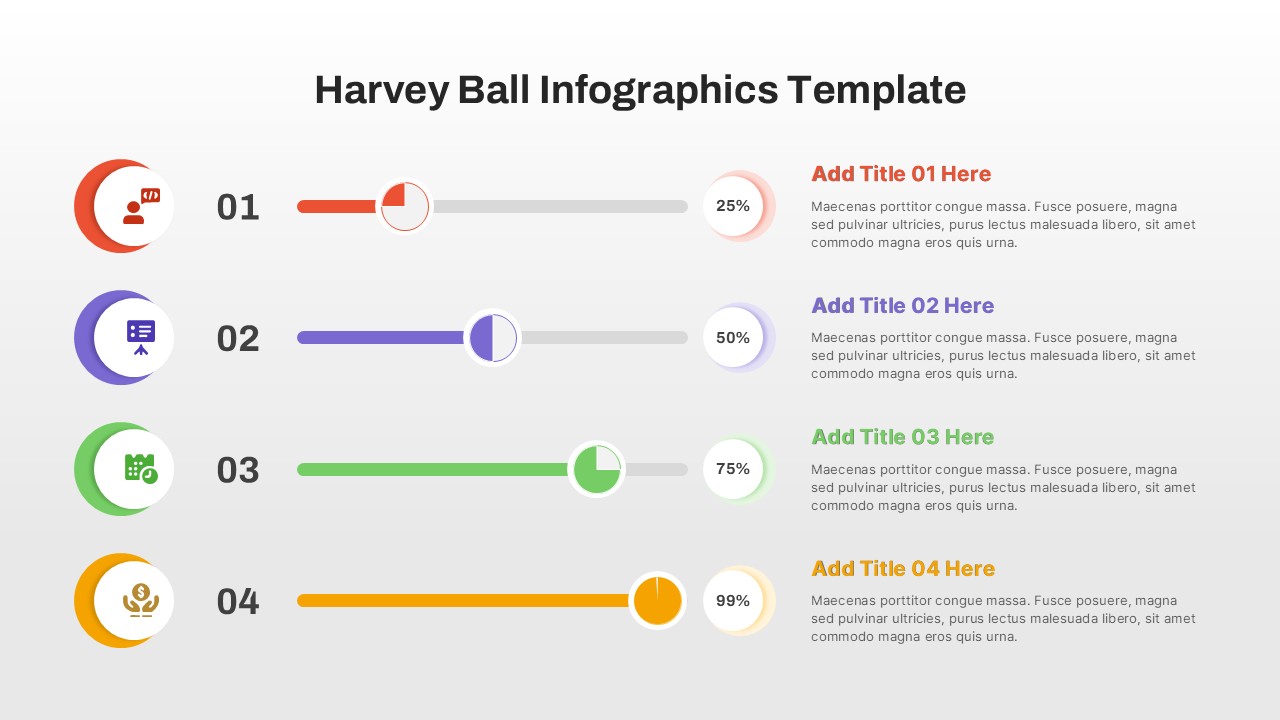
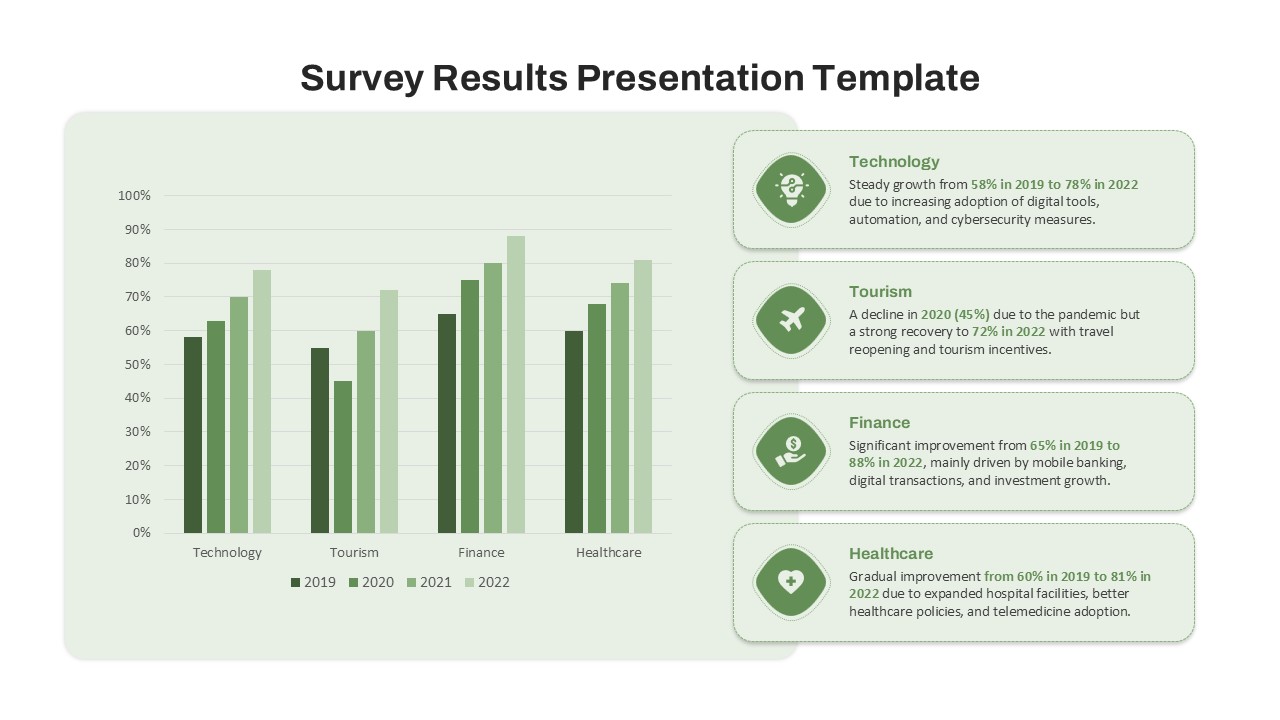
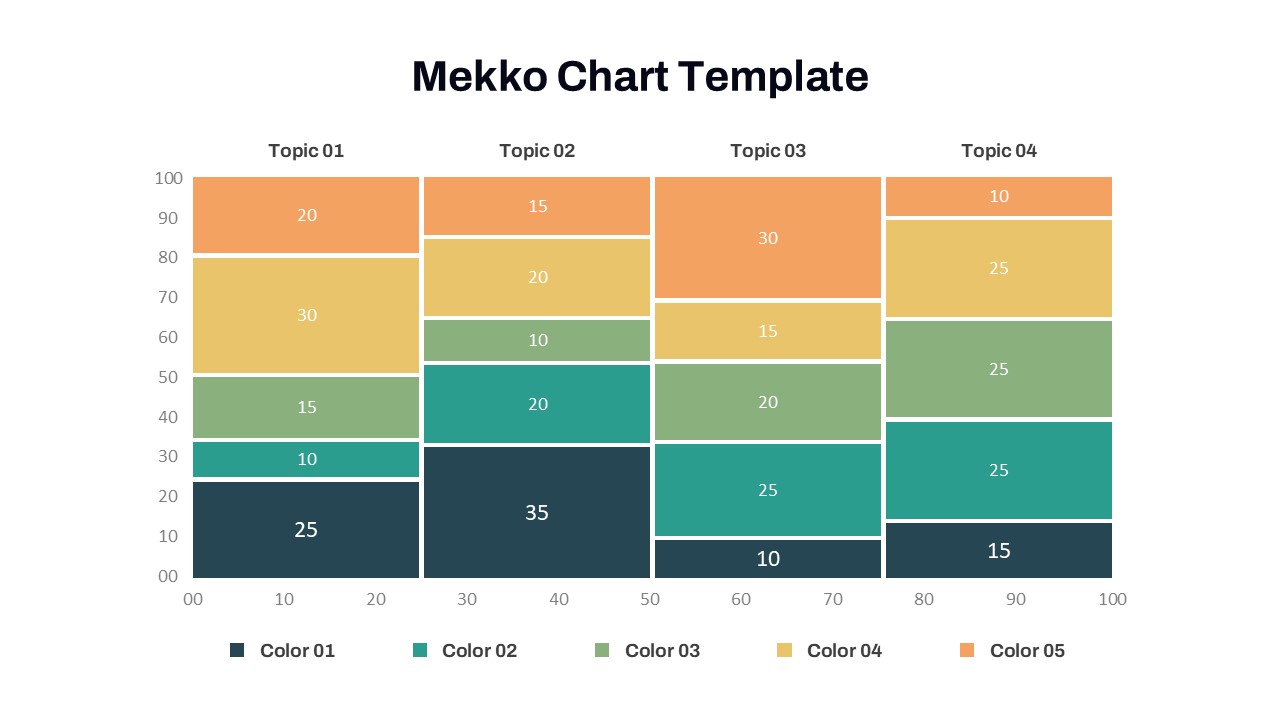
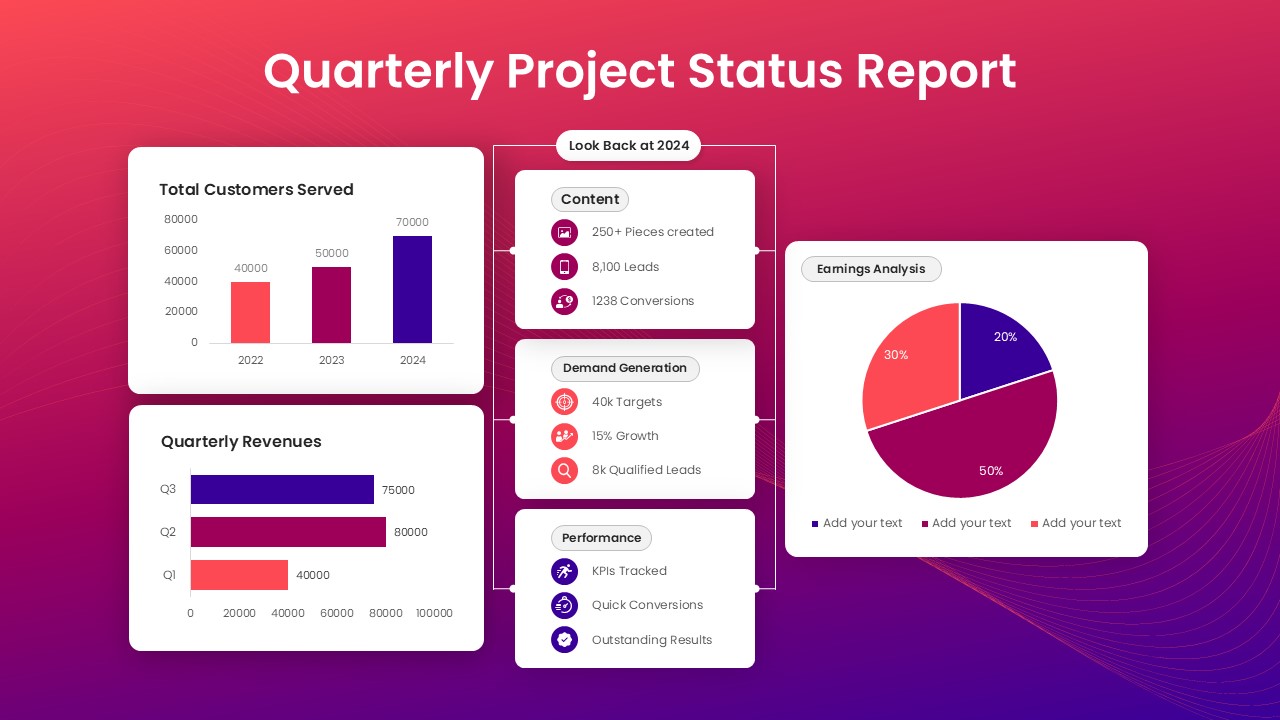
Growth Chart Representation – A clean bar chart displaying multi-year revenue trends across four companies for easy comparative analysis.
Company Performance Breakdown – Percentage growth rates with highlighted key insights for each company.
Color-Coded Data Visualization – Each company is represented with a unique color for clear differentiation and analysis.
Fully Customizable Design – Modify text, colors, and data to align with your business needs and reporting requirements.
This PowerPoint and Google Slides-compatible template is ideal for financial reporting, business intelligence reviews, investment presentations, market research analysis, and corporate strategy meetings. Whether you’re tracking industry trends, evaluating competitors, or forecasting business growth, this template provides a clear and structured format to enhance decision-making.
Download now and transform complex data into actionable insights with this professional Data Analysis Template!
See more

Aspect Ratio
16:9Item ID
SKT03315
Features of this template
Other User Cases of the Template:
Financial performance reports, competitor analysis, revenue growth tracking, business intelligence dashboards, investment strategy presentations, sales forecasting, quarterly business reviews, market trend analysis, corporate decision-making reports, startup funding pitches.
FAQs
You May Also Like These Presentation Templates


- Free

- Free

- Free

- Free
- Free
- Free
- Free
- Free