Data Driven Financial Analysis Slide Template

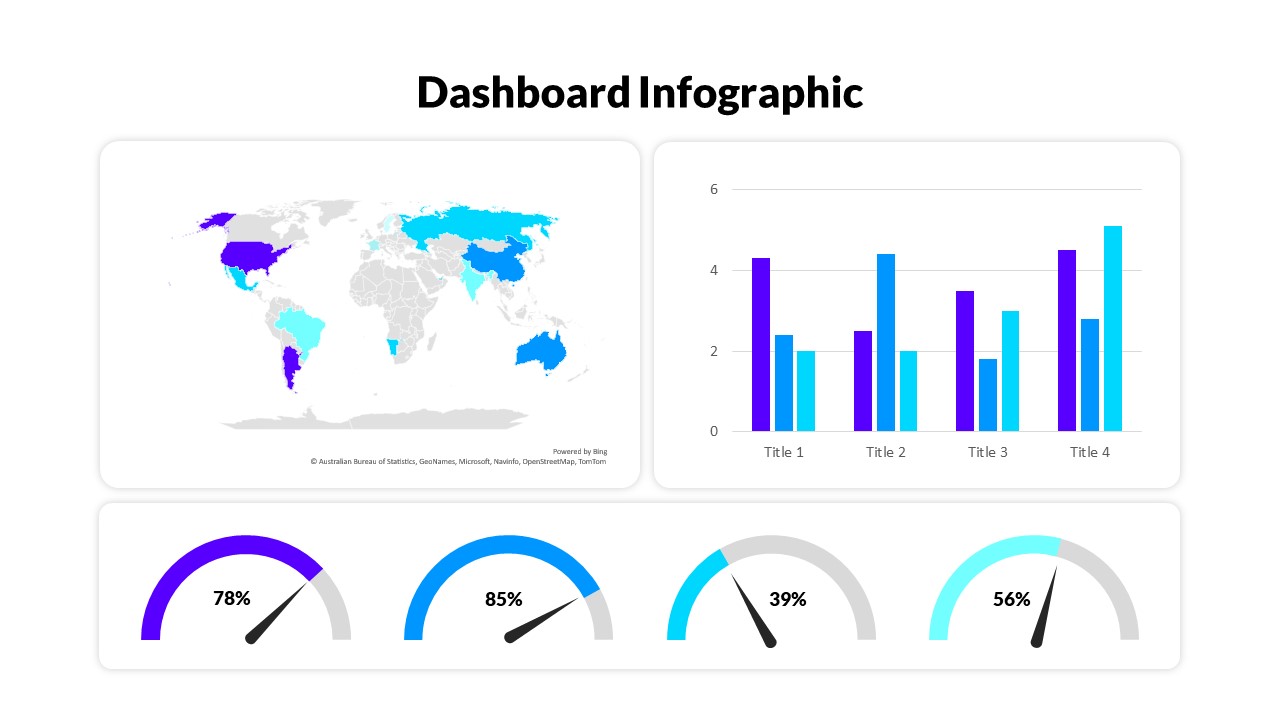
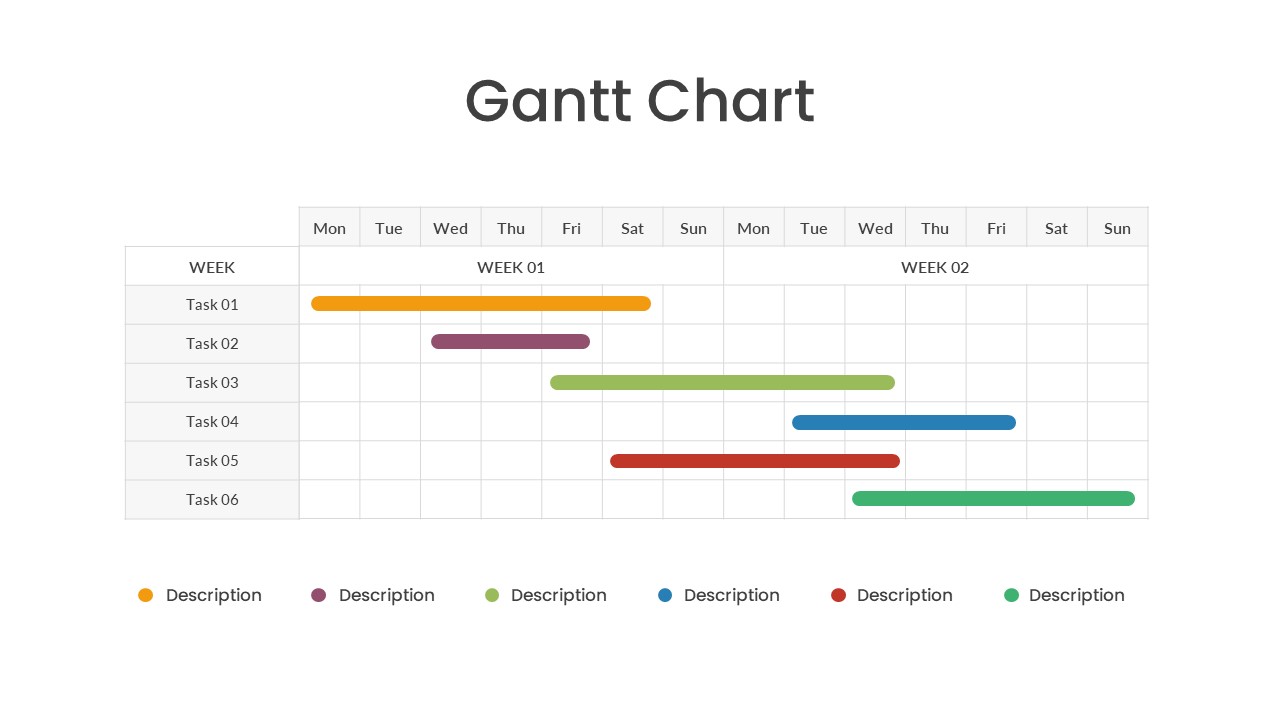
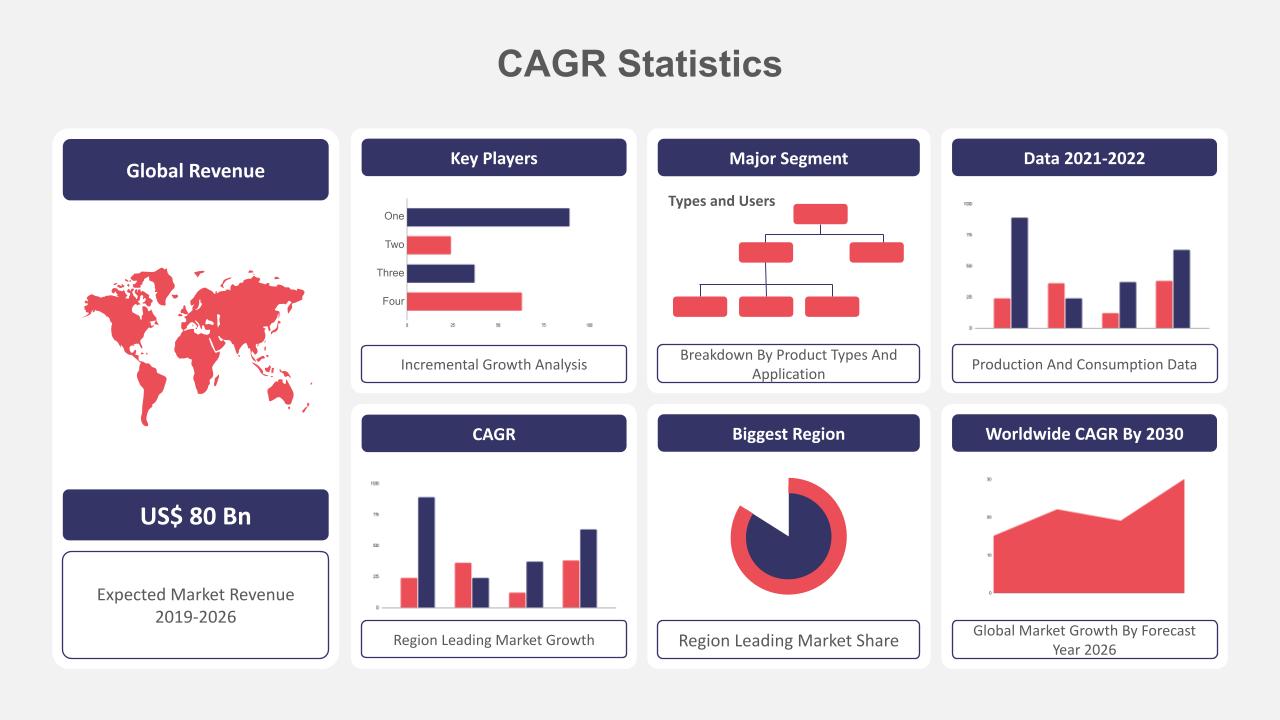
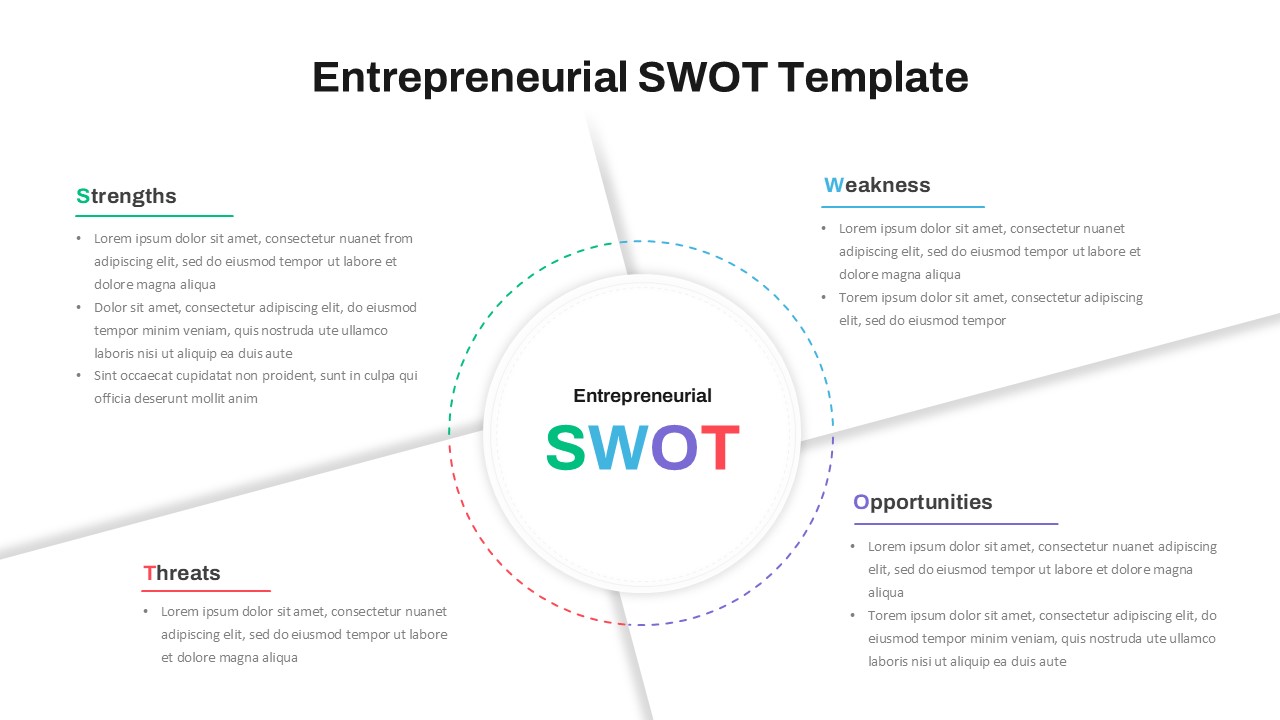
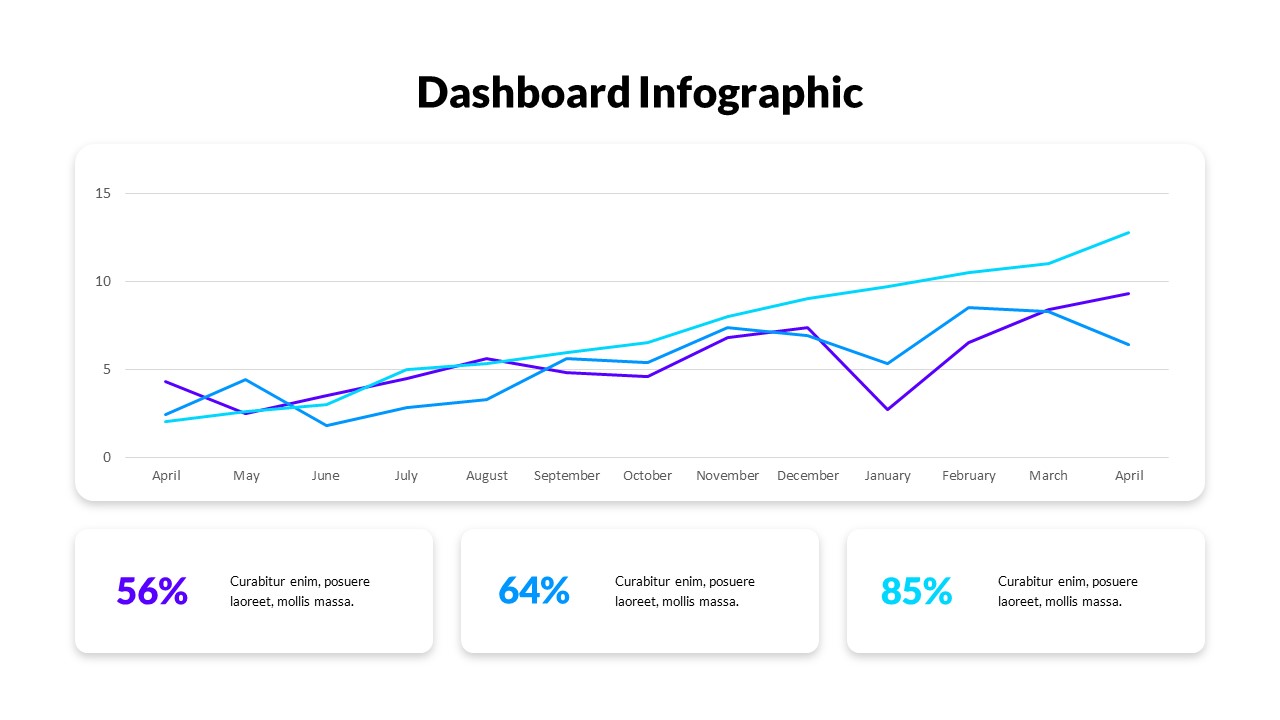
The Data-Driven Financial Analysis Slide Template is designed to help professionals present complex financial data in a clear and visually compelling manner. This Data Driven PowerPoint Chart template features a clean and structured layout with three side-by-side bar charts, each labeled with a unique placeholder that can be customized to fit your data presentation needs. The bar charts are ideal for displaying key financial metrics, trends, or comparisons across different periods or categories.
The minimalist design ensures that your data stands out, making it easier for your audience to grasp the insights at a glance. Each section is numbered, providing a logical flow that guides viewers through the information step by step. This template is perfect for financial analysts, accountants, business strategists, and anyone looking to present data-backed insights in a professional setting.
With full customization options, you can adjust the colors, fonts, and chart styles to match your brand or presentation theme. The template is compatible with both PowerPoint and Google Slides, making it versatile and easy to use across different platforms. Whether you’re preparing for a quarterly financial review, an investor presentation, or a performance report, this template provides a solid foundation for delivering your data-driven narrative effectively.
See more

Aspect Ratio
16:9Item ID
SKT01180
Features of this template
Other User Cases of the Template:
Financial performance reviews, investor pitch decks, quarterly business reports, market analysis presentations, budget comparisons, revenue tracking, financial forecasting sessions.FAQs
You May Also Like These Presentation Templates


- Free
- Free


- Free
- Free
- Free
- Free
- Free
- Free

- Free
- Free
- Free
- Free