Editable Gauge Chart PowerPoint and Google Slides

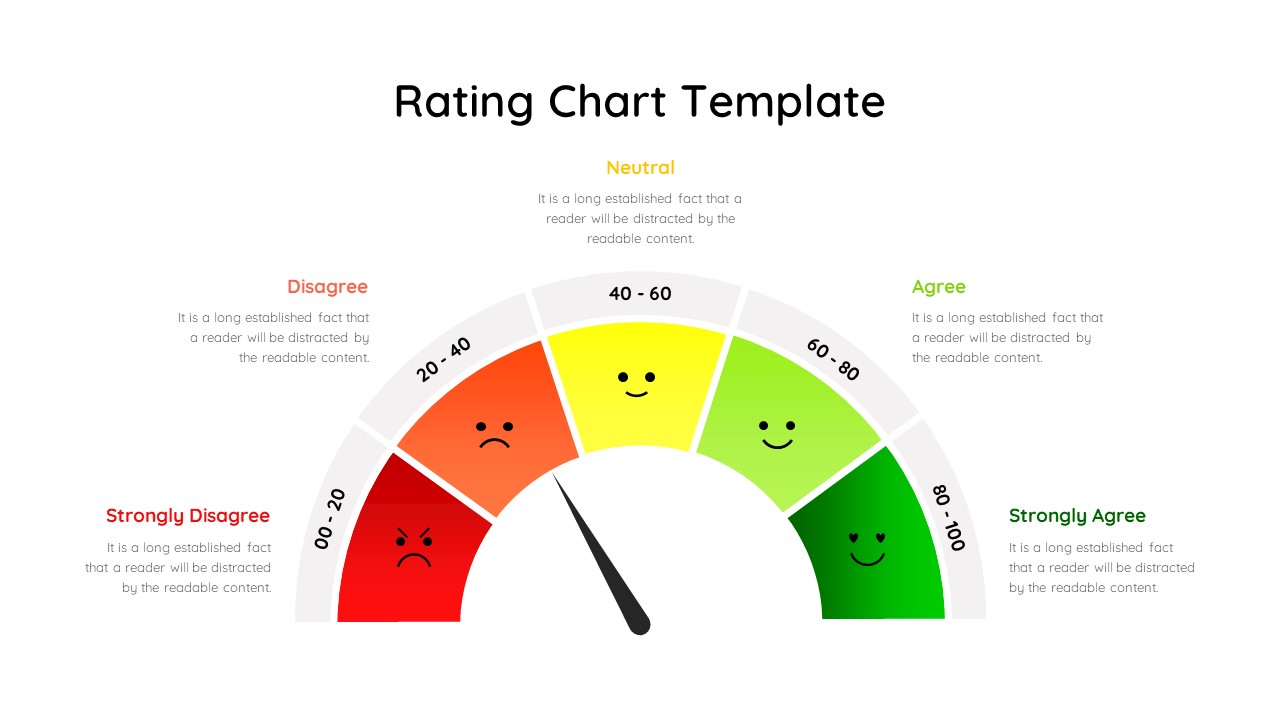
The Gauge Chart PowerPoint and google Slides is an effective and visually impactful tool designed to display performance metrics, survey results, or any type of rating data. This speedometer chart in PowerPoint template features a sleek, semi-circular gauge chart that ranges from “Very Low” to “Very High,” clearly representing data in a format that is easy to interpret at a glance. The different sections are color-coded, using a gradient that transitions smoothly from red (representing “Very Low”) to green (representing “Very High”). This color scheme enhances understanding, enabling viewers to quickly gauge the status of the metric being measured.
Ideal for business professionals, educators, and data analysts, this template is perfect for displaying performance benchmarks, satisfaction levels, risk assessments, and more. The right side of the slide includes a space for descriptive text, allowing you to explain each level of the gauge in detail, making sure your audience has complete clarity on the presented information. The color-coded legend aligns seamlessly with the corresponding sections of the gauge chart, ensuring consistency and easy navigation through the data.
Whether used for financial presentations, customer satisfaction surveys, KPI monitoring, or project status updates, the Gauge Chart Presentation Template is highly versatile and customizable. It is designed to be fully compatible with both PPT and Google Slides, making it easy for users to adapt it to their specific needs. Add your data effortlessly and bring a compelling visual representation to your presentation.
See more

Aspect Ratio
16:9Item ID
SKT01629
Features of this template
Other User Cases of the Template:
KPI monitoring, customer satisfaction surveys, risk assessments, performance benchmarks, employee evaluation metrics, project status updates, sales performance tracking, safety audits, financial health indicators, product quality assessment.FAQs
You May Also Like These Presentation Templates


- Free
- Free


- Free
- Free

- Free
- Free
- Free
- Free
- Free
- Free
- Free