Editable Pie Chart For PowerPoint Presentation

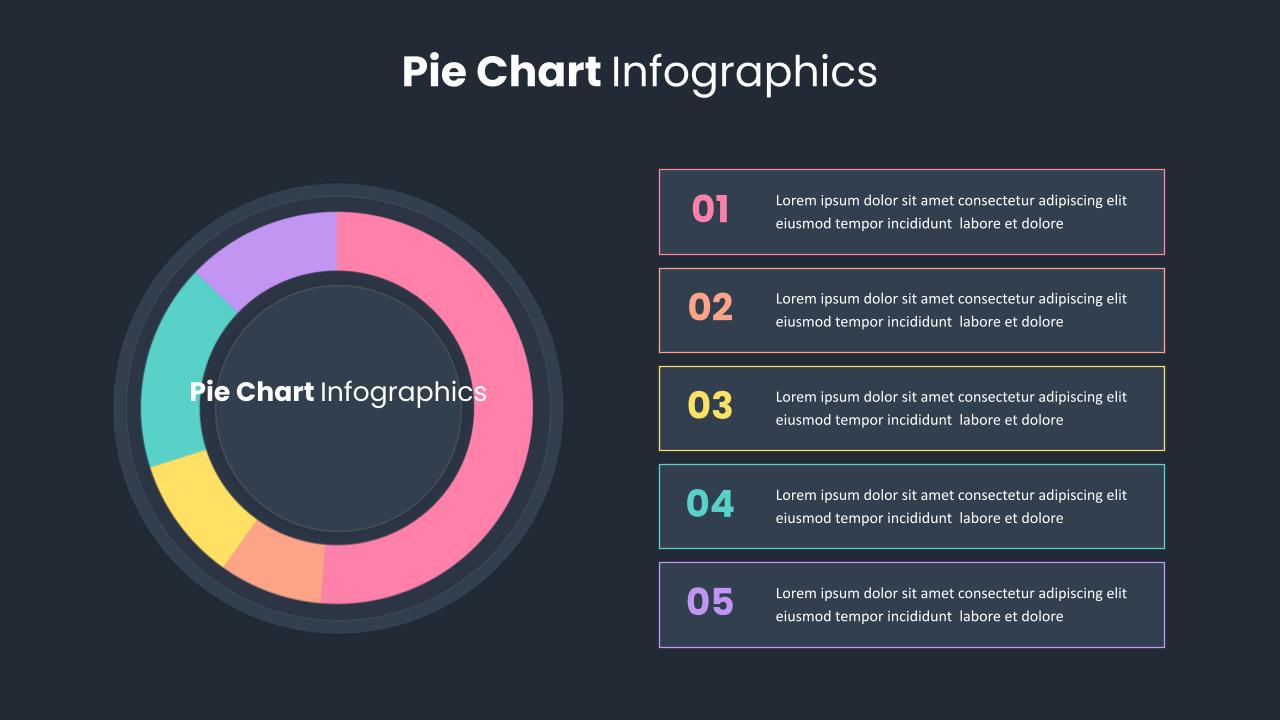

The Editable Pie Chart For PowerPoint Template is a visually engaging and user-friendly design for presenting data in an easy-to-understand format. This pie chart PPT template features a large, circular pie chart segmented into five distinct sections, each represented by a vibrant color. Next to the pie chart, matching text blocks allow for detailed explanations of each segment, making it ideal for showcasing statistics, percentages, or key performance indicators in business, marketing, or educational presentations.
This circle chart PowerPoint template is perfect for illustrating market shares, budget breakdowns, survey results, or any data that can be categorized into parts of a whole. The use of bold, contrasting colors helps to clearly differentiate between sections, ensuring your audience can quickly grasp the key points. Fully customizable in both PowerPoint and Google Slides, the template allows you to easily adjust the colors, labels, and chart data to suit your presentation’s needs. The minimalist design keeps the focus on your content, while the colorful elements add visual appeal and clarity.
Whether you’re creating a financial report, presenting customer feedback, or analyzing business metrics, this pie chart template helps you present data-driven insights in a professional and engaging way.
See more

Aspect Ratio
16:9Item ID
SKT00751
FAQs
You May Also Like These Presentation Templates


- Free
- Free

- Free

- Free

- Free
- Free
- Free
- Free
- Free
- Free
- Free
- Free
- Free