Editable Pie Graph PowerPoint Presentation Template

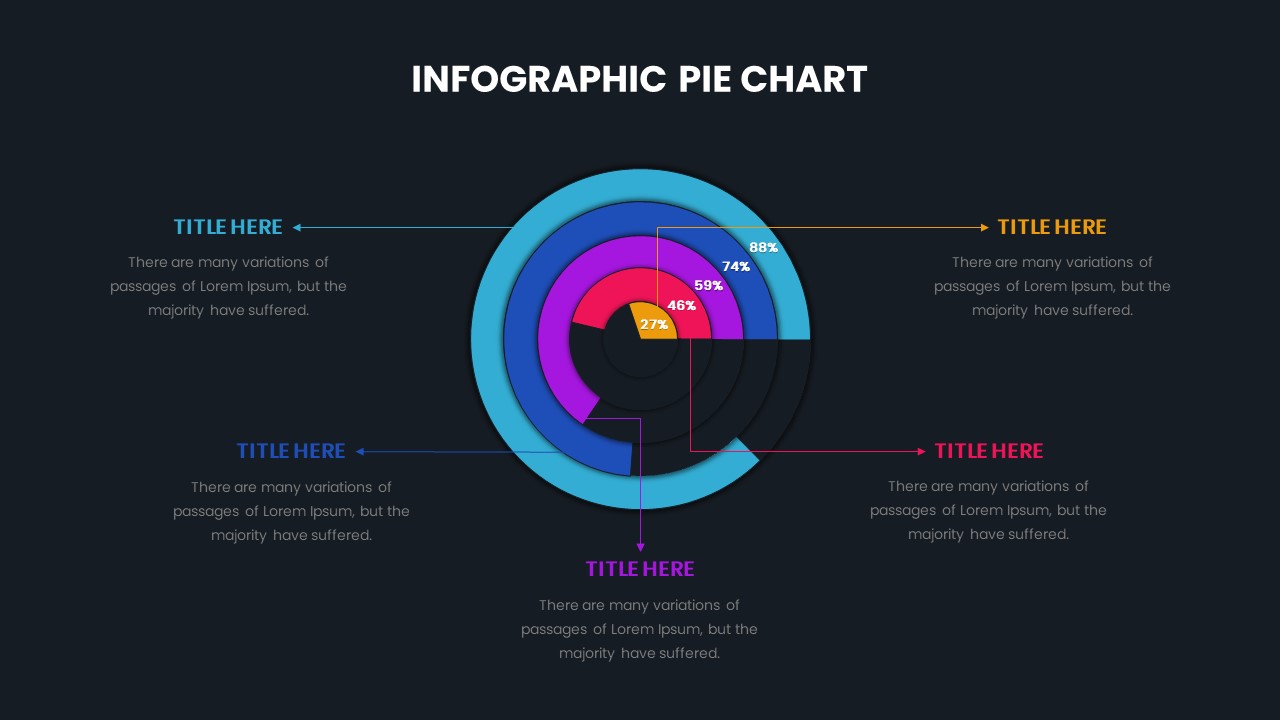
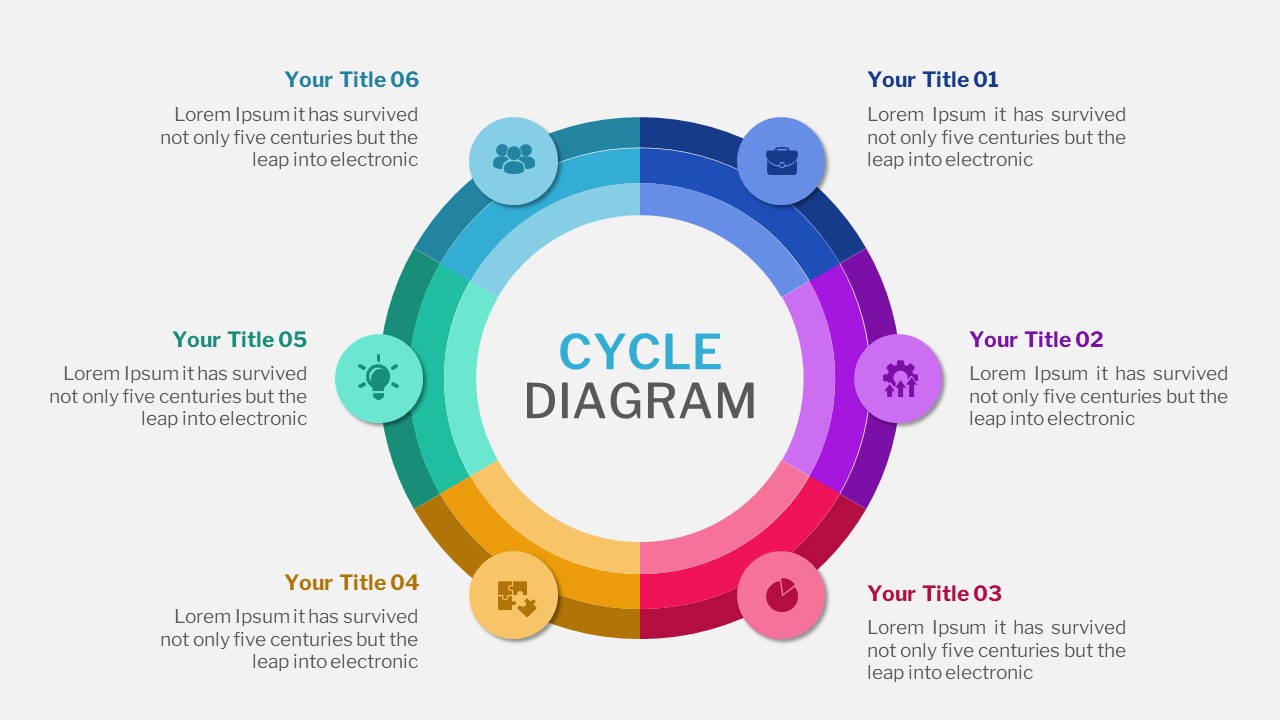
The Infographic Pie Chart Diagram Template offers a visually compelling way to present segmented data through a multi-layered pie chart design. This Pie Graph PowerPoint Presentation template features concentric rings of different colors, each representing a specific percentage or category, making it ideal for displaying complex datasets in a simplified and organized format. With percentage markers displayed prominently on each segment, this infographic-style pie chart allows viewers to quickly grasp the proportion of each category relative to the whole.
The clean, modern circle chart PowerPoint slide layout also includes text placeholders strategically placed around the chart, providing ample room for adding detailed descriptions or key insights related to the data. The color-coded segments enhance readability, making it easy to differentiate between multiple categories. This template is perfect for business presentations, marketing analytics, financial reports, or any scenario that requires data-driven storytelling.
Available in PowerPoint and Google Slides formats, this pie chart template is fully customizable, enabling users to modify colors, text, and data points to fit their presentation needs. Whether you’re presenting sales distribution, market share analysis, or demographic data, this template is designed to convey information effectively while maintaining visual appeal.
See more

Aspect Ratio
16:9Item ID
SKT00673
FAQs
You May Also Like These Presentation Templates


- Free
- Free

- Free

- Free

- Free
- Free
- Free
- Free