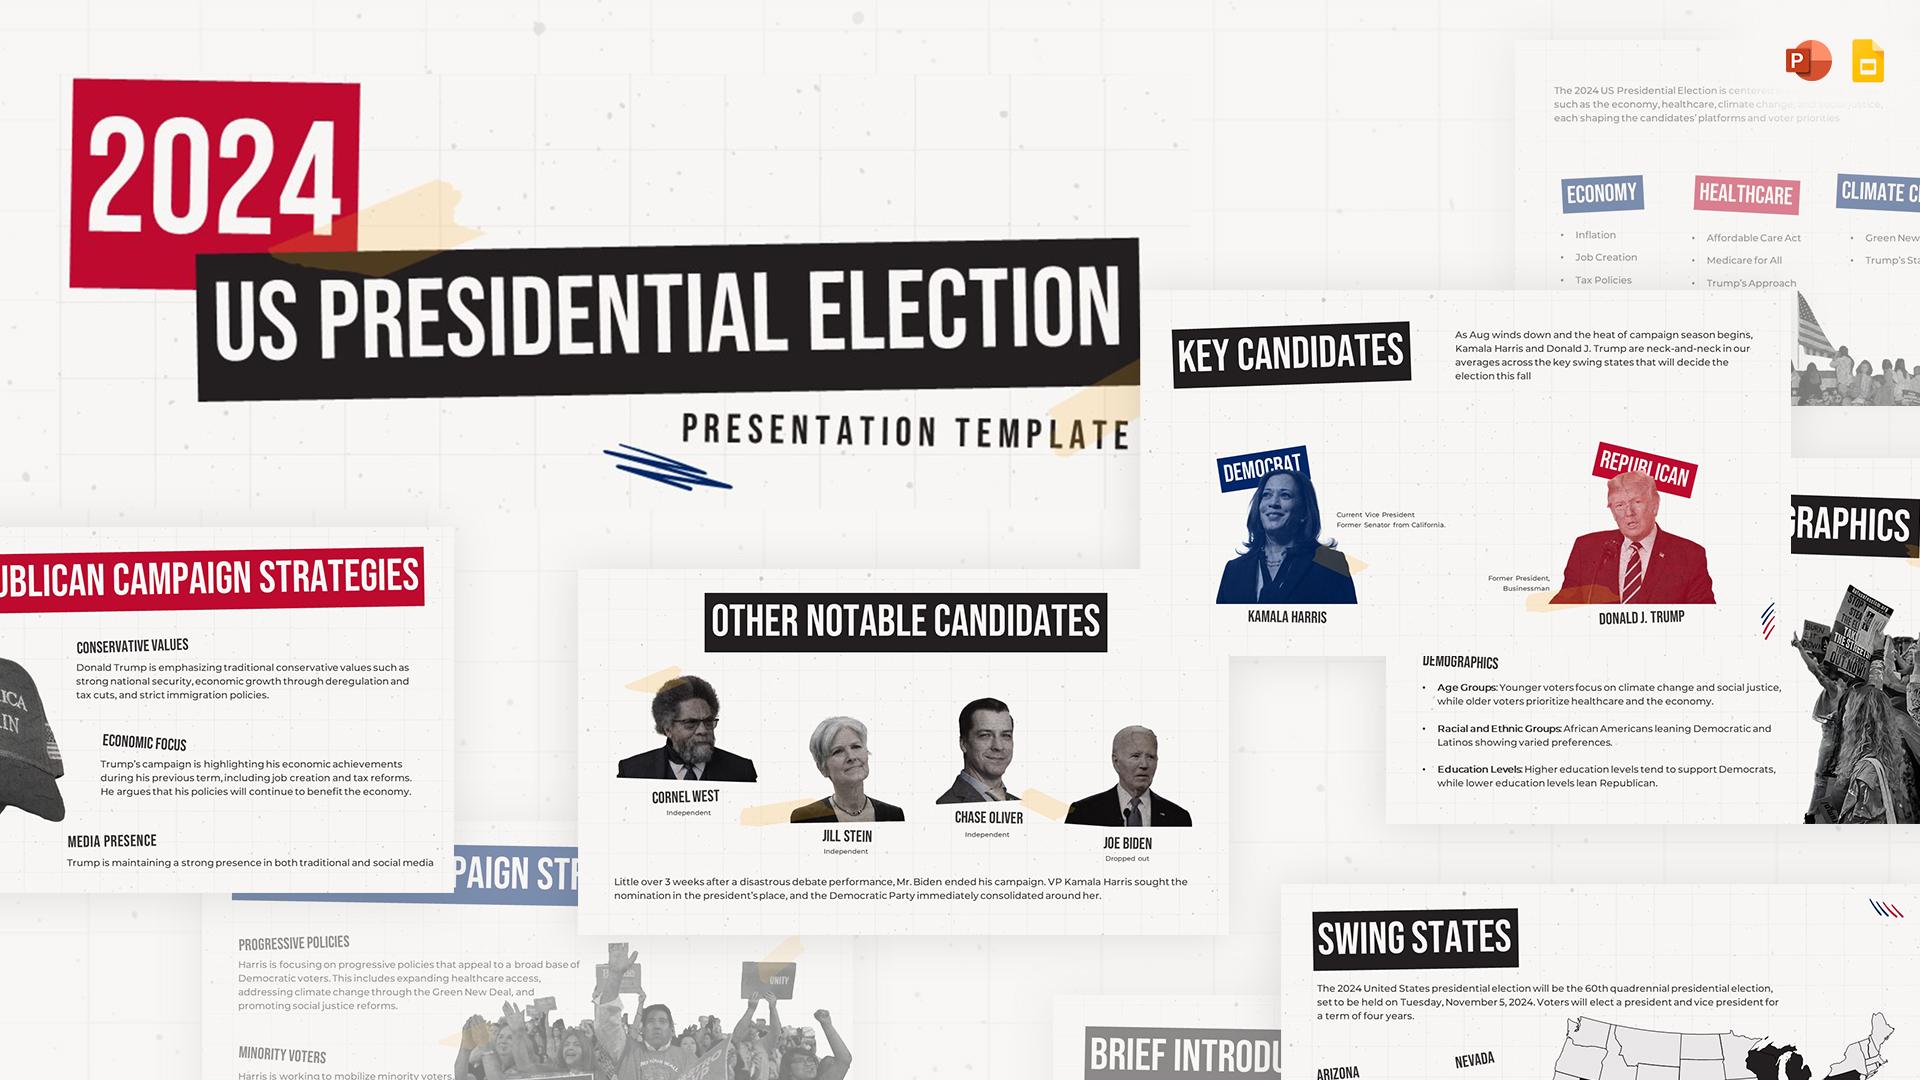
Editable Stock Market Template

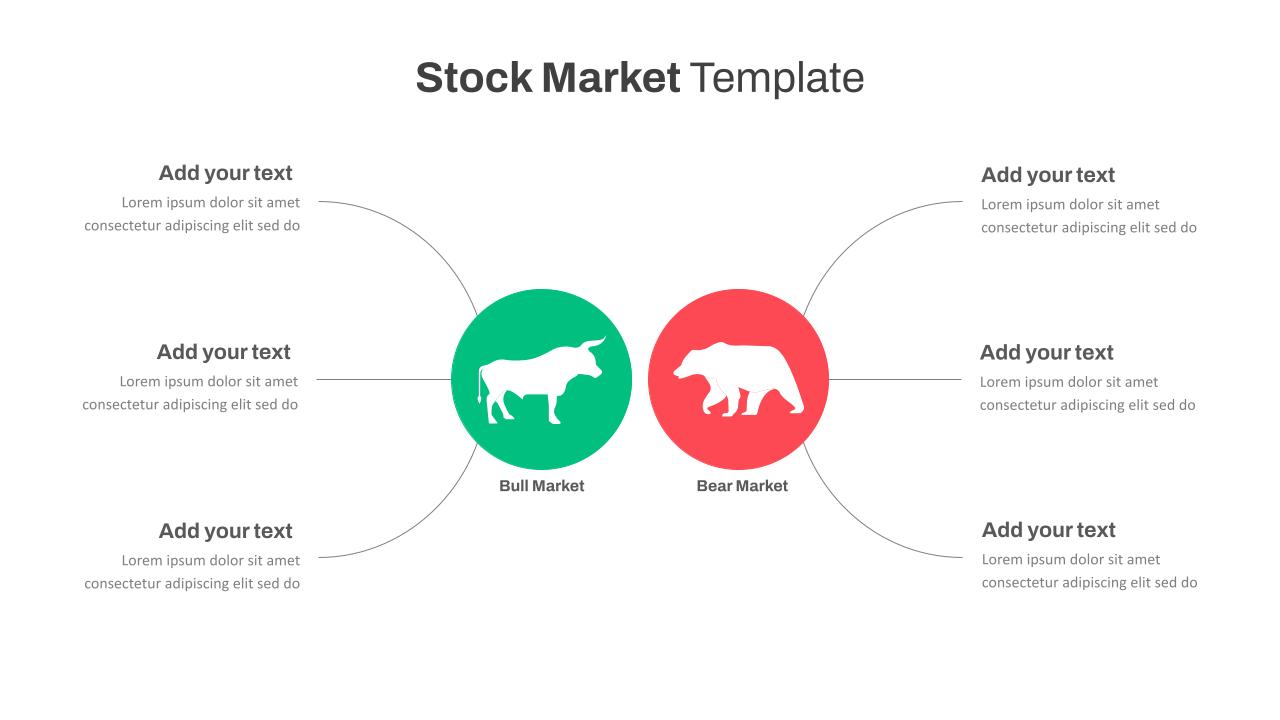
The Stock Market Template is an expertly designed presentation tool tailored for financial analysts, traders, and educators. This template offers a clean and modern layout that simplifies the complex world of stock market analysis, making it accessible for any audience. The Google Slides and Ppt templates for Stock Market features a series of candlestick charts, which are pivotal in illustrating stock price movements and trends over specific periods. These charts are color-coded, with green representing profits and red indicating losses, providing a clear visual differentiation that enhances the comprehension of financial data.
Each slide within the template is structured to facilitate a thorough analysis of market conditions. The inclusion of ‘Buy’ and ‘Sell’ indicators helps presenters guide their audience through the decision-making processes, elucidating the factors that drive these critical actions in the stock market. Accompanying text boxes are strategically placed to provide context and detailed explanations, ensuring that even those with minimal financial background can grasp the presented concepts.
This template is not only ideal for presenting historical data but also for forecasting and strategizing future market moves. Its versatile design allows for customization to fit specific presentation needs, whether it’s for a corporate meeting, an educational seminar, or a client briefing. The Stock Market Template is an essential tool for anyone looking to communicate financial information effectively and professionally.
See more

Aspect Ratio
16:9Item ID
SKT00949
Features of this template
Other Use Cases of the Template:
financial reports, investment strategy meetings, market trend analysis, corporate financial briefings, educational workshops, client investment presentations, trading seminars, quarterly earnings reports, market forecasting, portfolio performance reviews.FAQs
You May Also Like These Presentation Templates


- Free
- Free


- Free
- Free
- Free
- Free
- Free
- Free
- Free

- Free
- Free