Waterfall Chart PPT and Google Slides

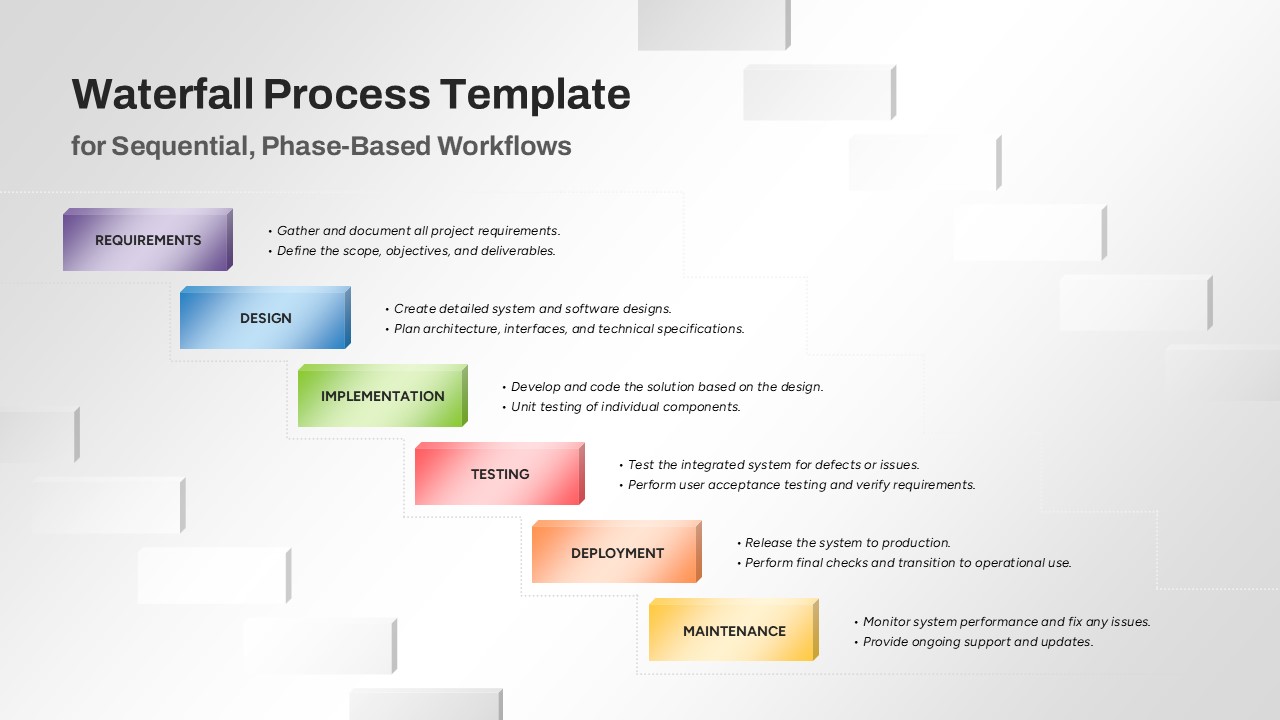
The Waterfall Chart PPT Template is an essential tool for businesses and professionals who want to visualize complex data trends in an intuitive and engaging way. This waterfall PowerPoint slide template is designed with clarity in mind, allowing users to showcase increases, decreases, and totals over time, making it ideal for financial analysis, performance reviews, and project evaluations.
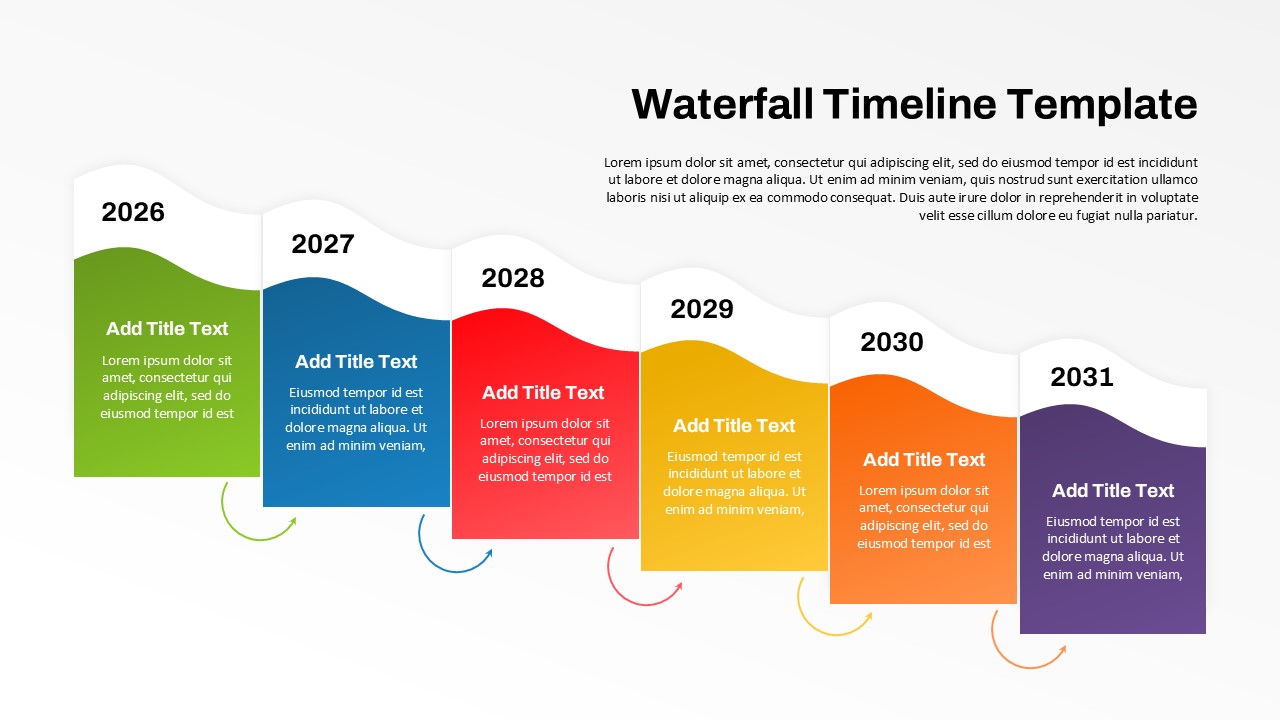
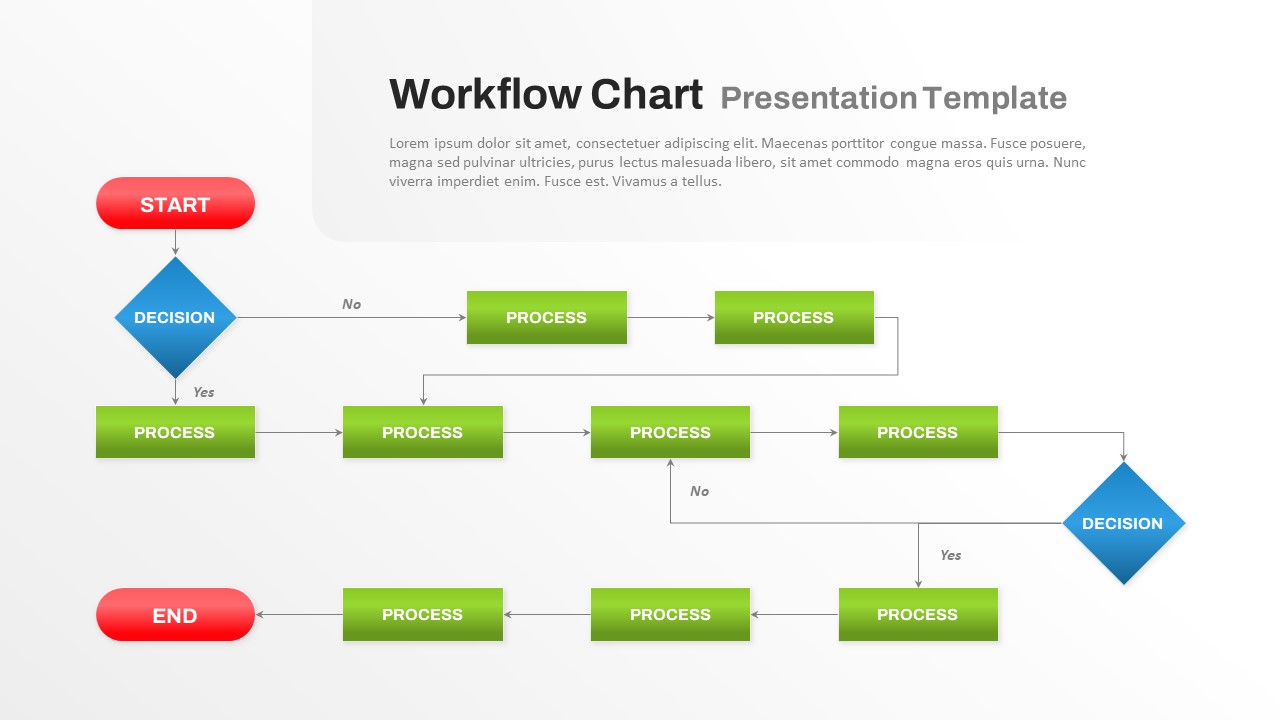
This template features clean, color-coded bars, with green for totals, red for increases, and yellow for decreases, ensuring that data variations are easy to interpret at a glance. Whether you’re presenting annual financial results, tracking sales progress, or breaking down expense management, the Waterfall Chart offers a clear, step-by-step visual representation of changes within a dataset. The sidebar provides additional space for detailed explanations, making it easier to narrate the story behind the numbers.
Available for both PowerPoint and Google Slides, this template is fully customizable. You can easily modify data points, adjust colors to match your branding, and update the text to fit the context of your presentation. With its modern and professional design, this Waterfall Chart Template helps you communicate key data insights effectively, boosting the overall impact of your presentation. Download Now!
See more

Aspect Ratio
16:9Item ID
SKT01655
Features of this template
Other User Cases of the Template:
Financial performance analysis, quarterly business reviews, expense breakdowns, project milestone tracking, sales performance reports, cost-benefit analysis, cash flow analysis, revenue growth presentations, budget vs. actual comparisons, operational efficiency reports.FAQs
You May Also Like These Presentation Templates


- Free
- Free


- Free
- Free

- Free
- Free
- Free
- Free
- Free