8-Circle Venn Diagram Template for PPT and Google Slides
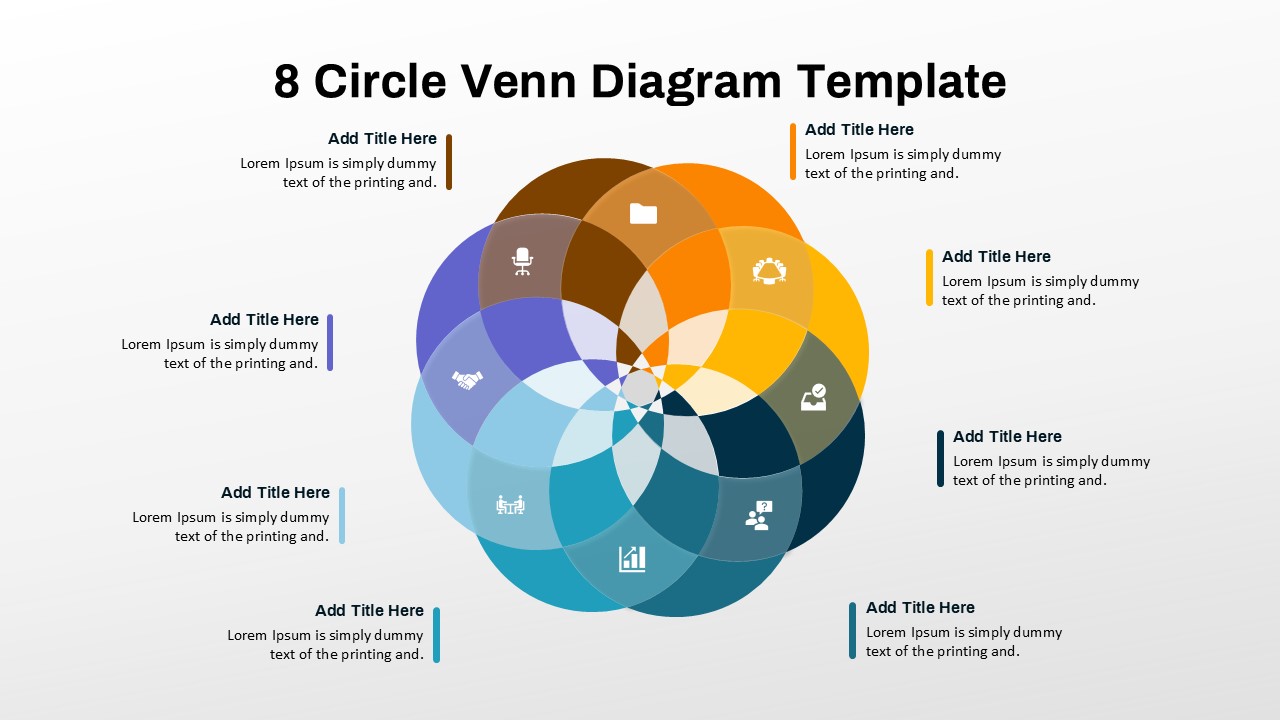
Enhance your data visualization and comparative analysis with the 8-Circle Venn diagram template for PPT and Google Slides. This unique and visually engaging diagram is designed to illustrate complex relationships, overlapping factors, and interconnected concepts in a clear and structured manner.
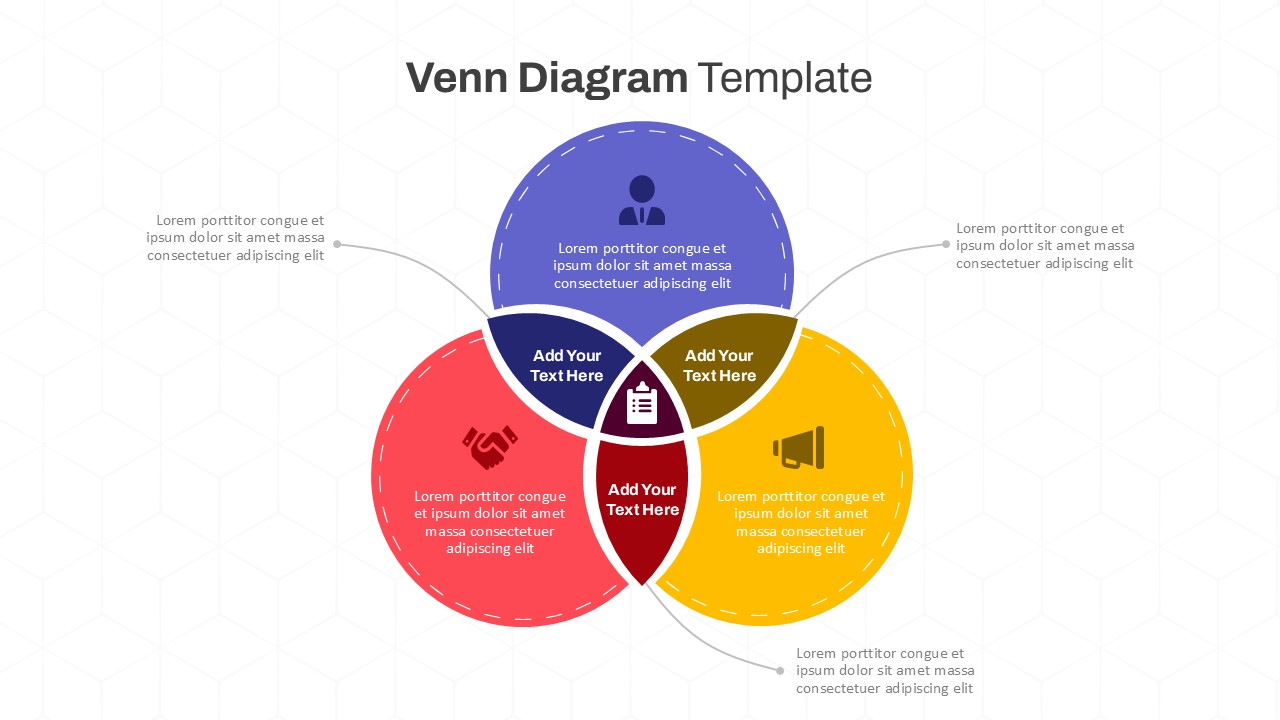
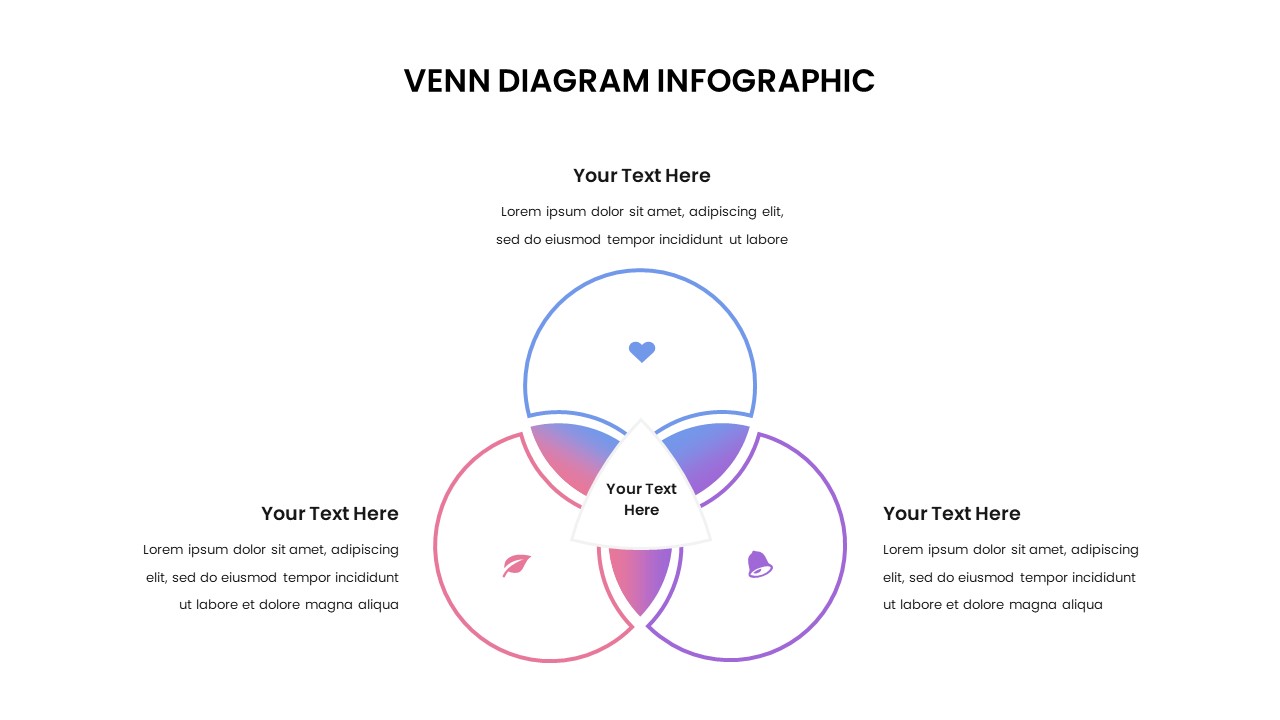
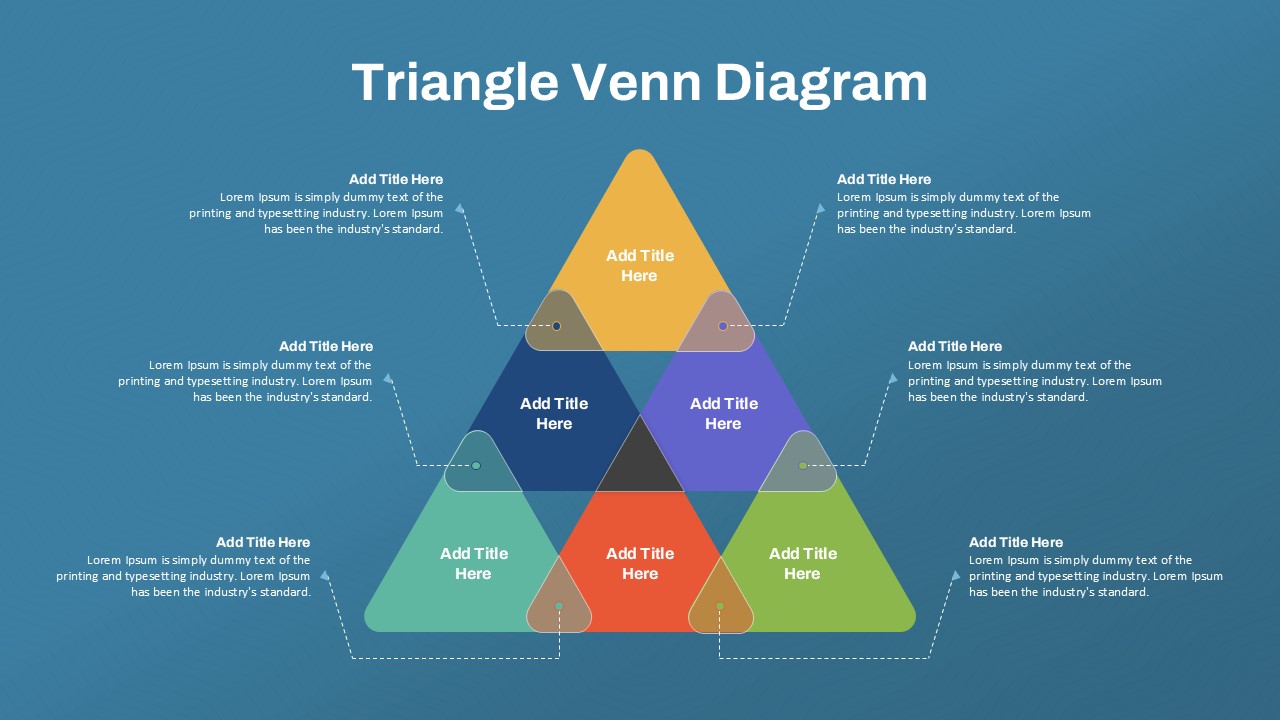
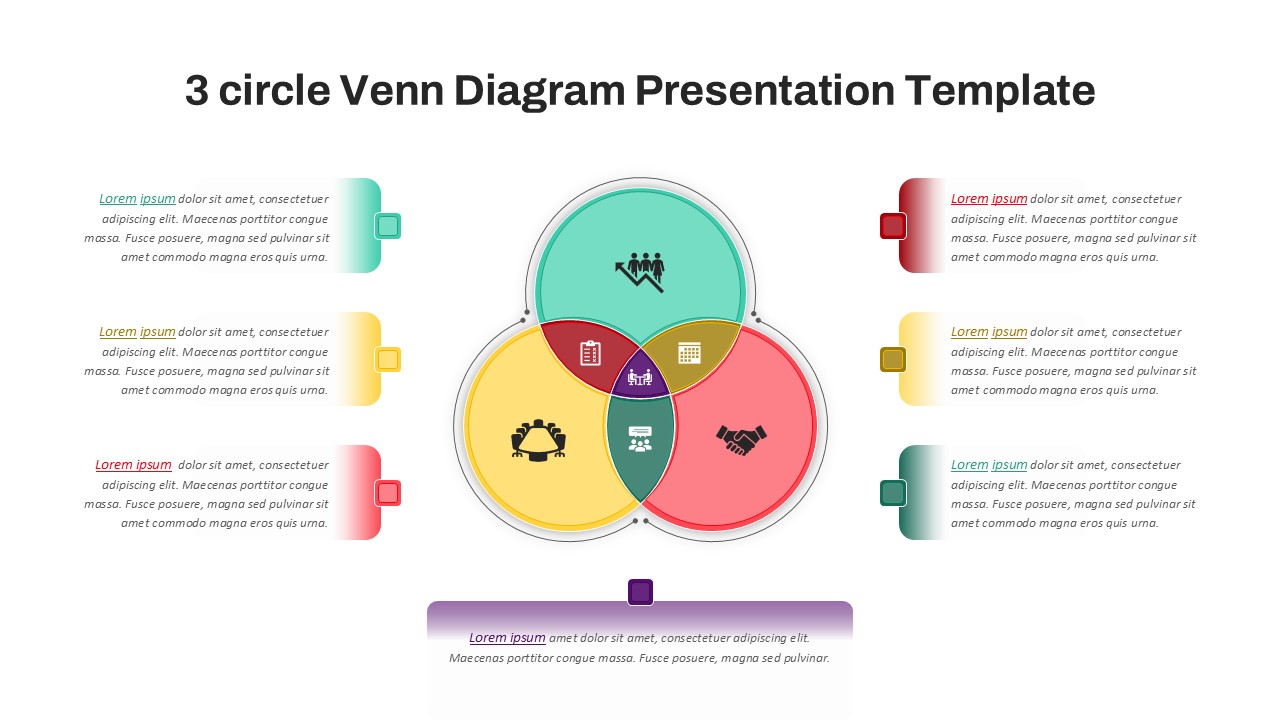
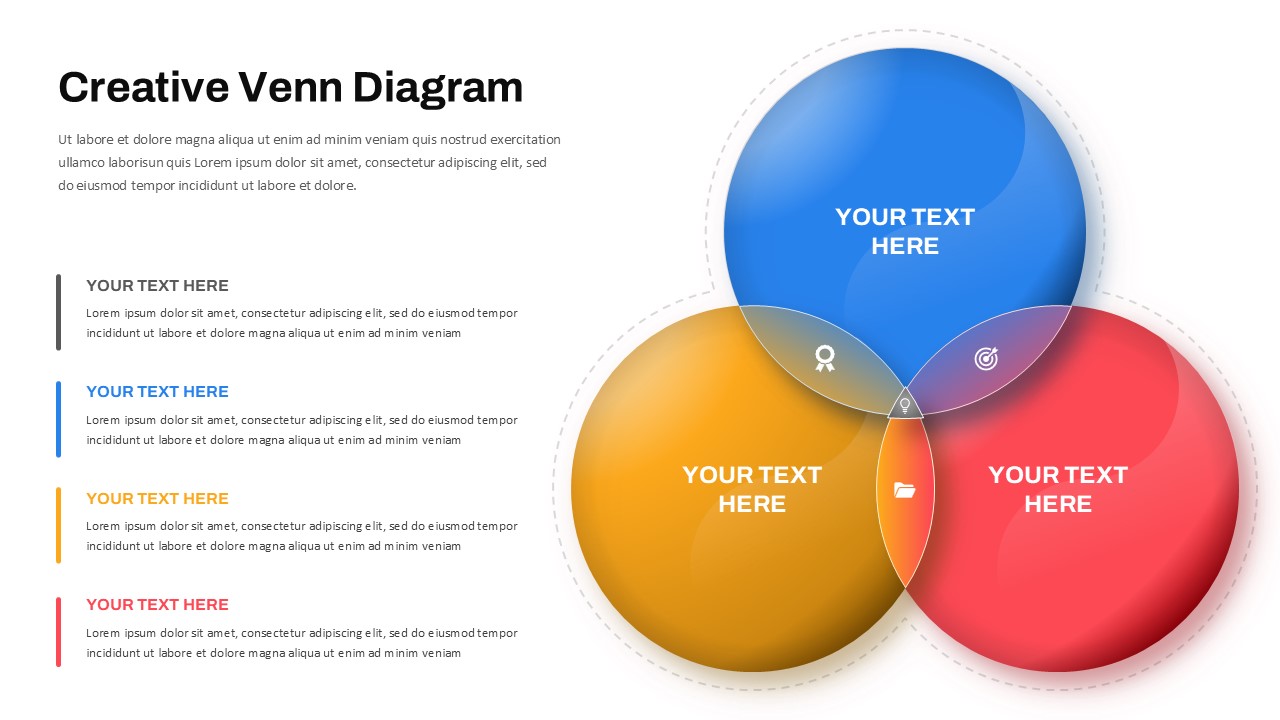
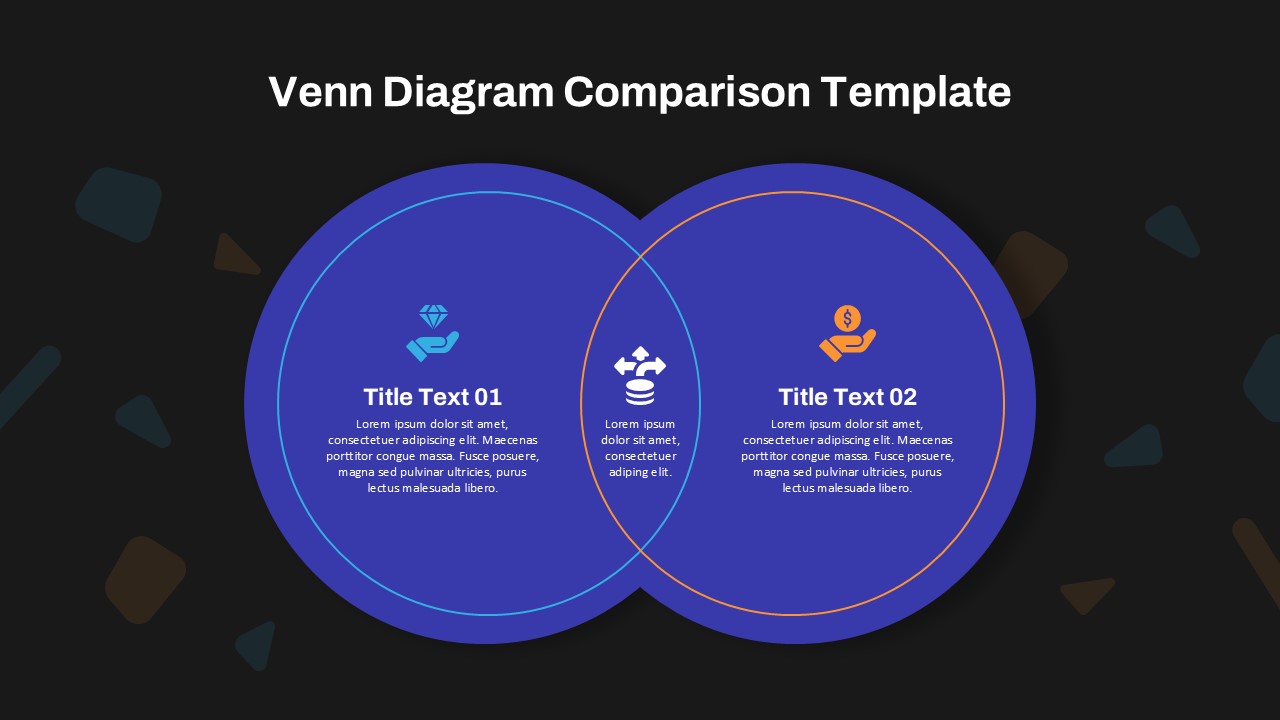
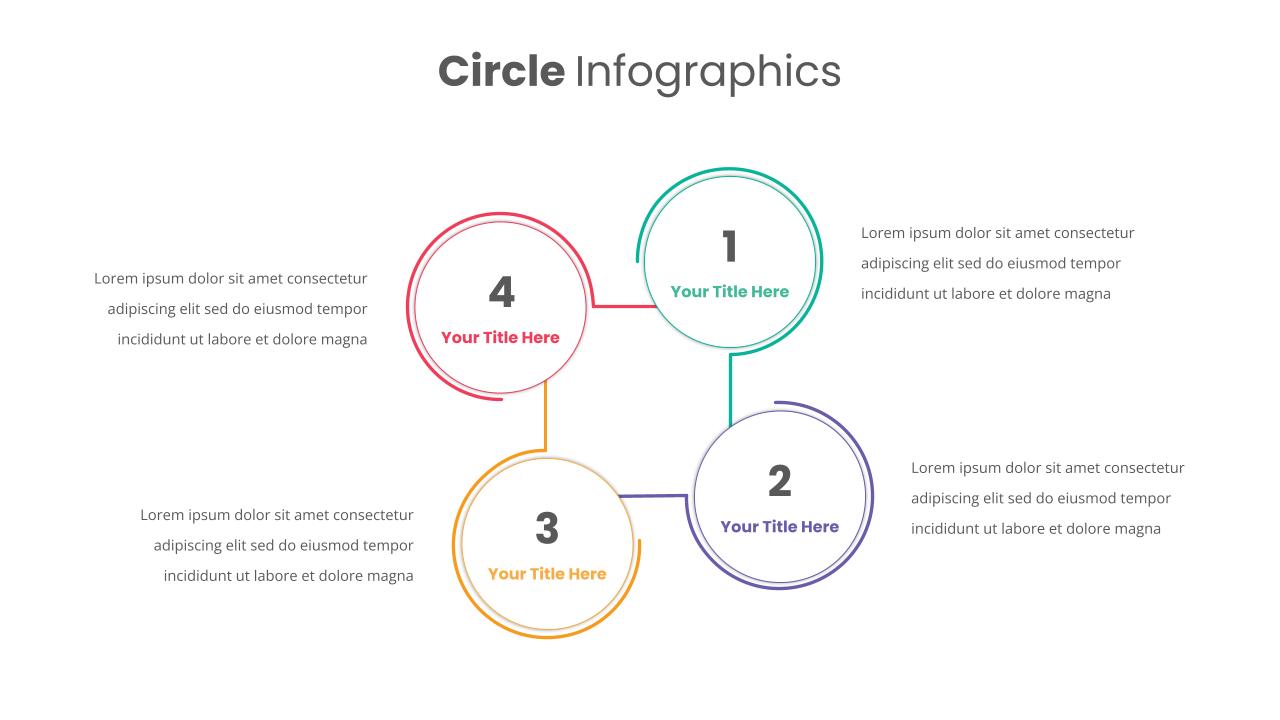
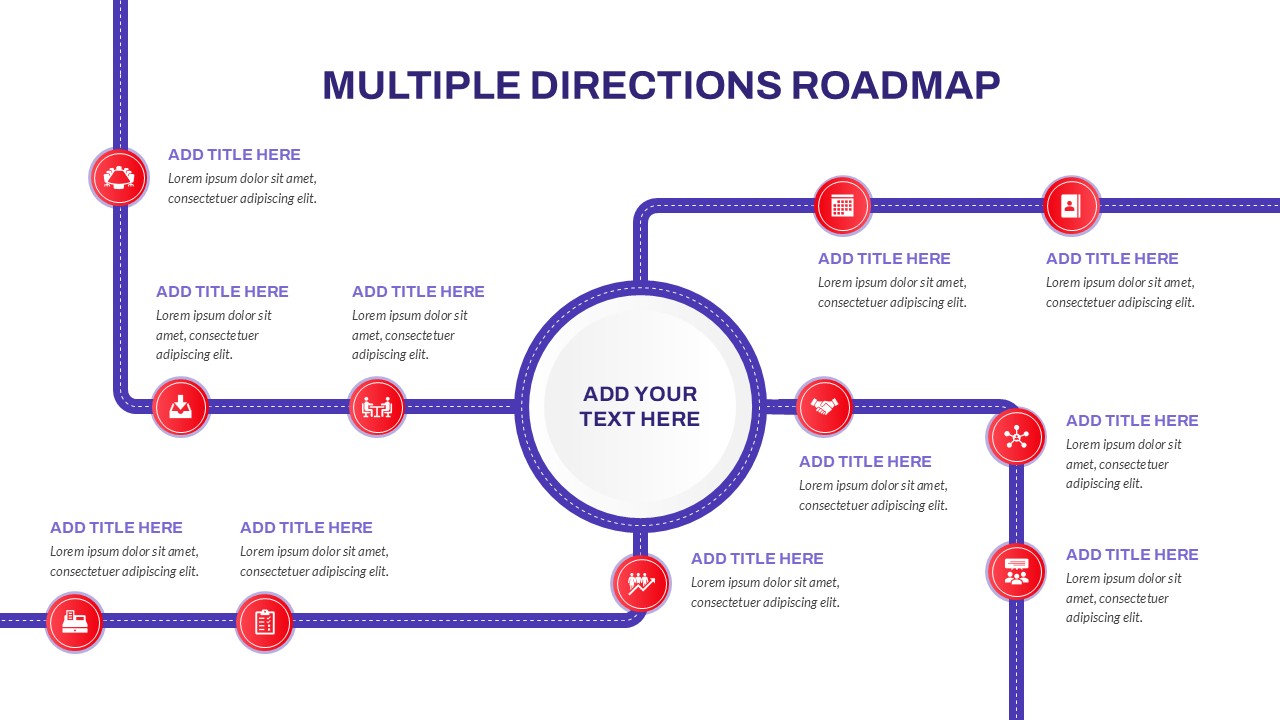
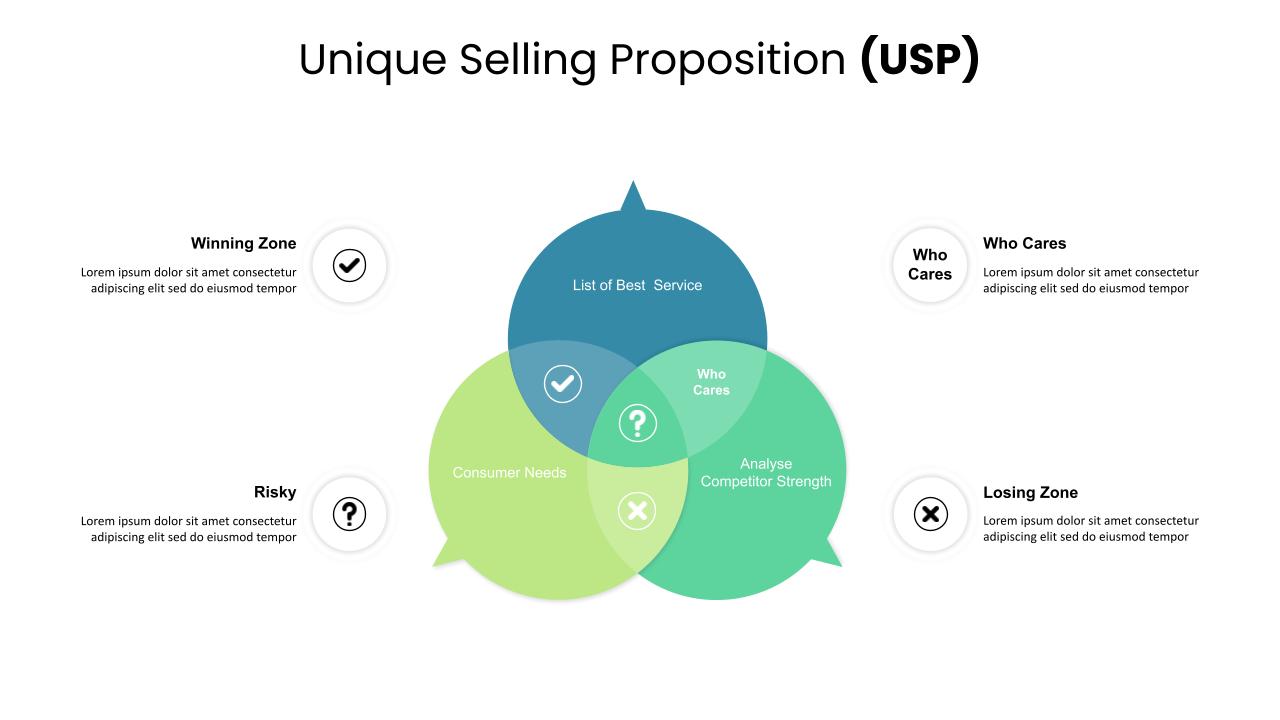
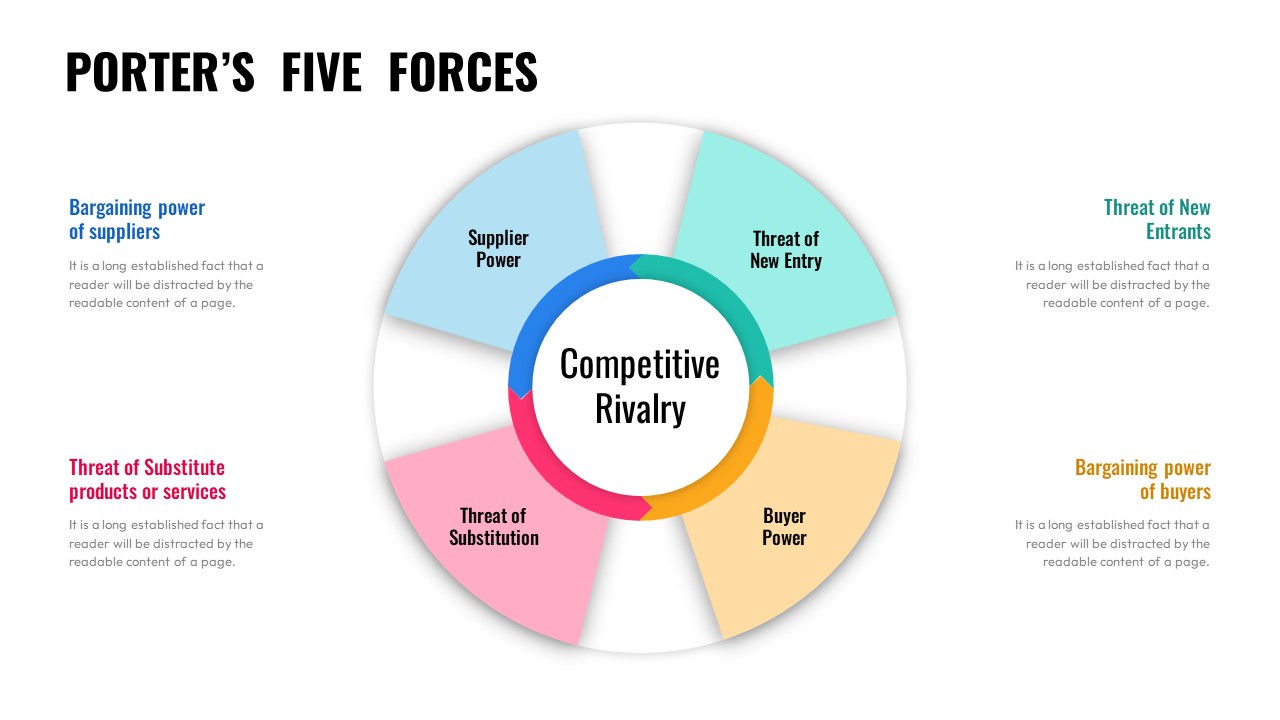
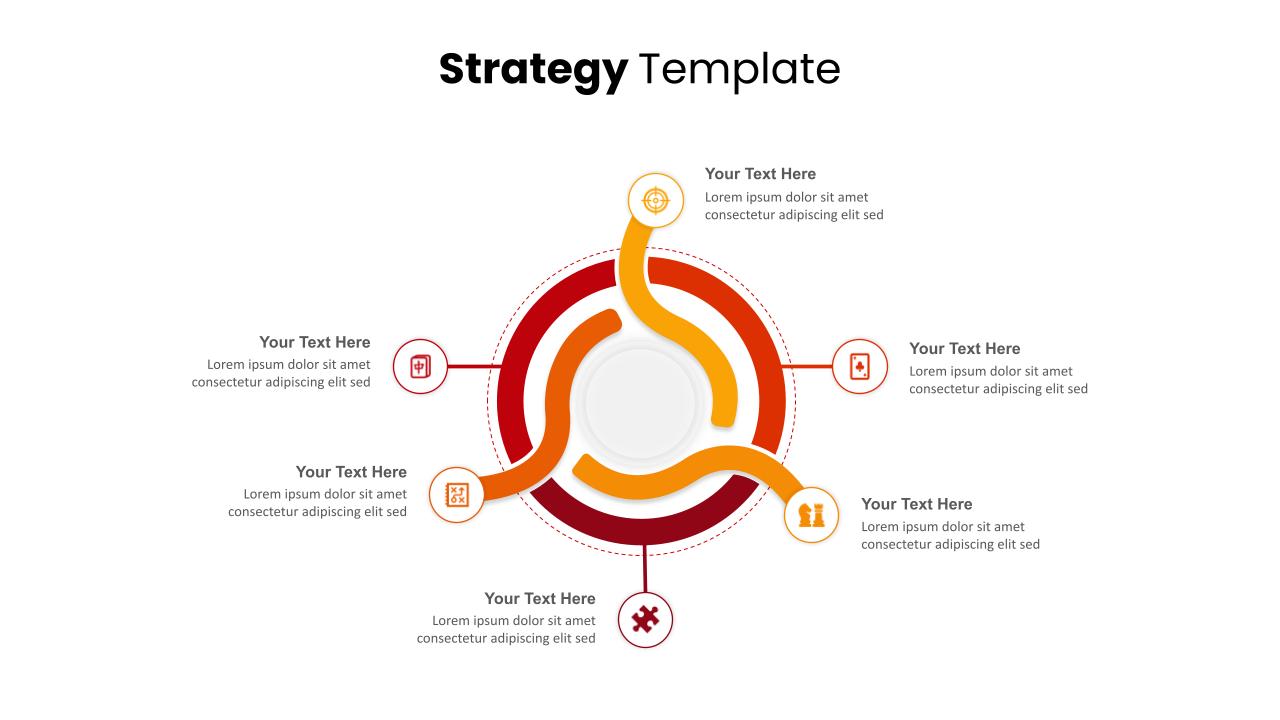
This venn diagram slide template features eight interlinked circles, each color-coded for differentiation, forming a visually appealing central intersection that highlights shared attributes among multiple categories. It includes icons and placeholders for adding descriptions, making it an excellent tool for showcasing business strategies, market segmentation, organizational structures, or research findings.
Perfect for business professionals, analysts, educators, and strategists, this template is versatile and applicable for presentations requiring in-depth comparison, such as competitive analysis, process optimization, decision-making frameworks, and multi-faceted problem-solving. Its clean, modern design ensures that your audience can easily interpret data while maintaining engagement.
Fully customizable and compatible with PowerPoint and Google Slides, this template allows you to adjust colors, text, and icons to fit your brand or presentation needs. Whether for corporate meetings, academic discussions, marketing strategies, or brainstorming sessions, this 8-Circle Venn Diagram provides a structured and impactful way to present complex ideas with clarity.
See more

Aspect Ratio
16:9Item ID
SKT03324
Features of this template
Other Use Cases of the Template:
Competitive analysis, strategic business planning, market segmentation, process improvement models, decision-making frameworks, academic research, brainstorming sessions, organizational structure analysis.
FAQs
You May Also Like These Presentation Templates


- Free
- Free


- Free

- Free
- Free
- Free
- Free