Filtering Process Flow in PPT and Google Slides Template

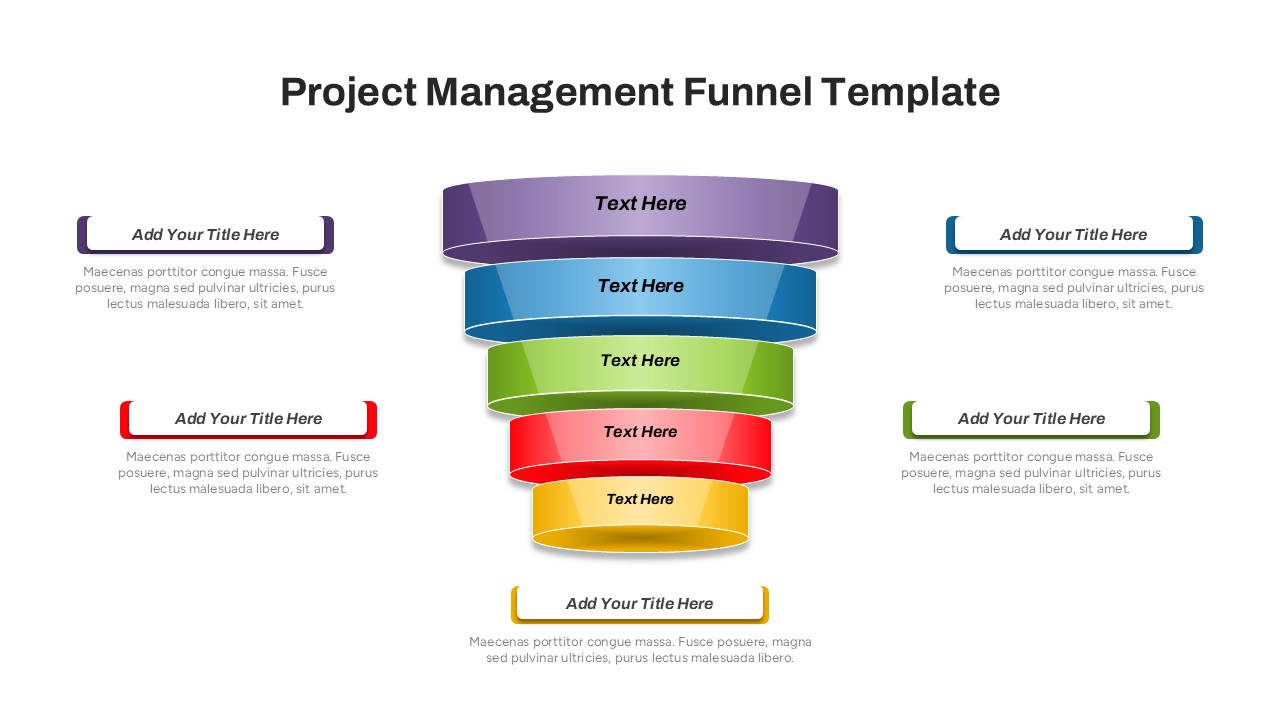
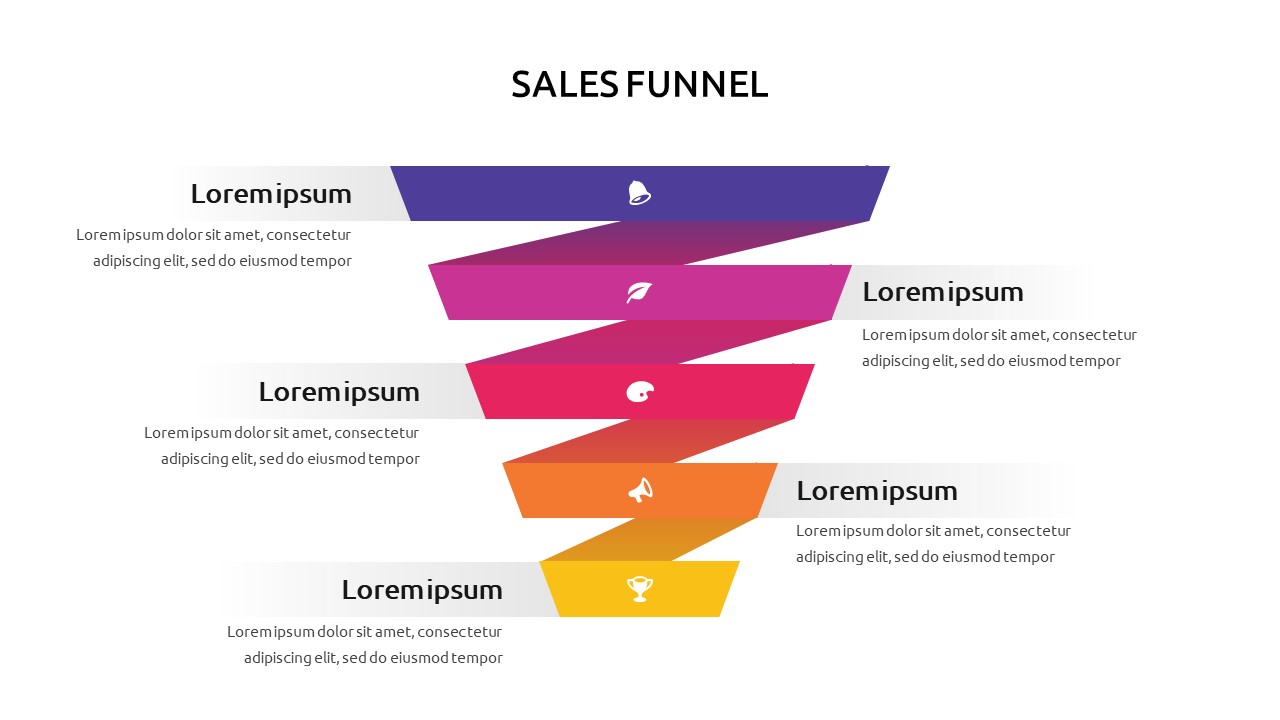
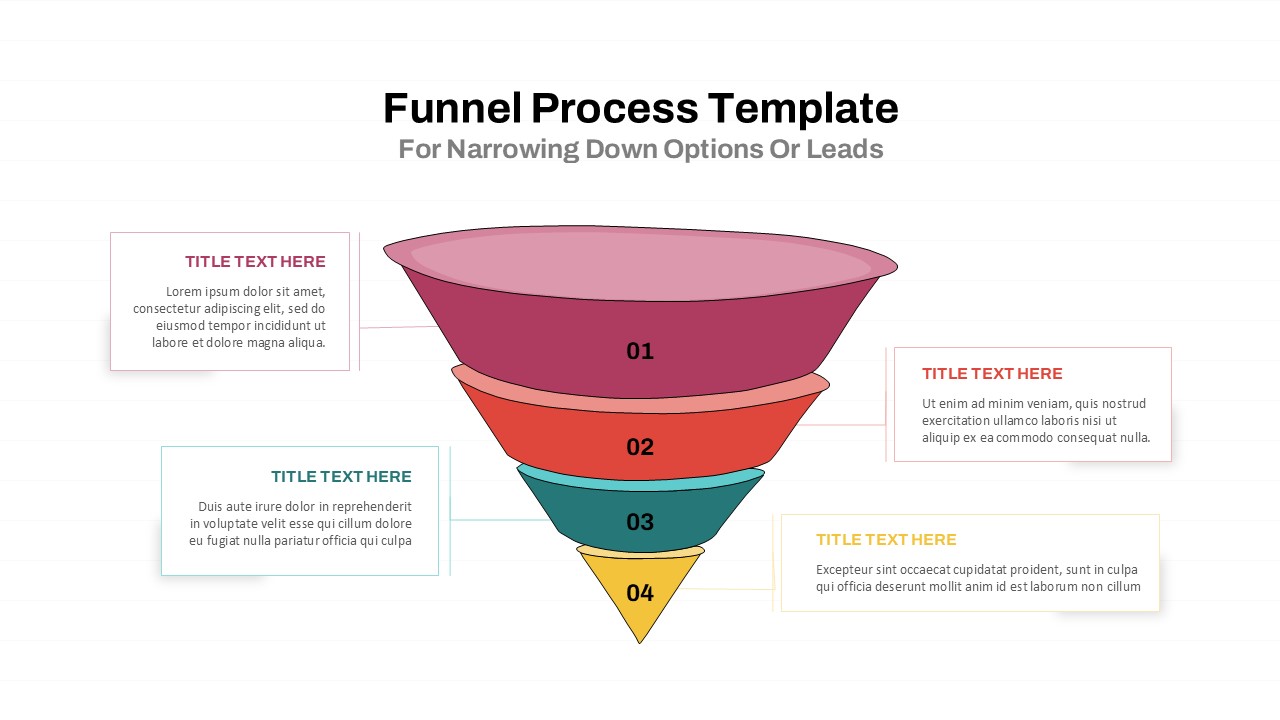
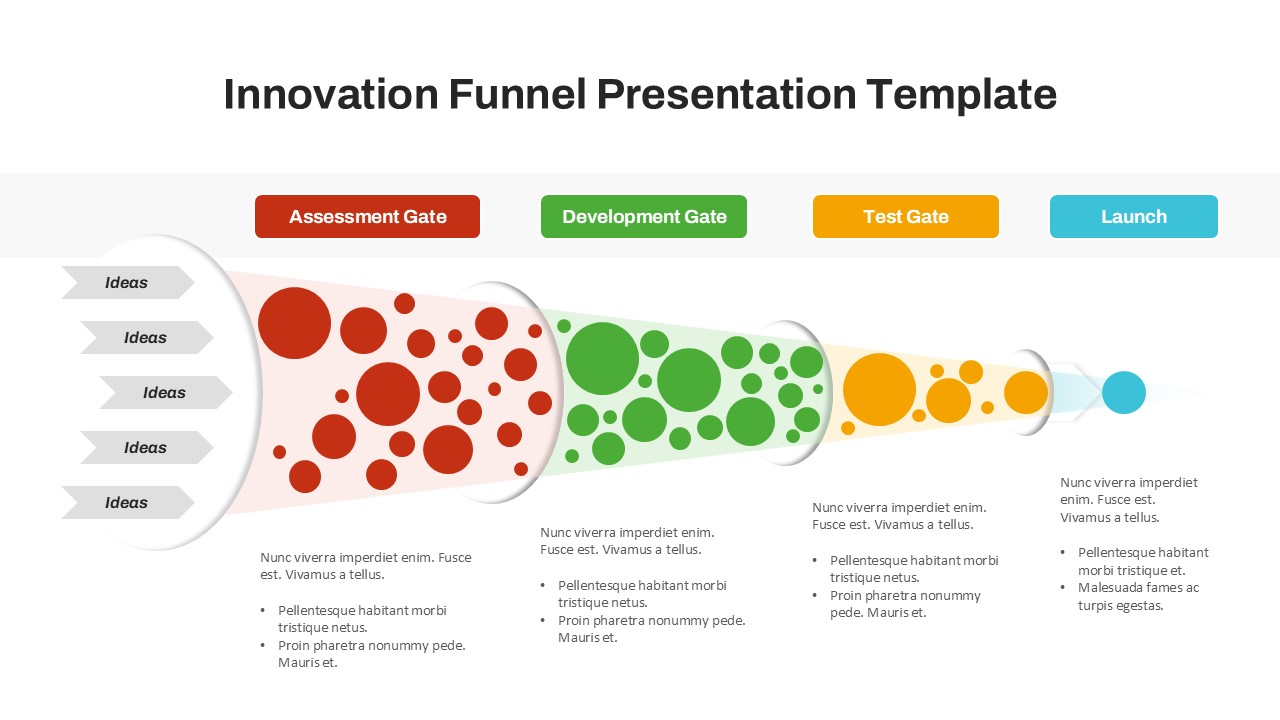
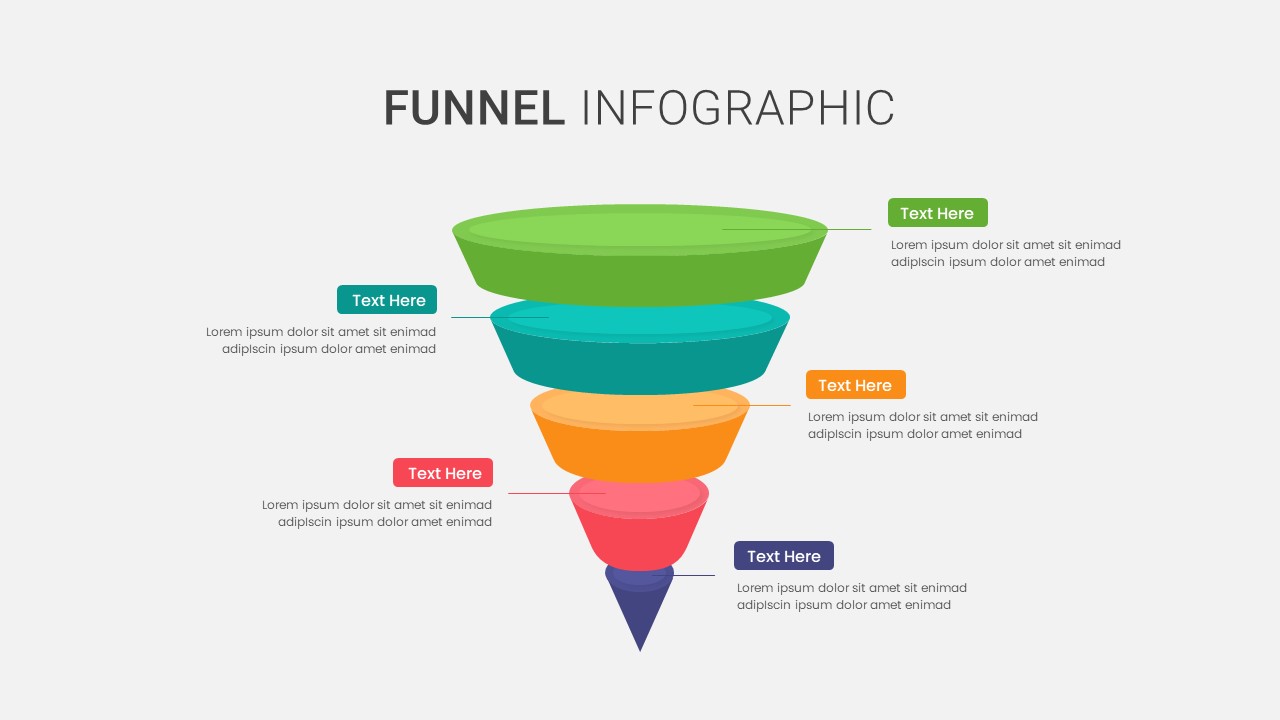
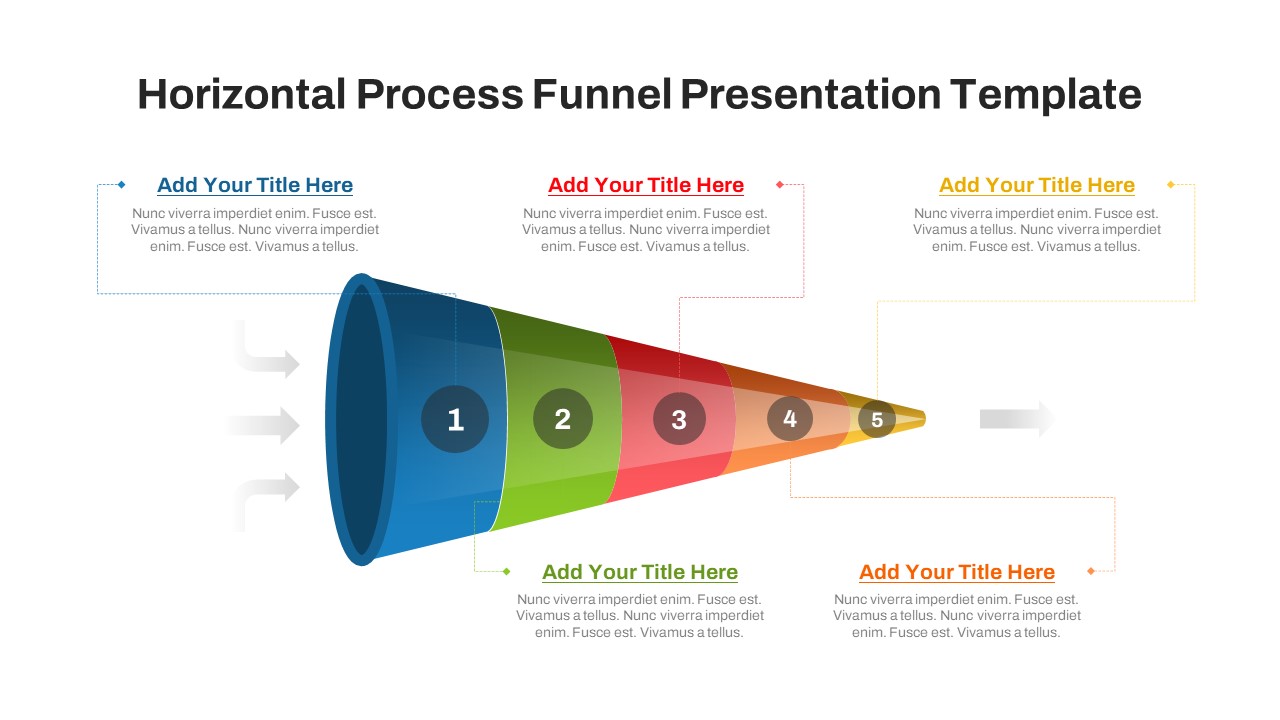
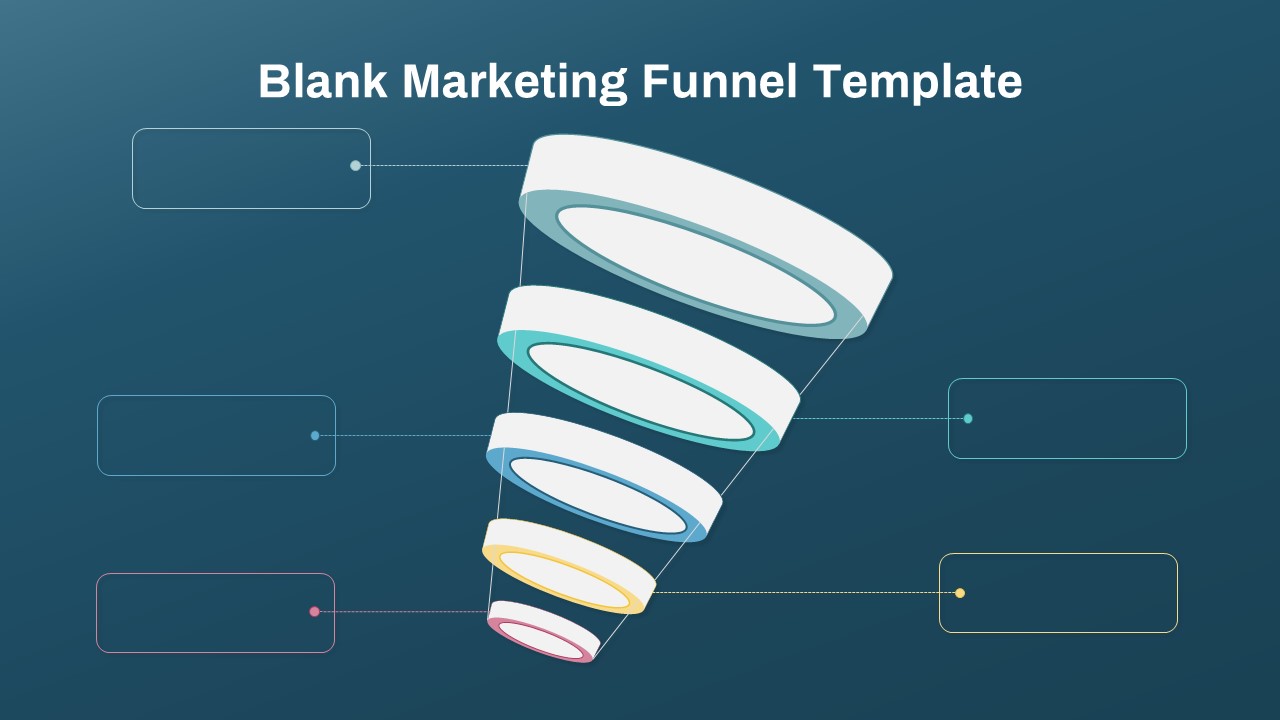
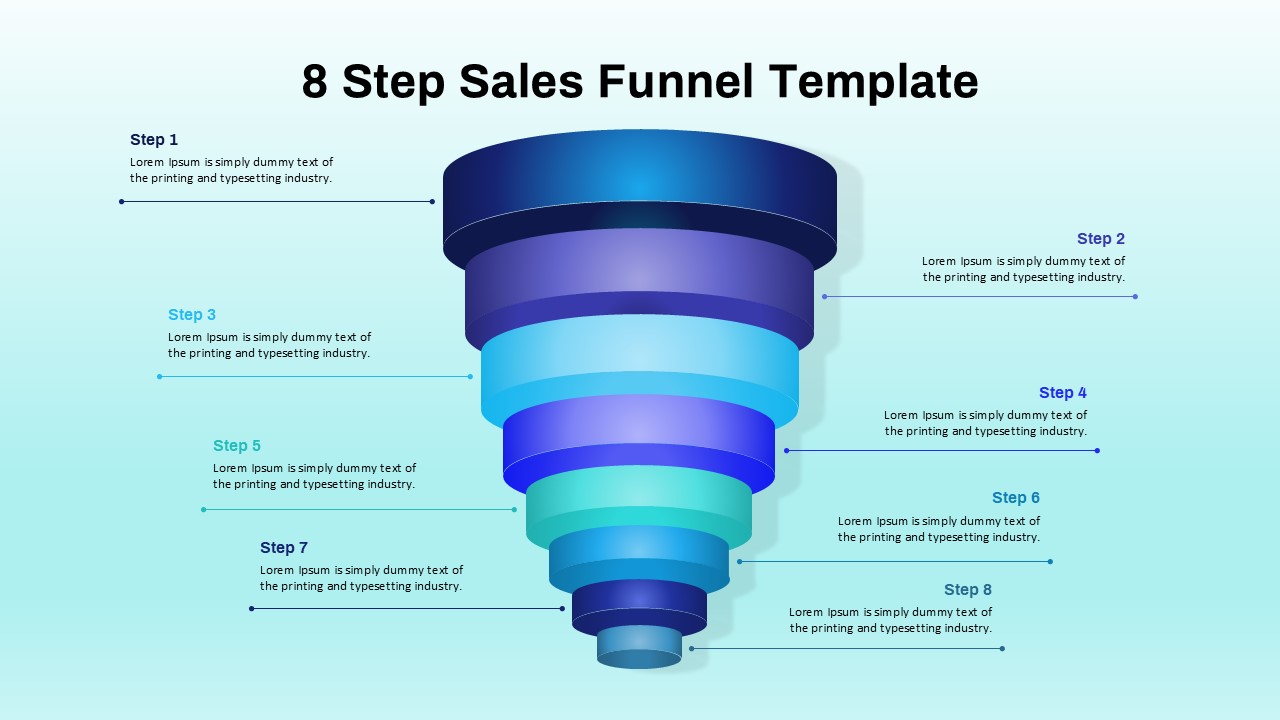
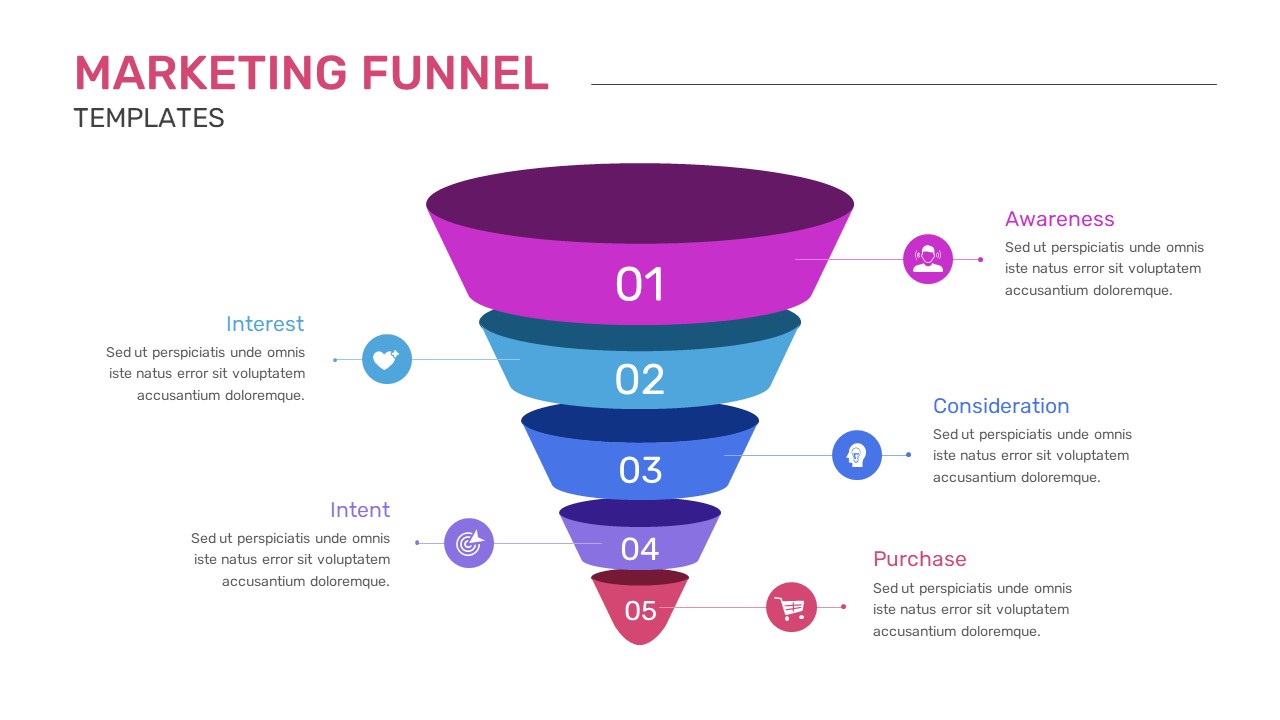
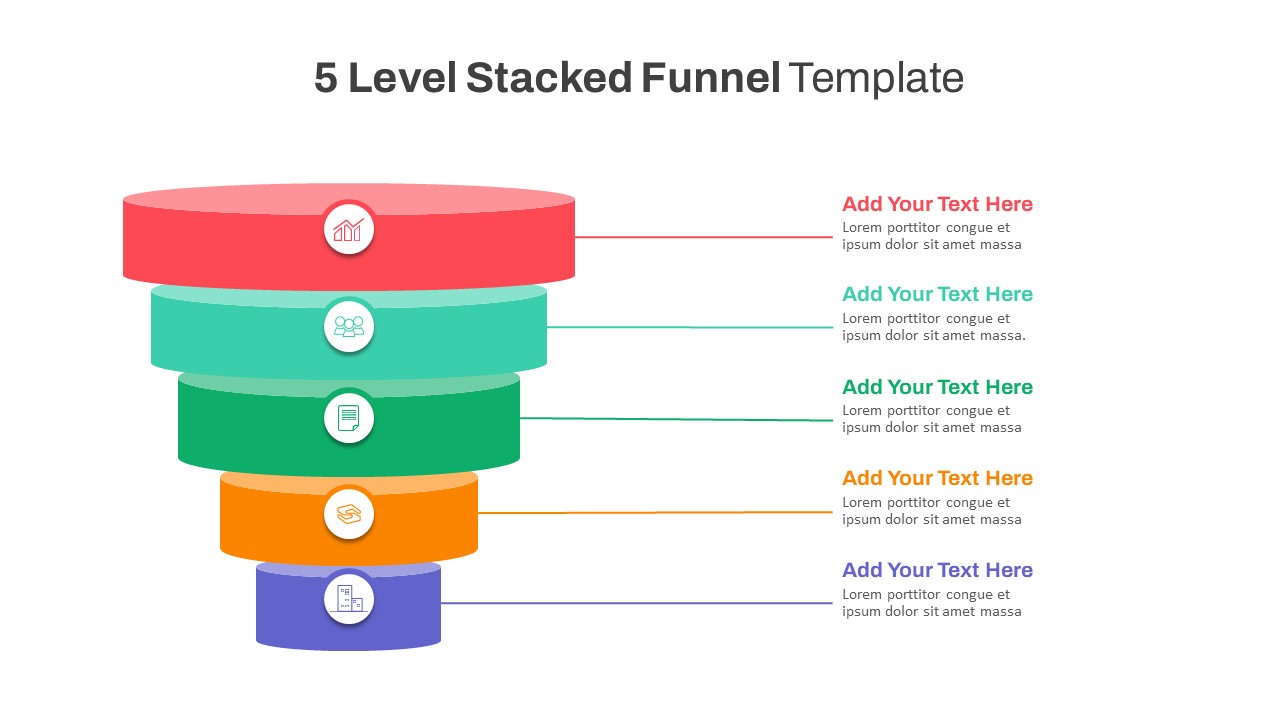
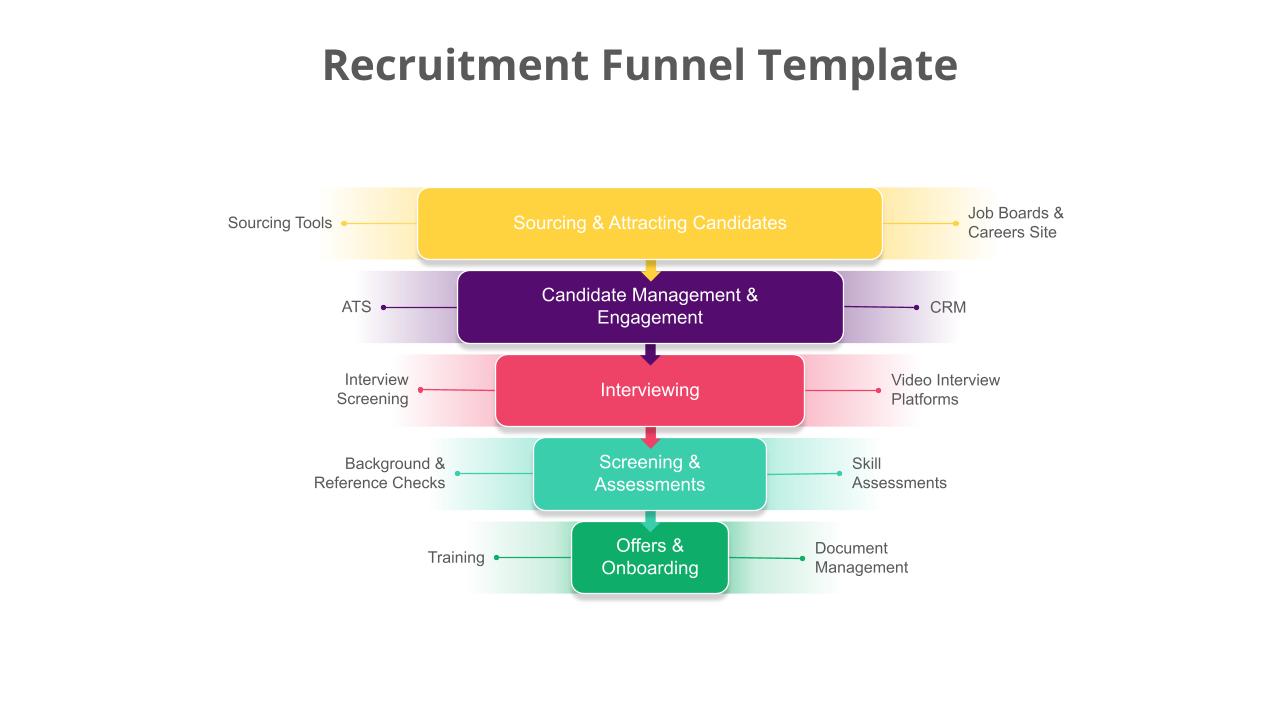
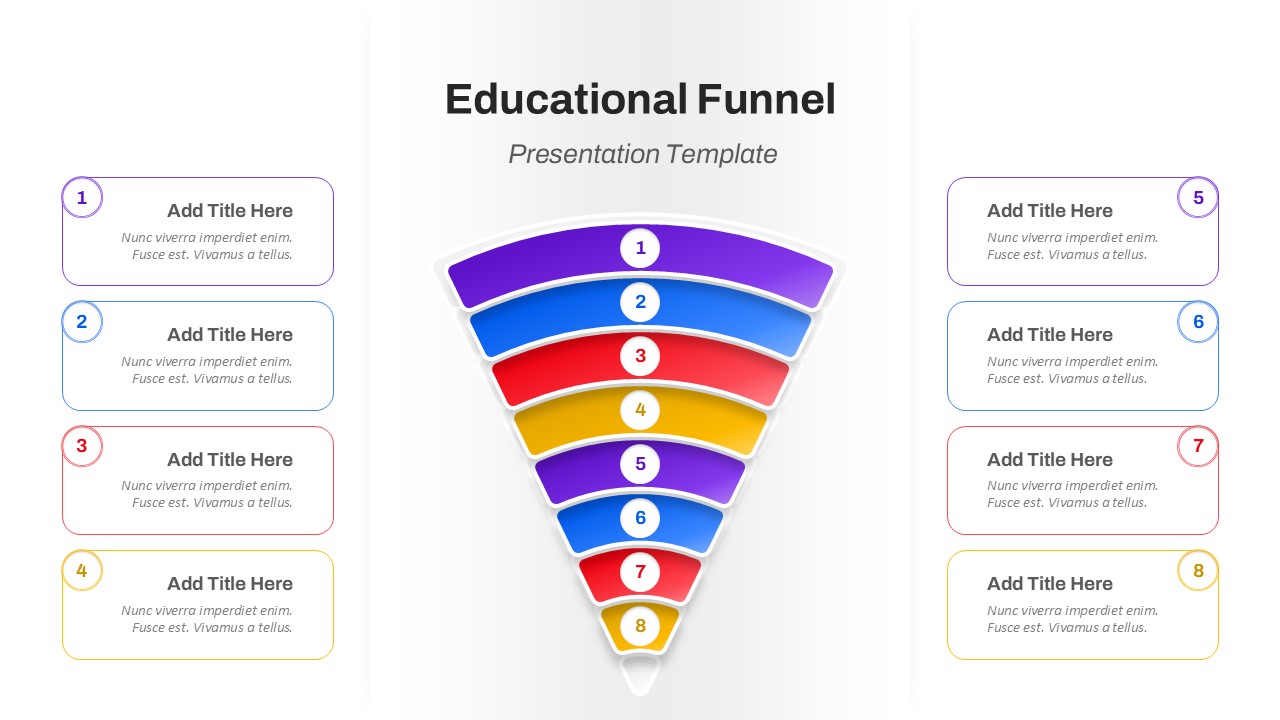
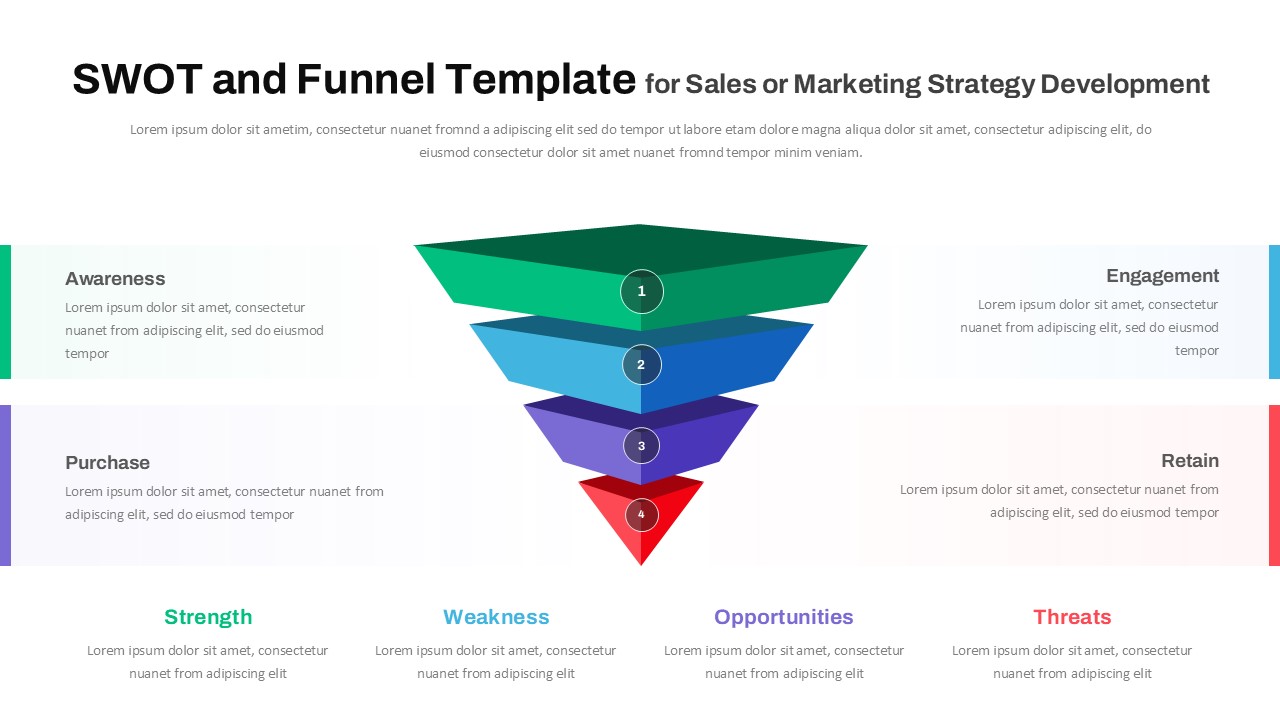
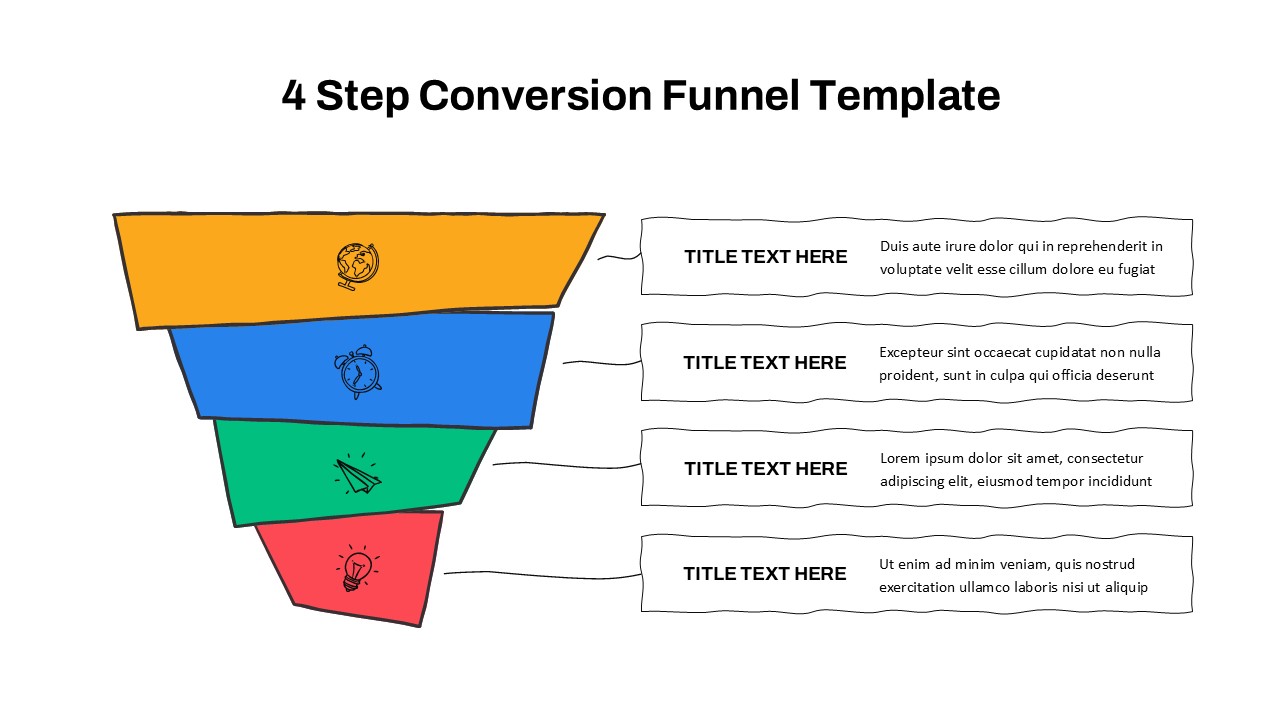
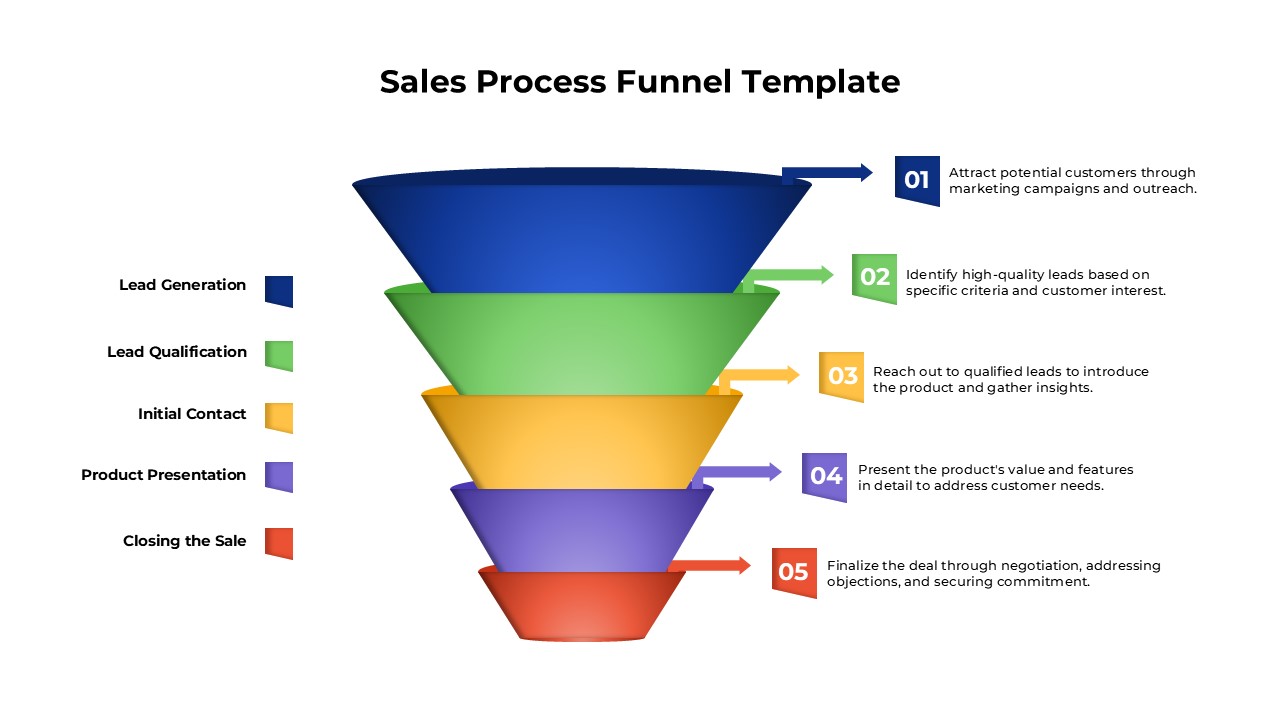
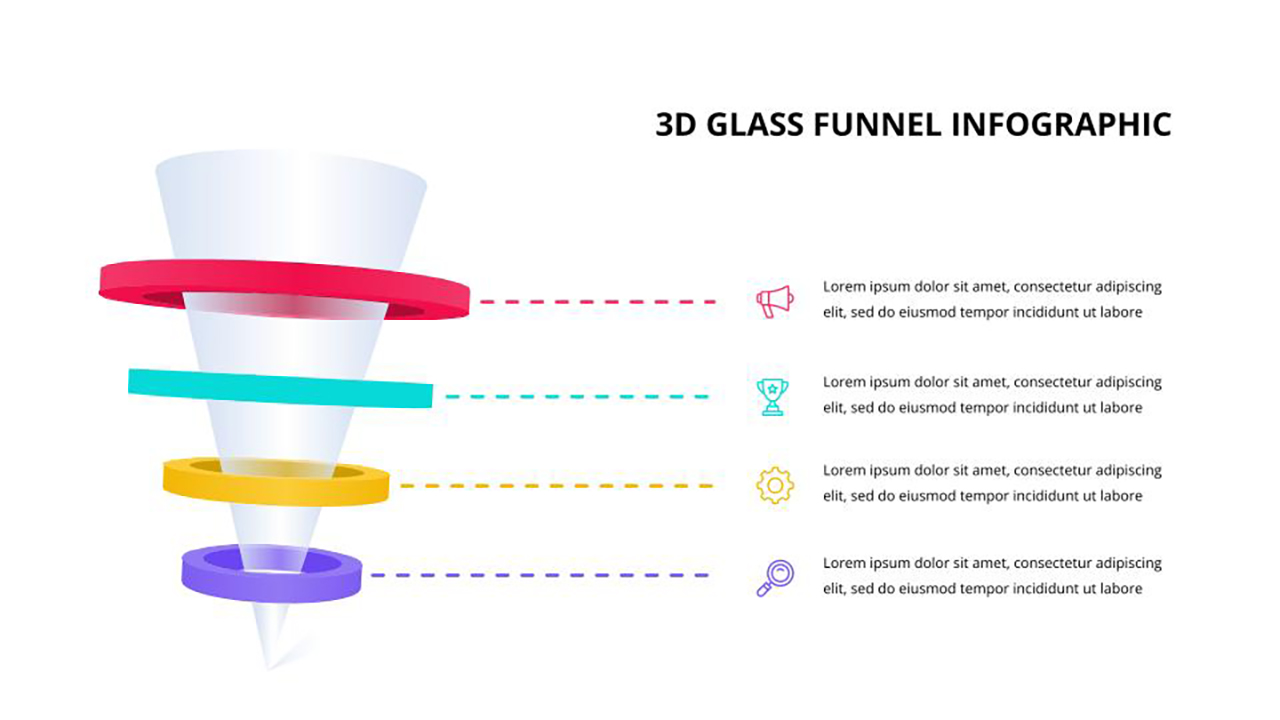
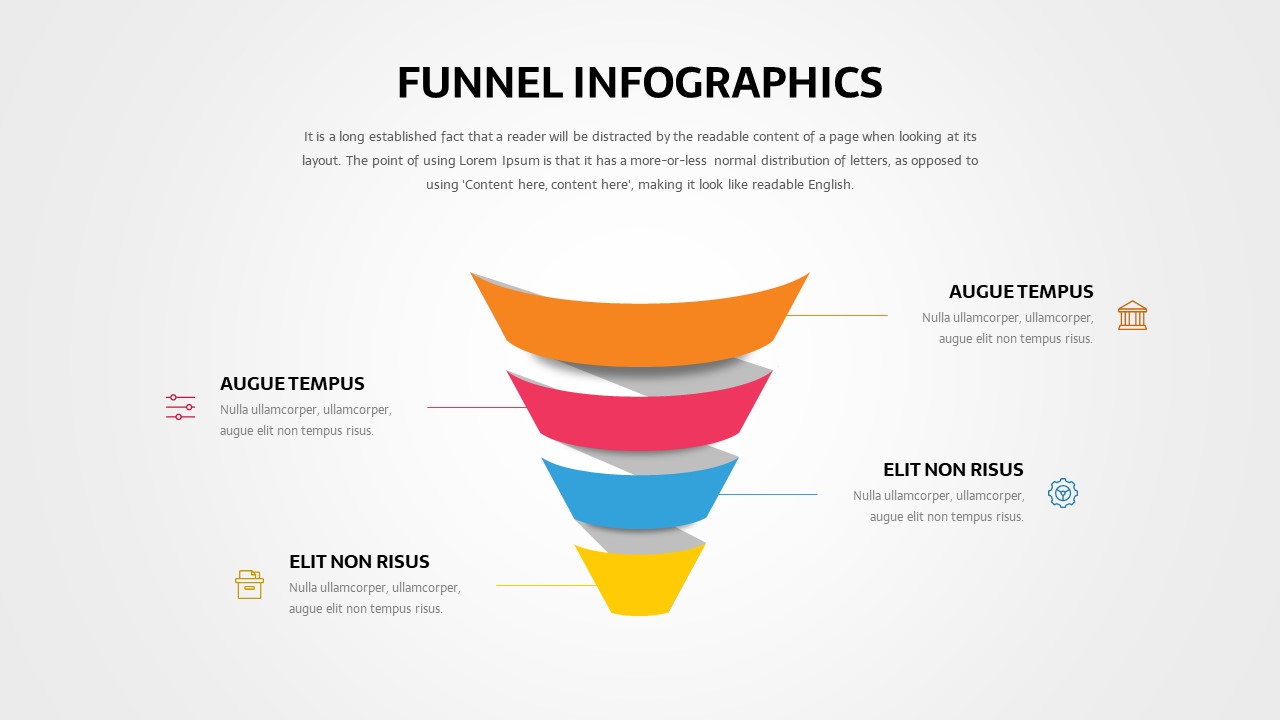
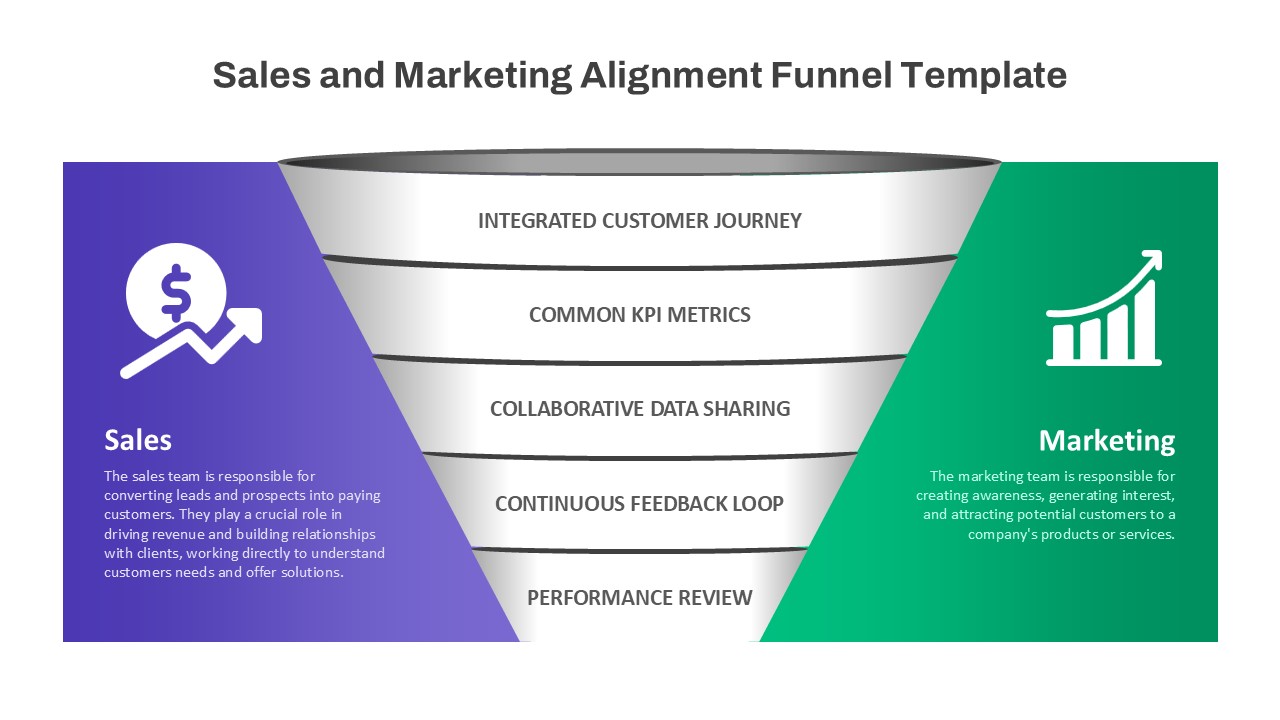
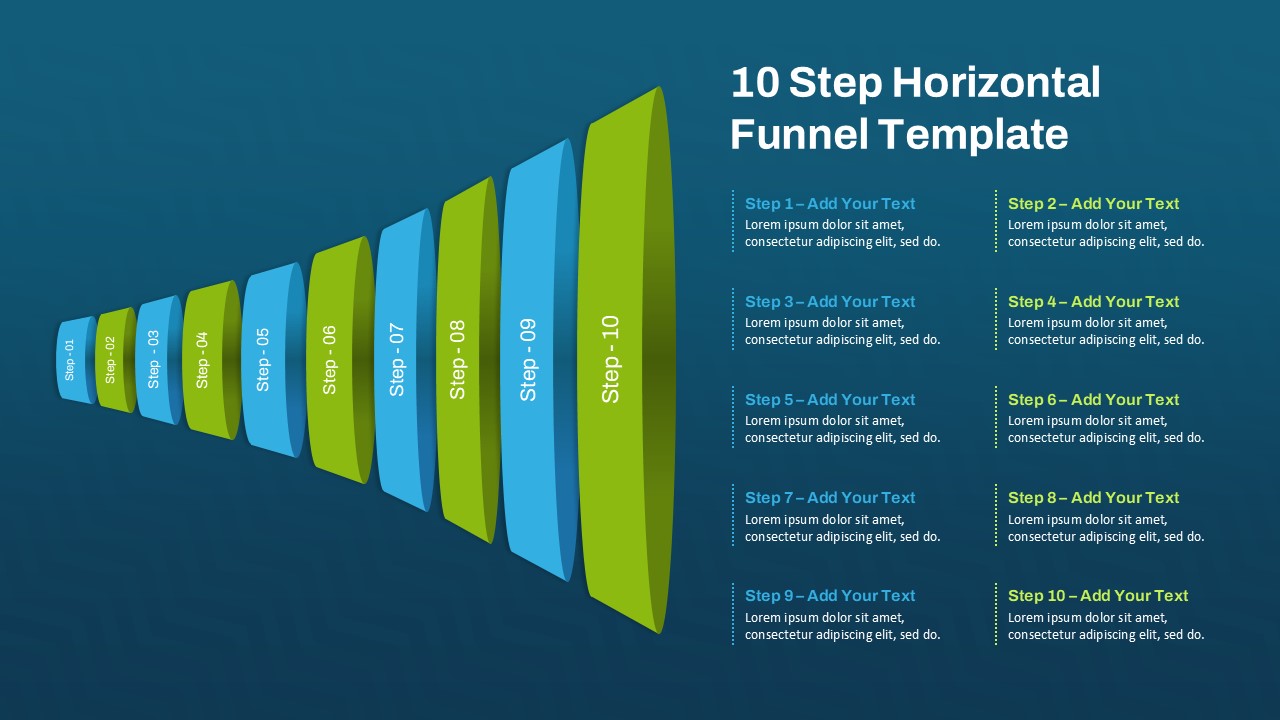
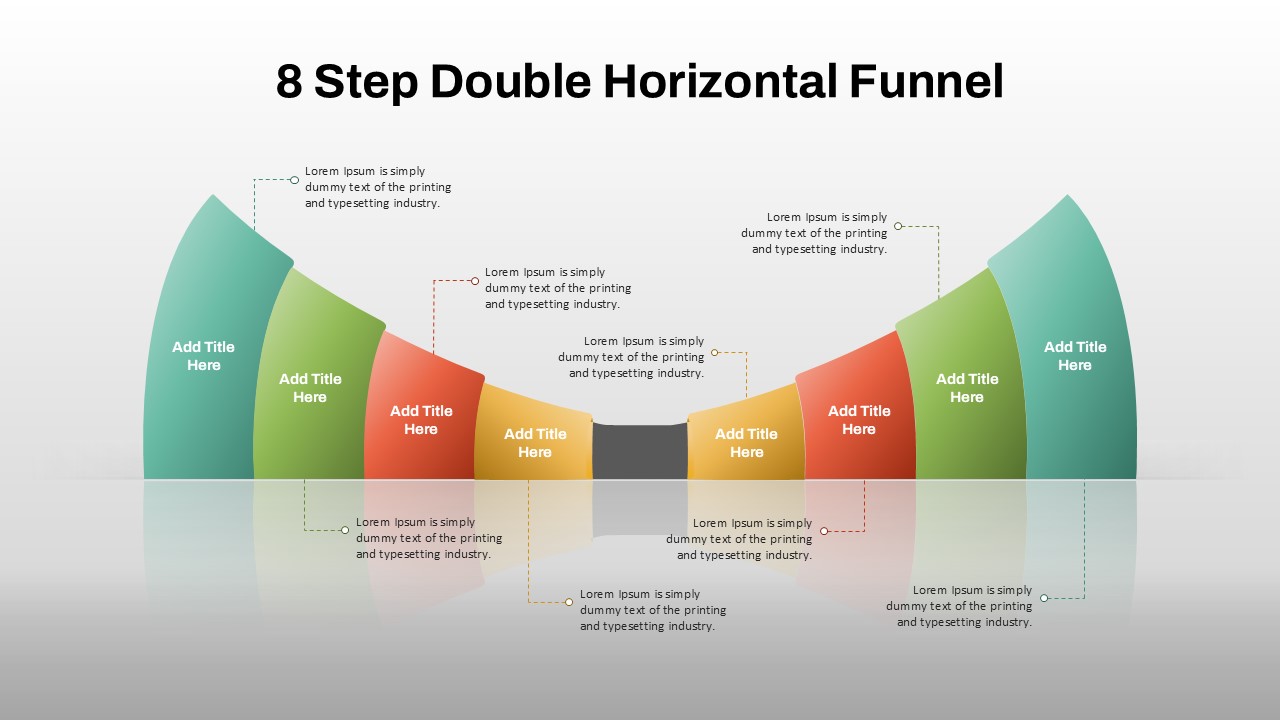
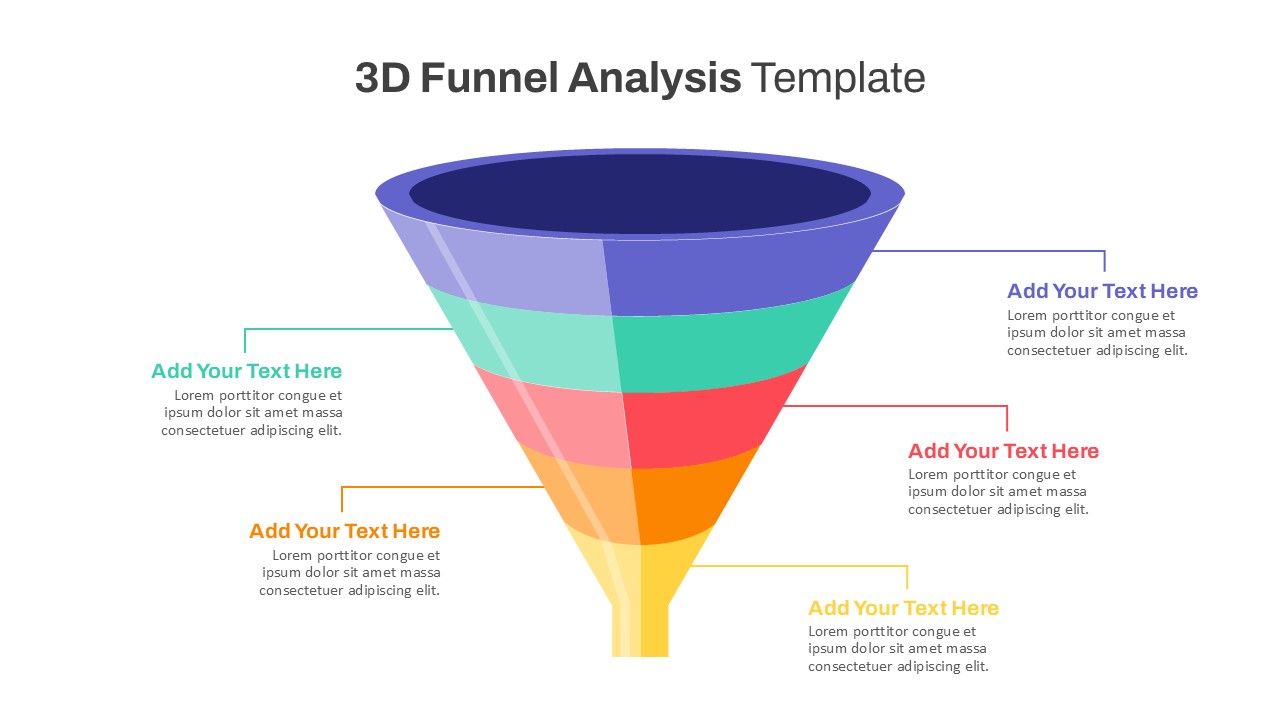
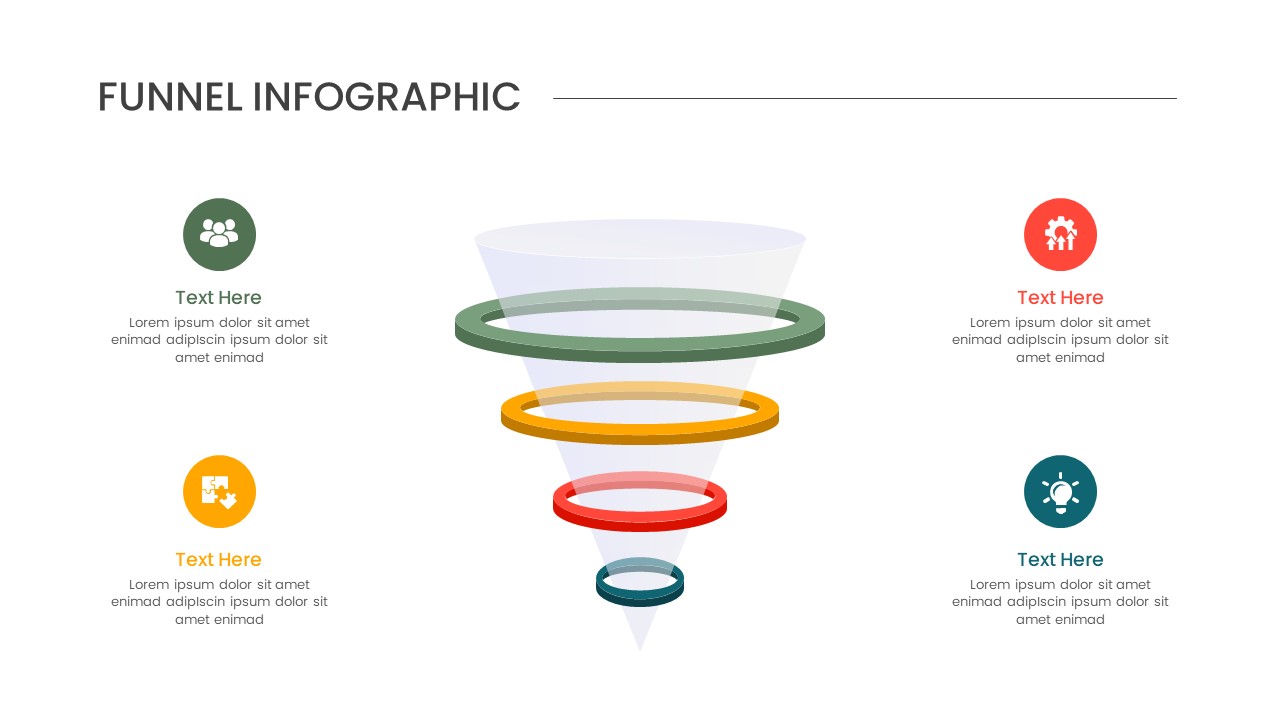
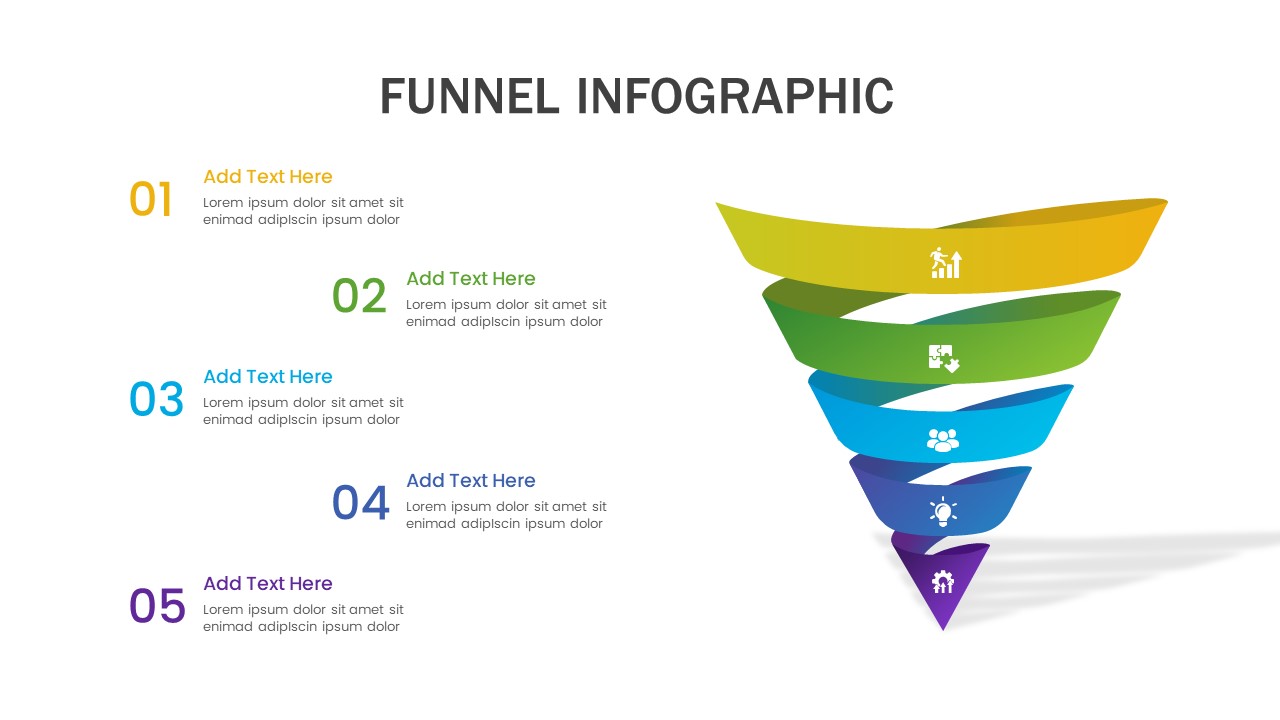
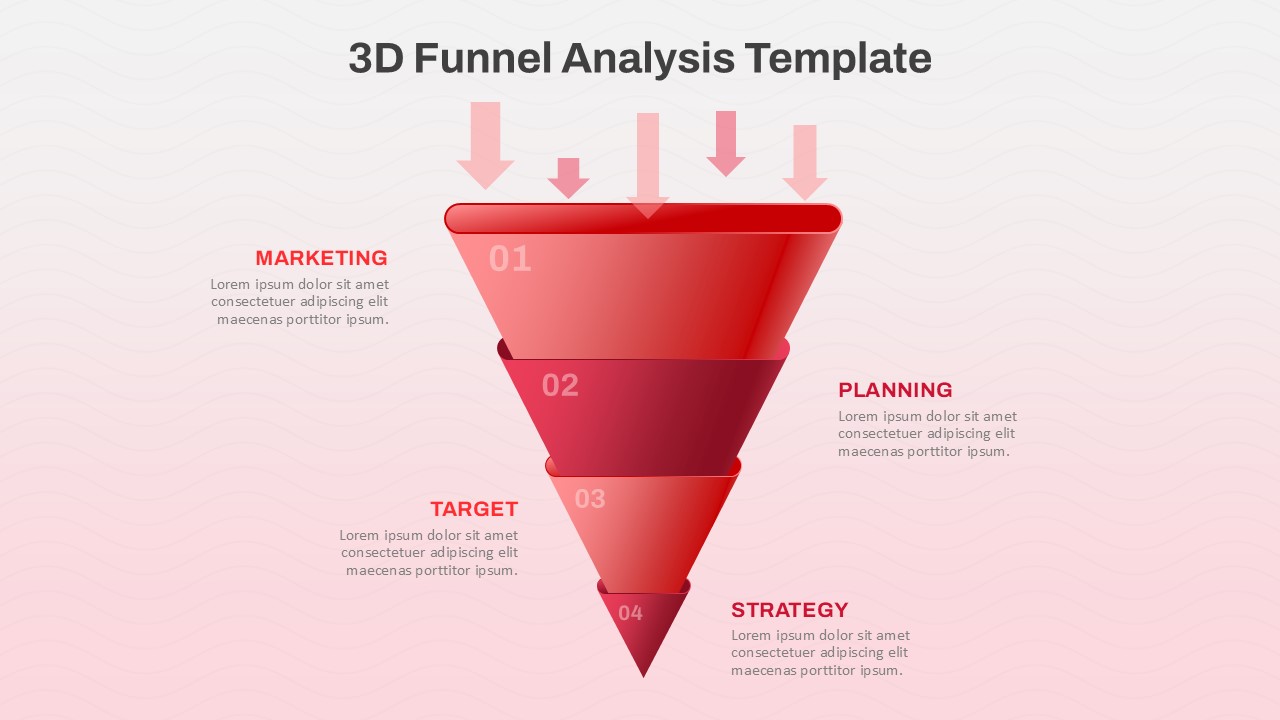
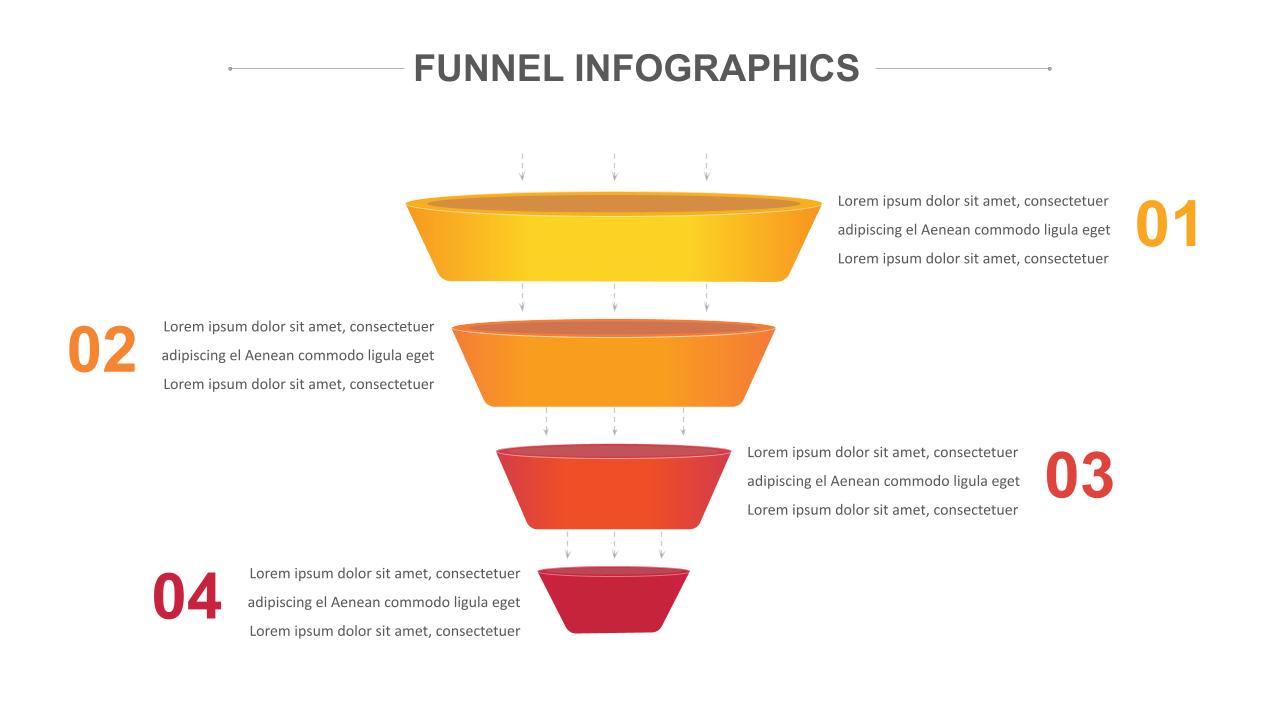
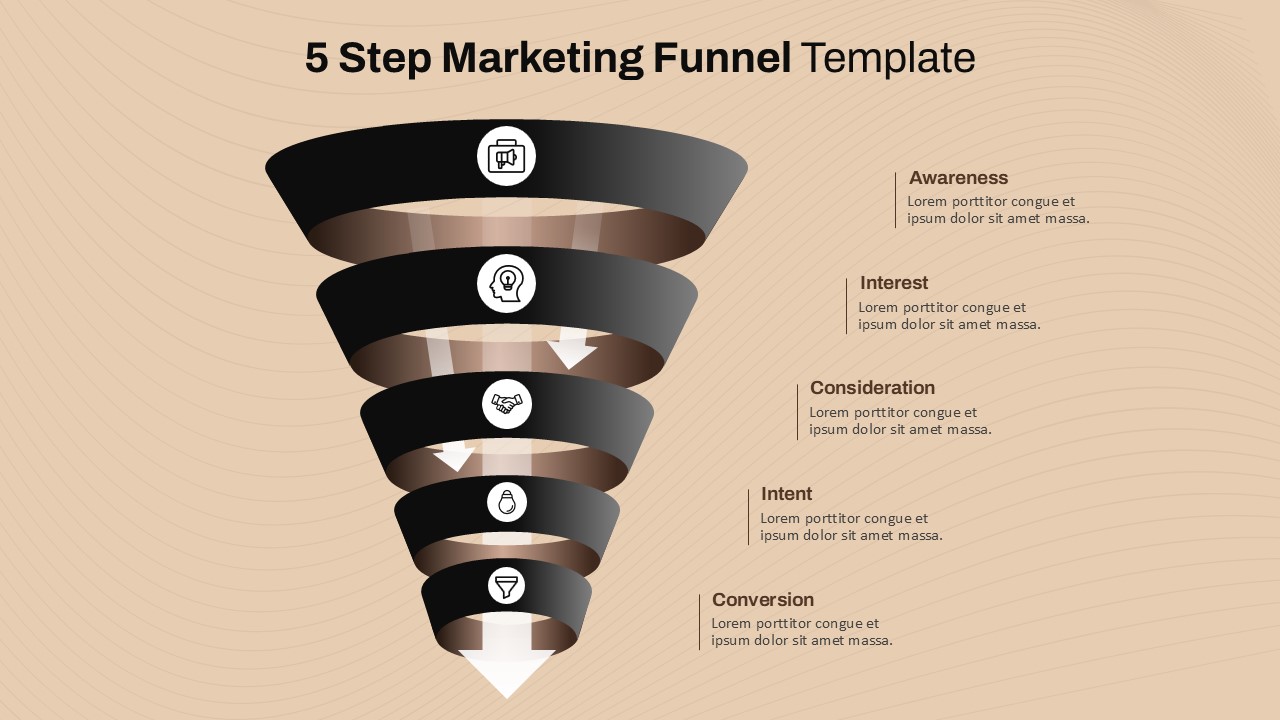
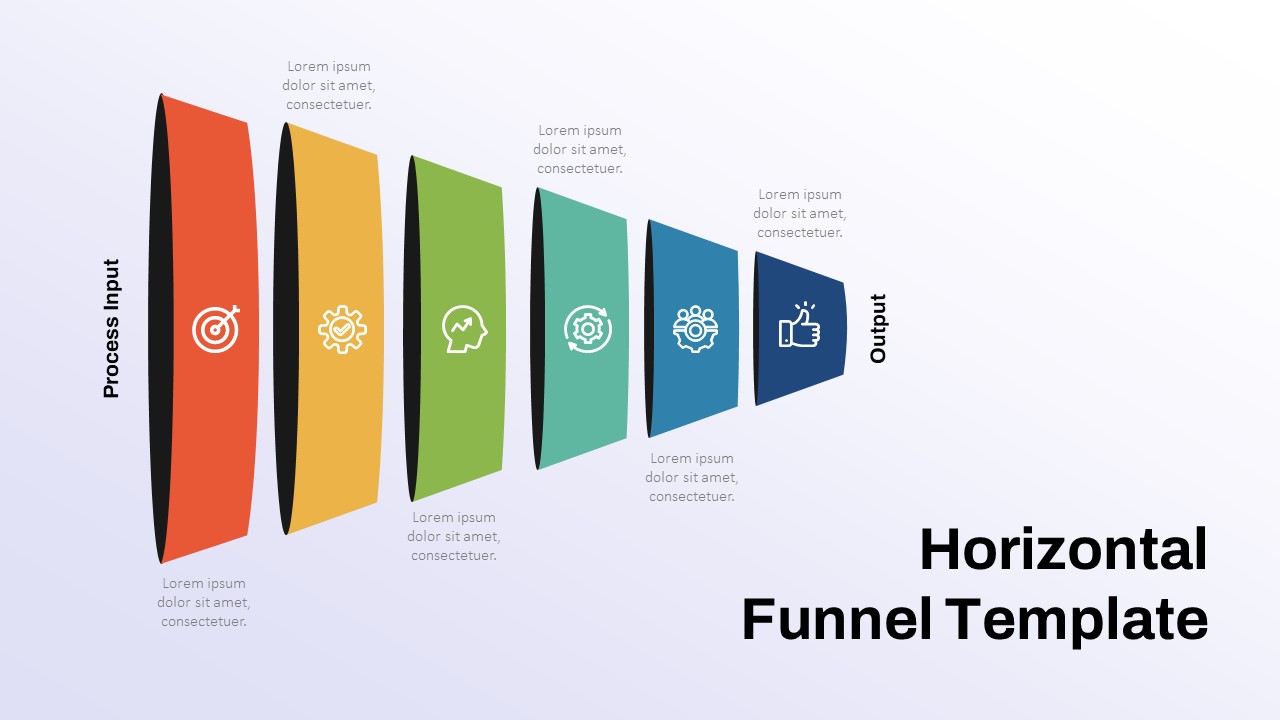
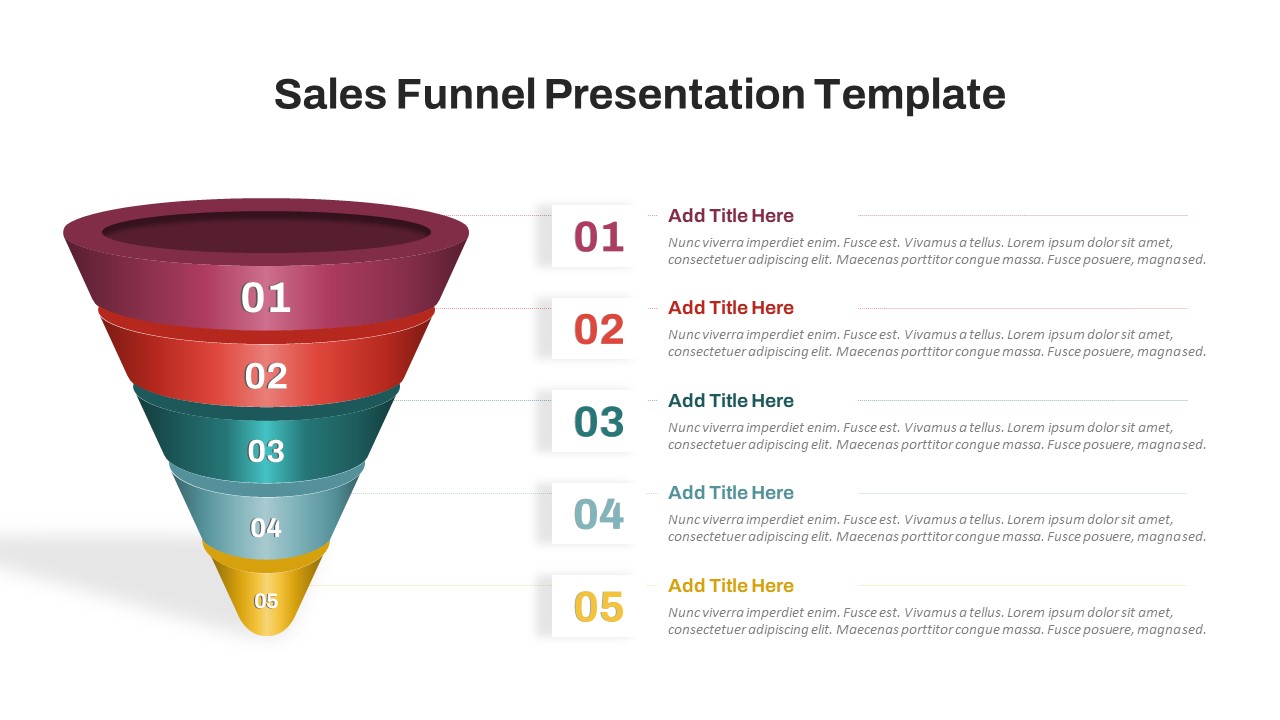
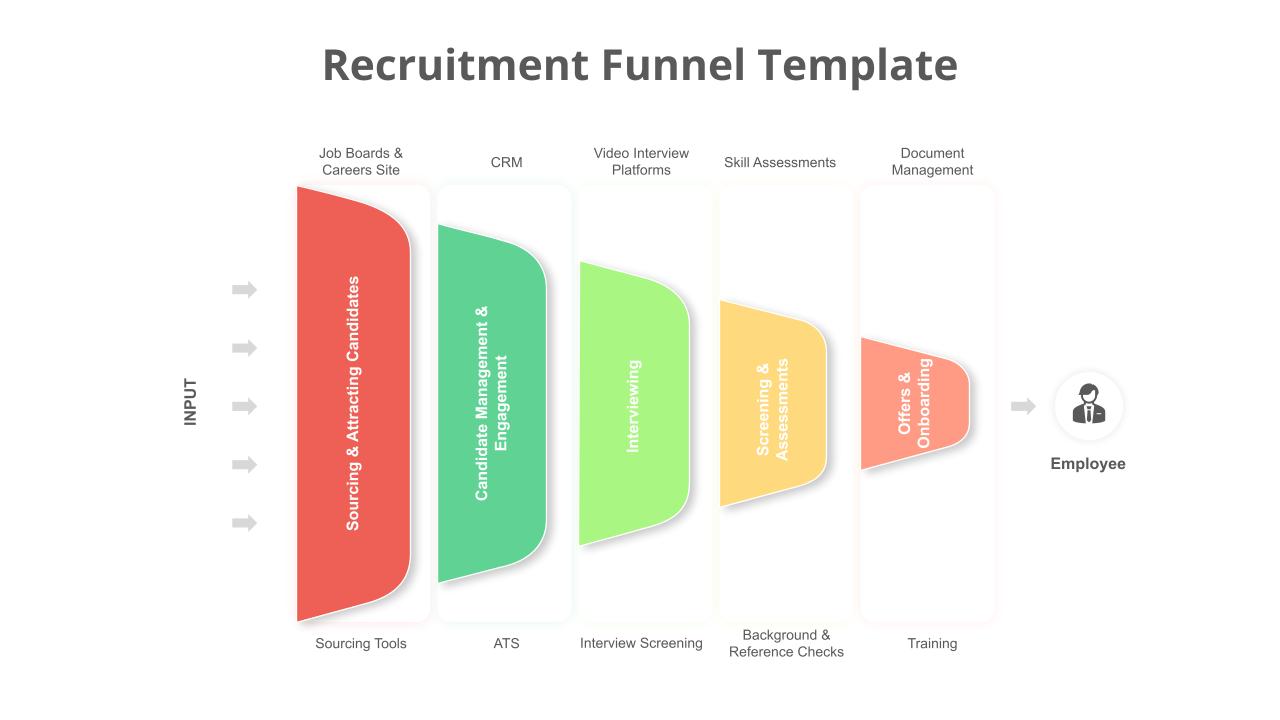
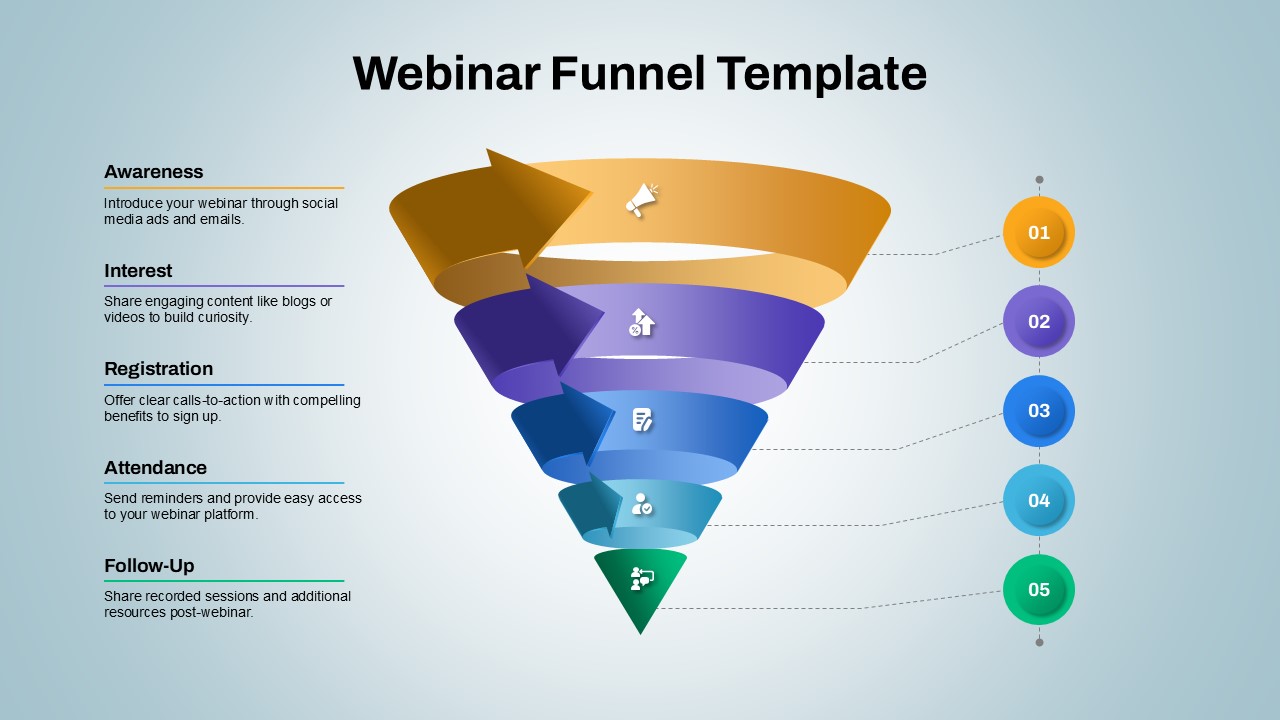
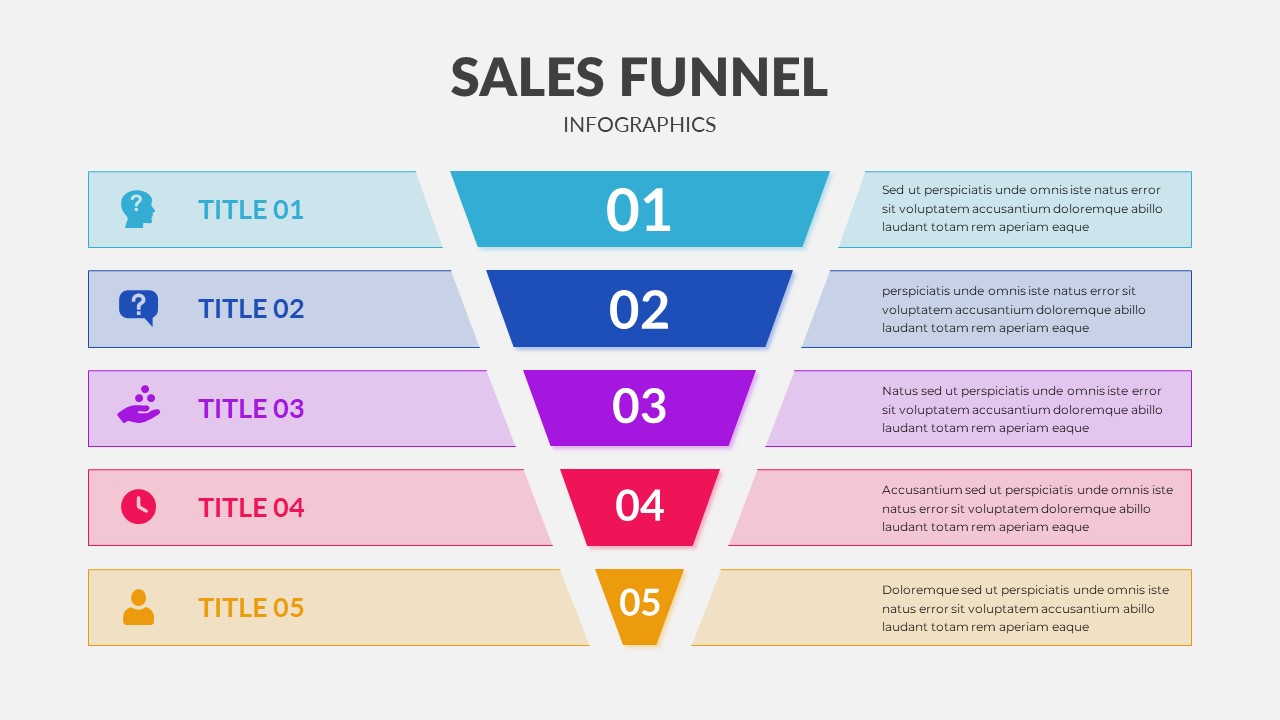
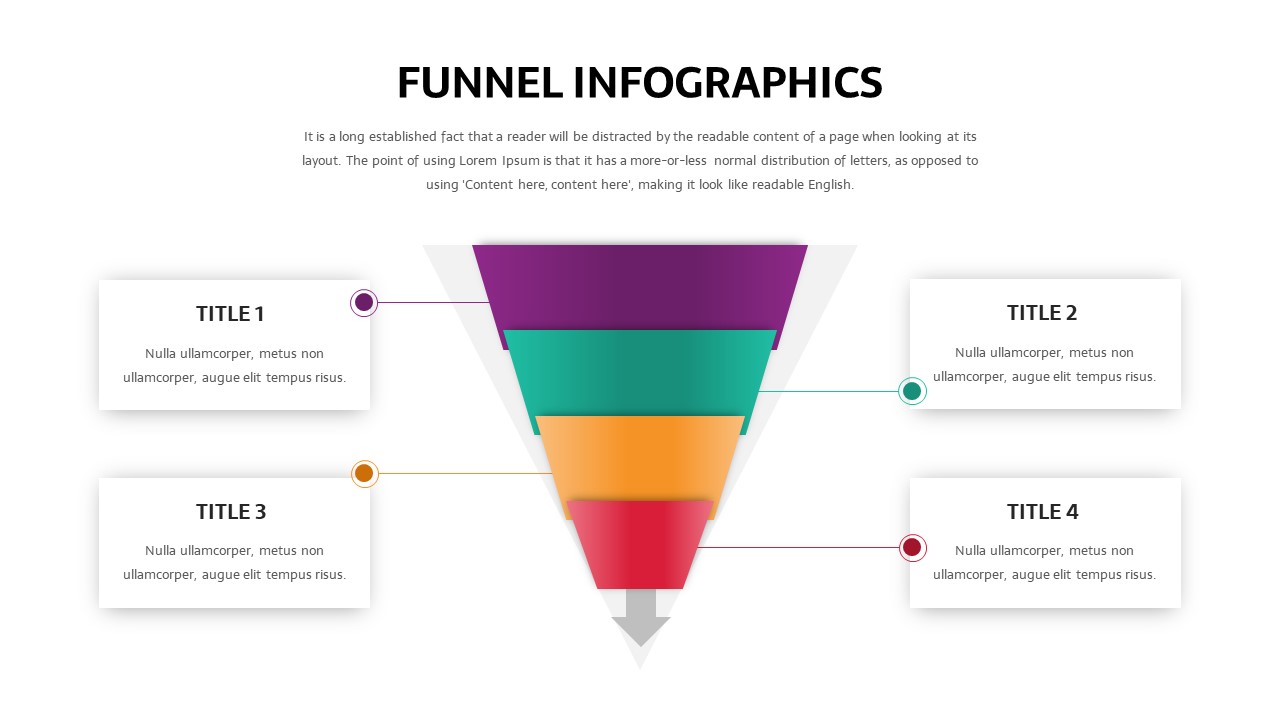
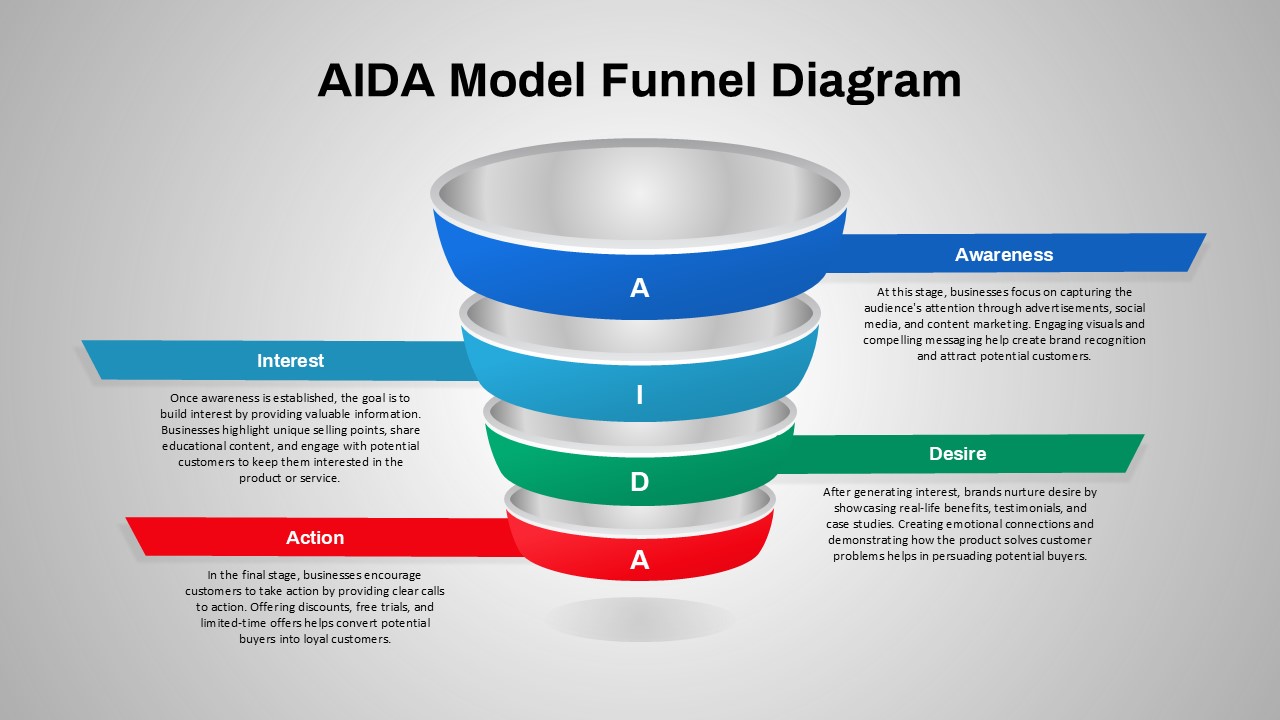
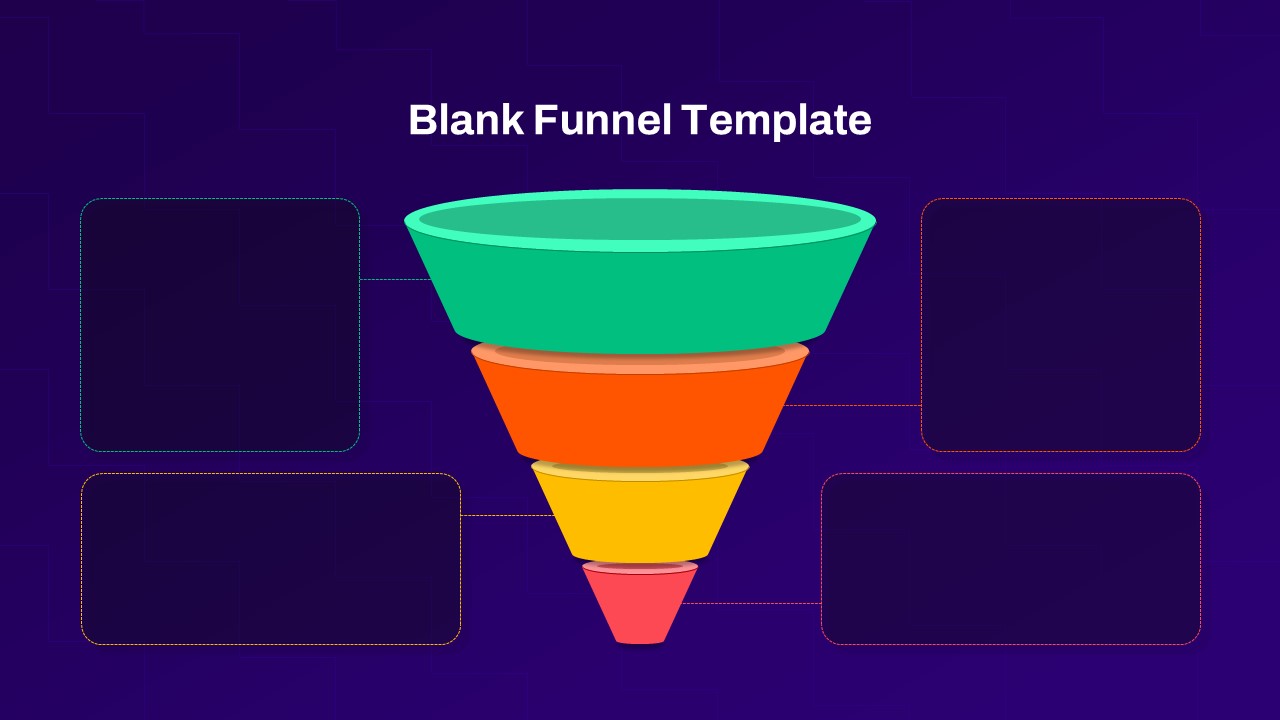
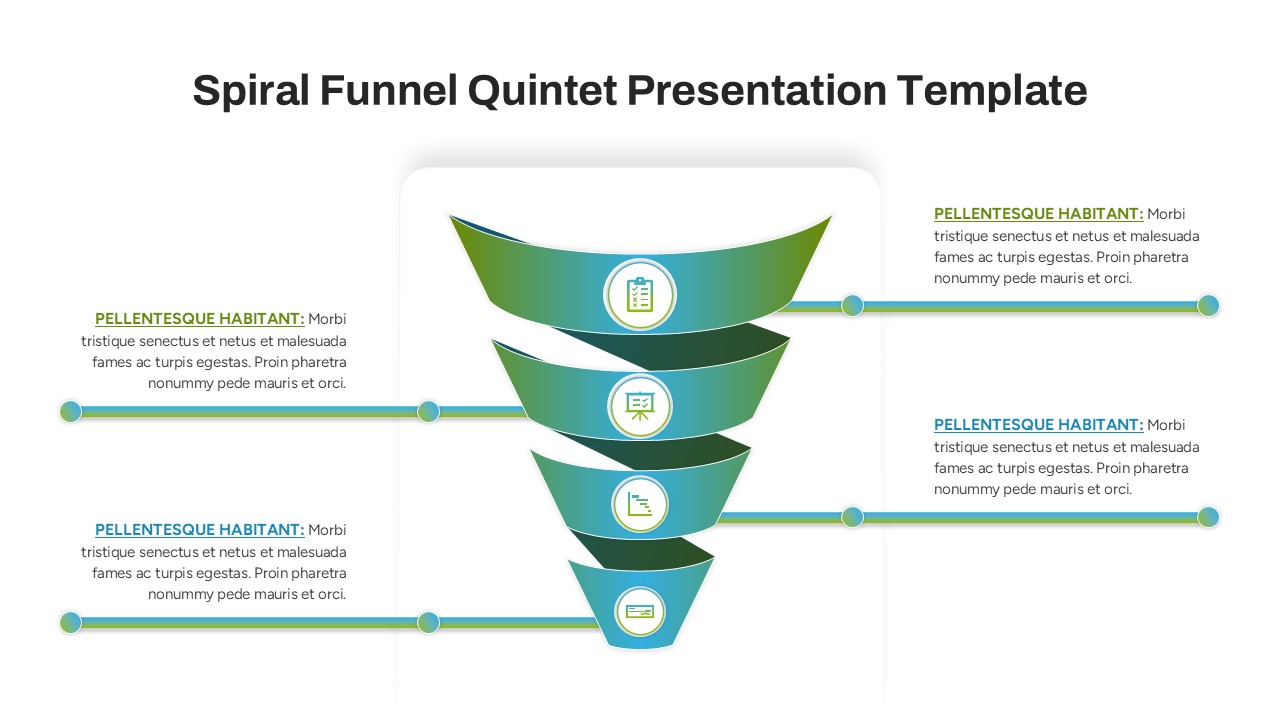
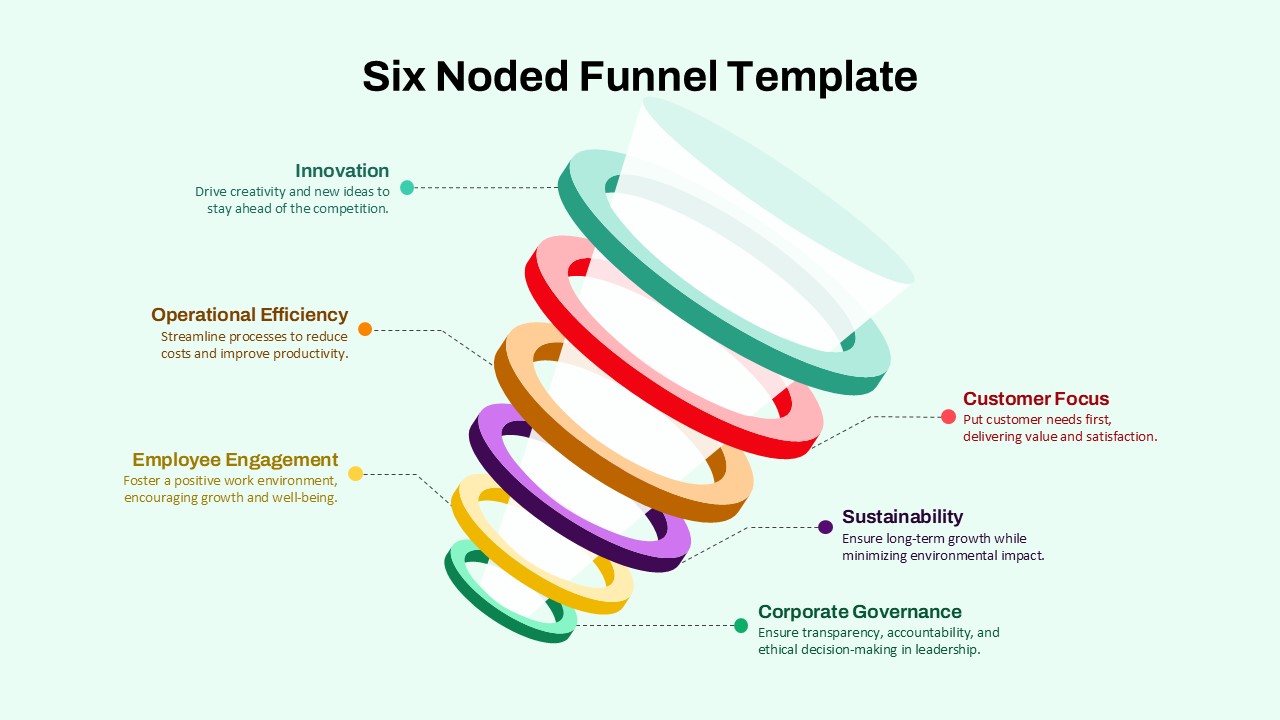
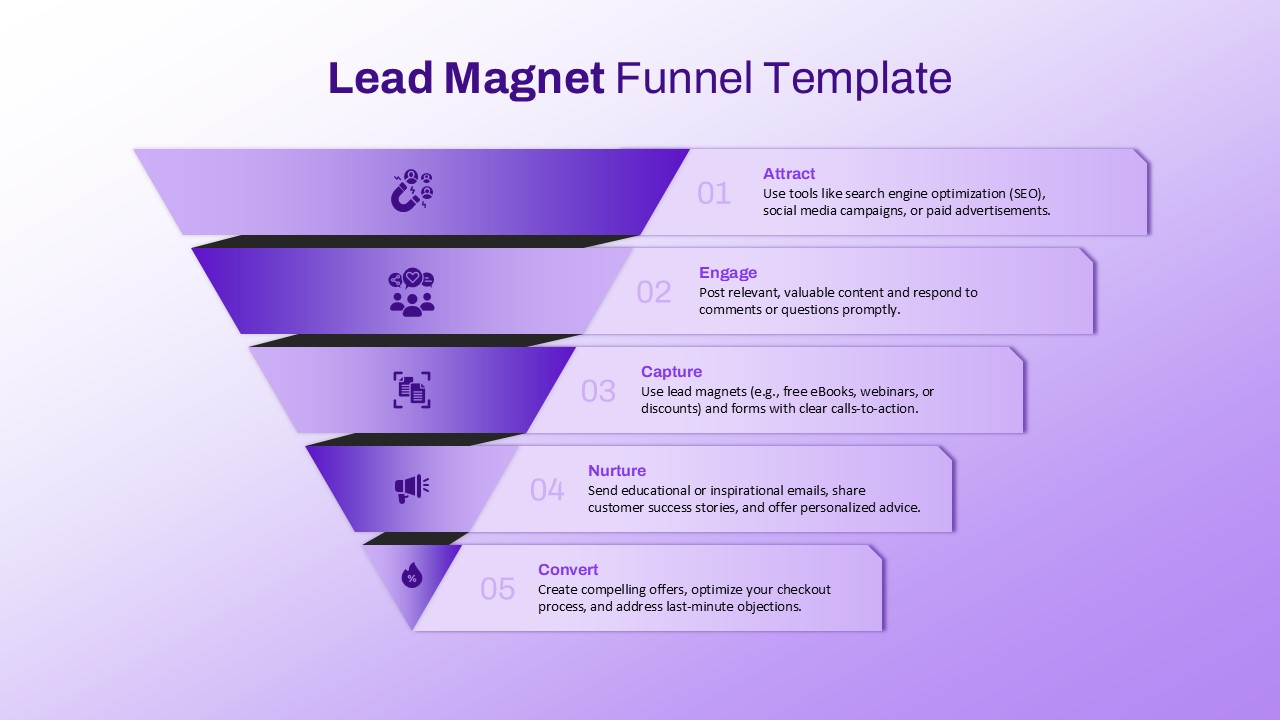
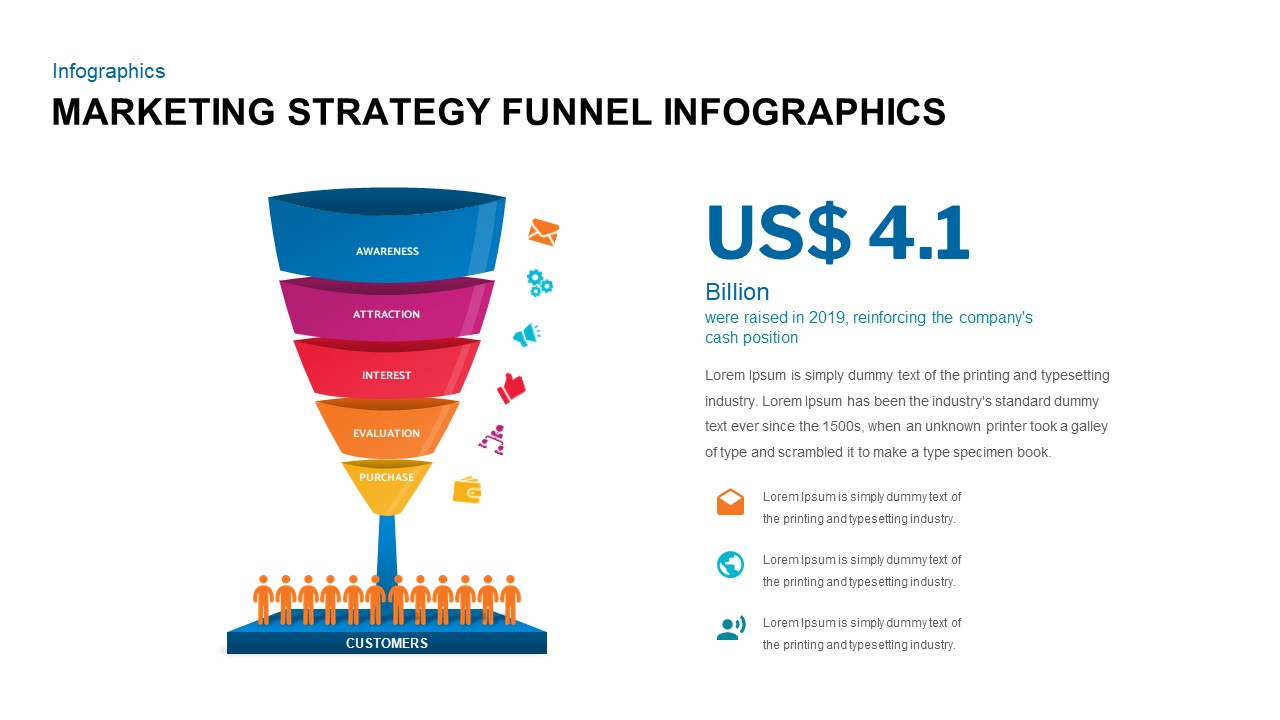
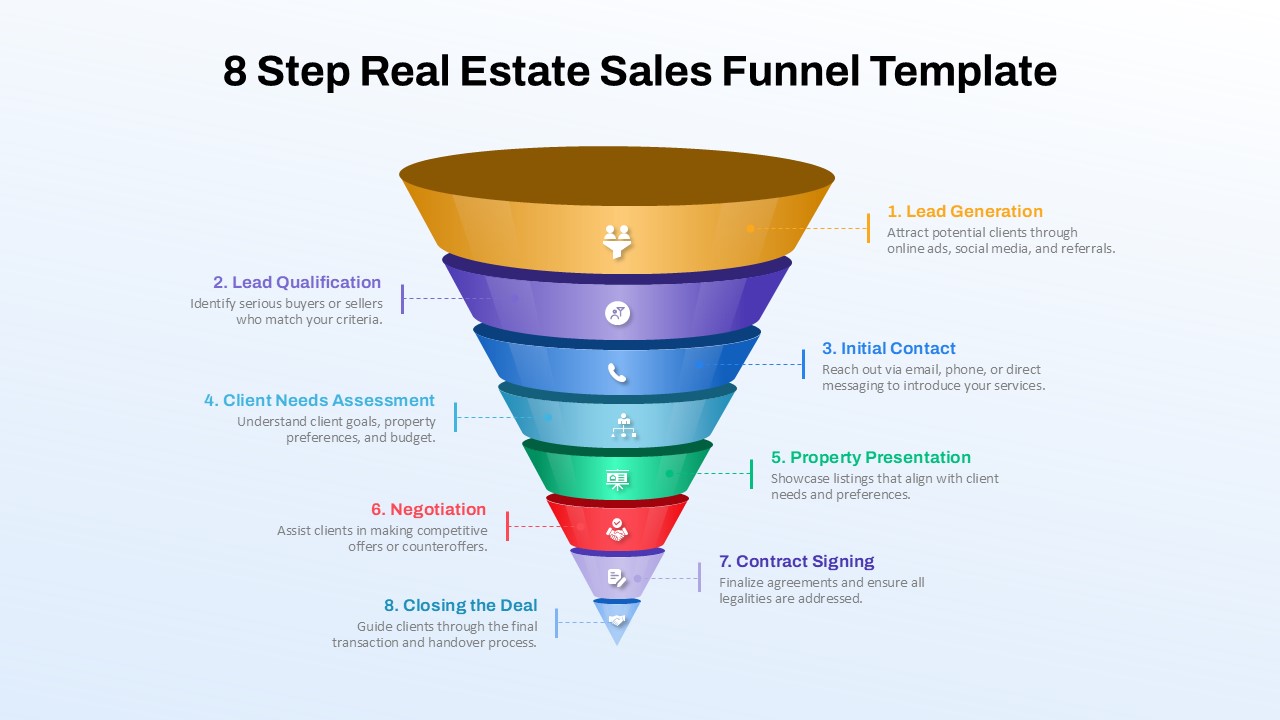
The Filtering Process Flow in PPT and Google Slides template is a visually engaging and structured representation of how raw data, information, or resources are refined through a systematic filtering process. Designed with a funnel-based flowchart, this template clearly illustrates how irrelevant, redundant, or erroneous data is gradually eliminated, leaving only high-quality, refined results.
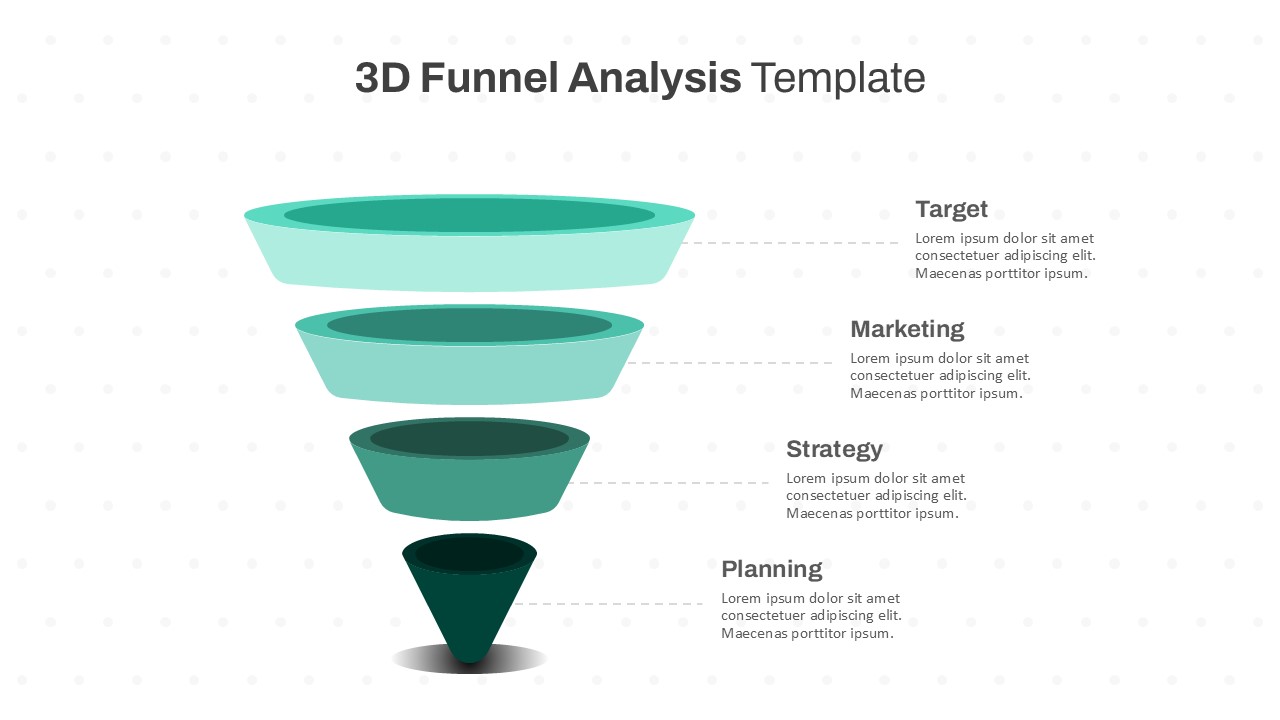
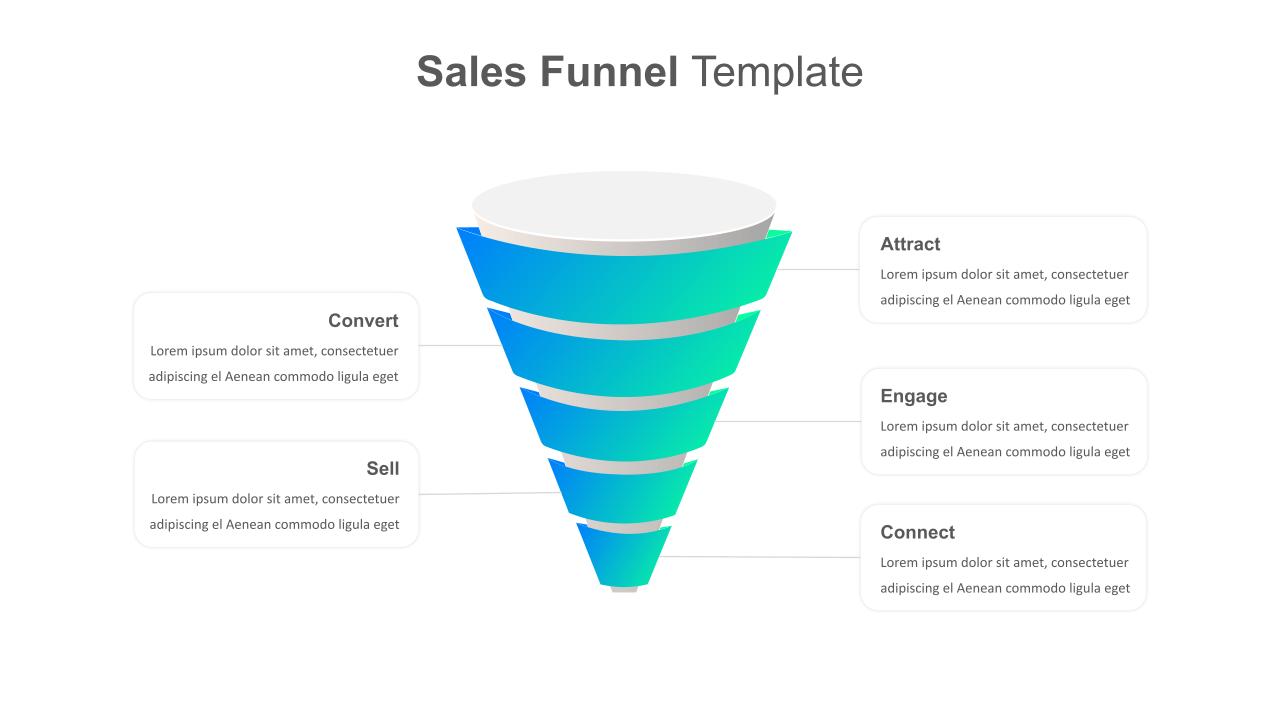
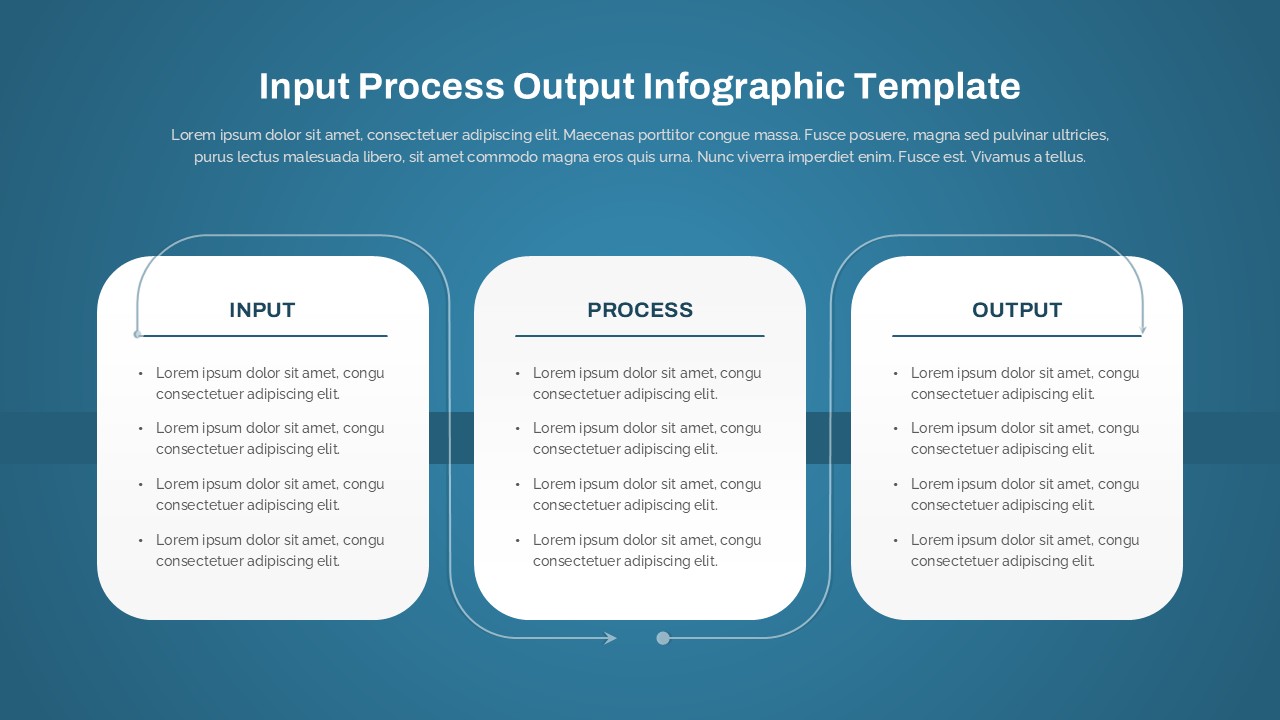
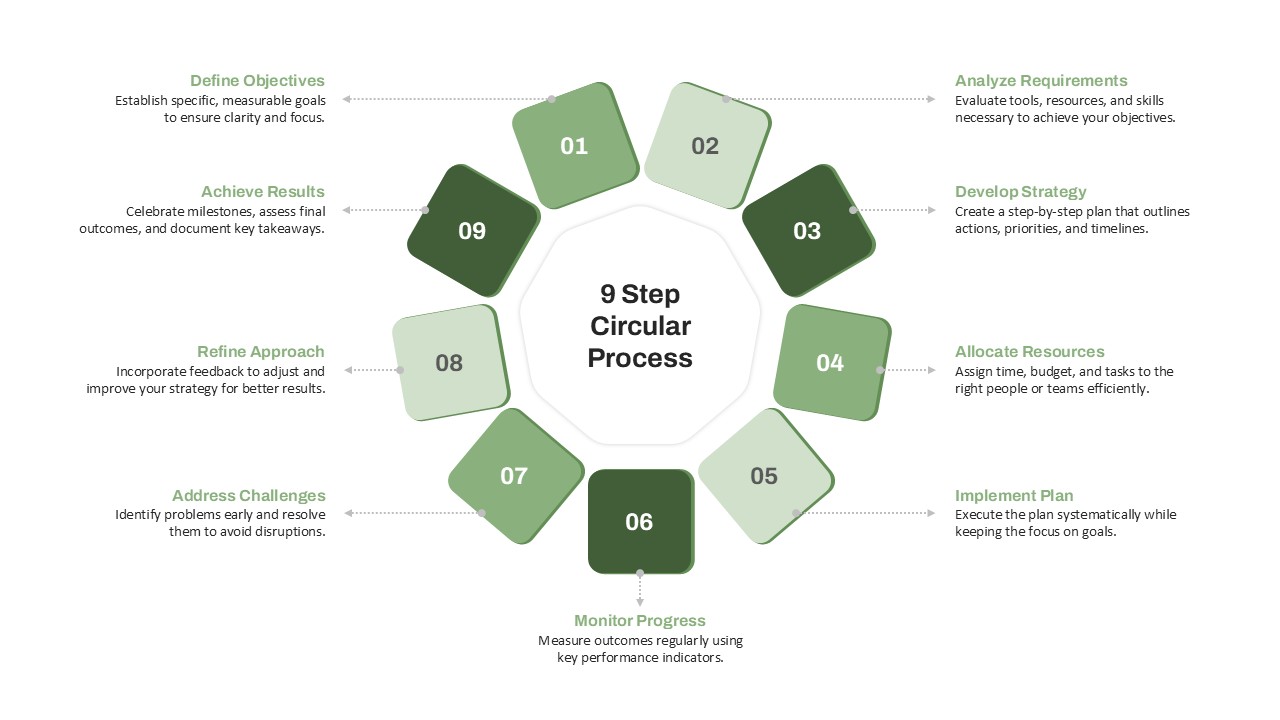
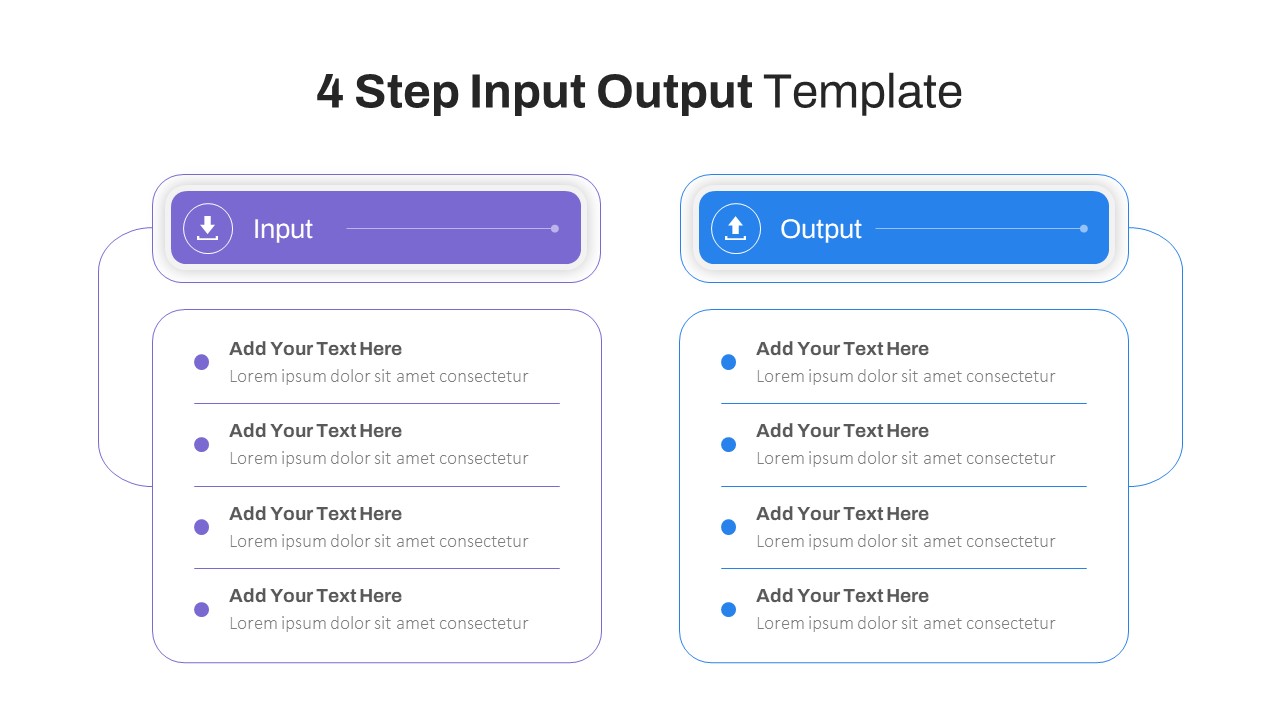
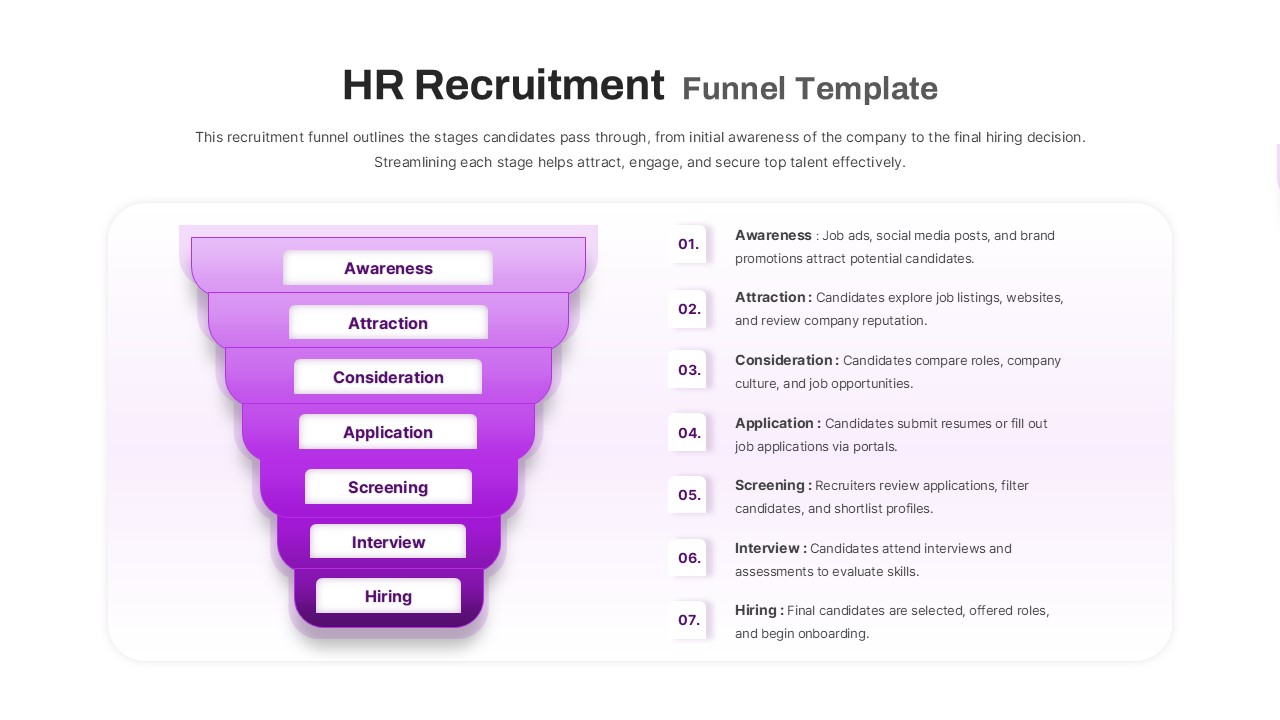
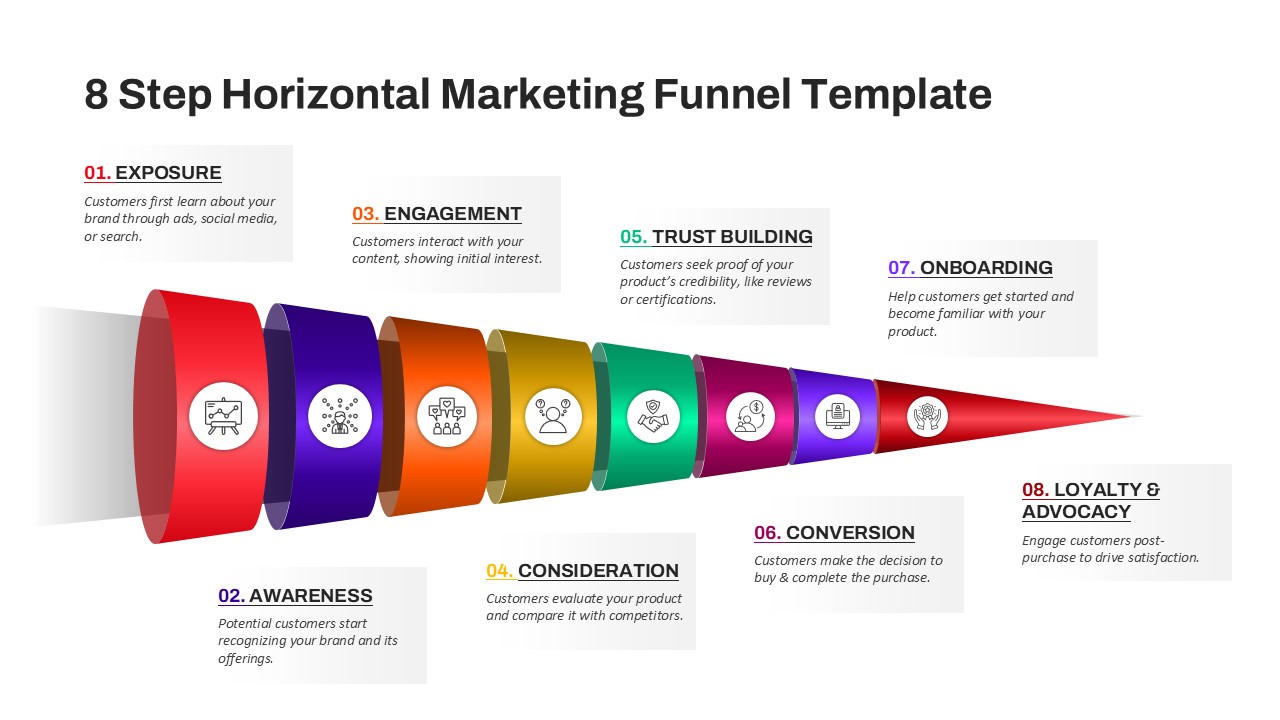
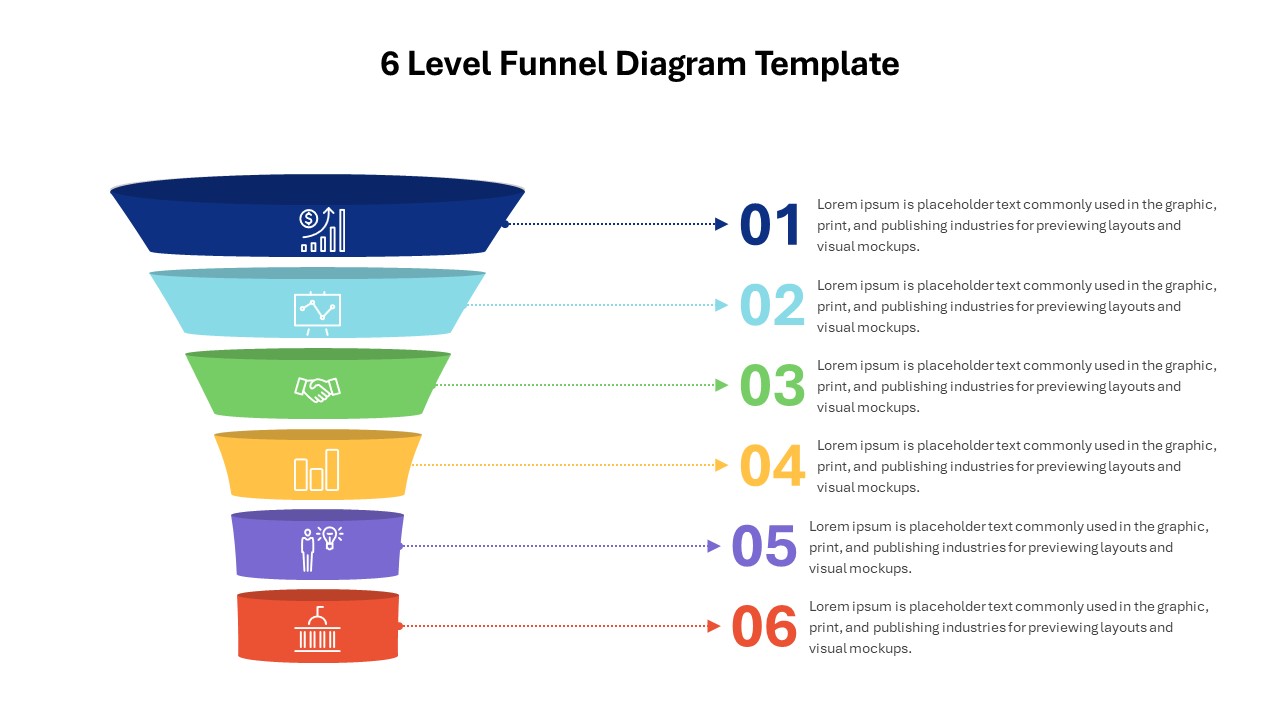
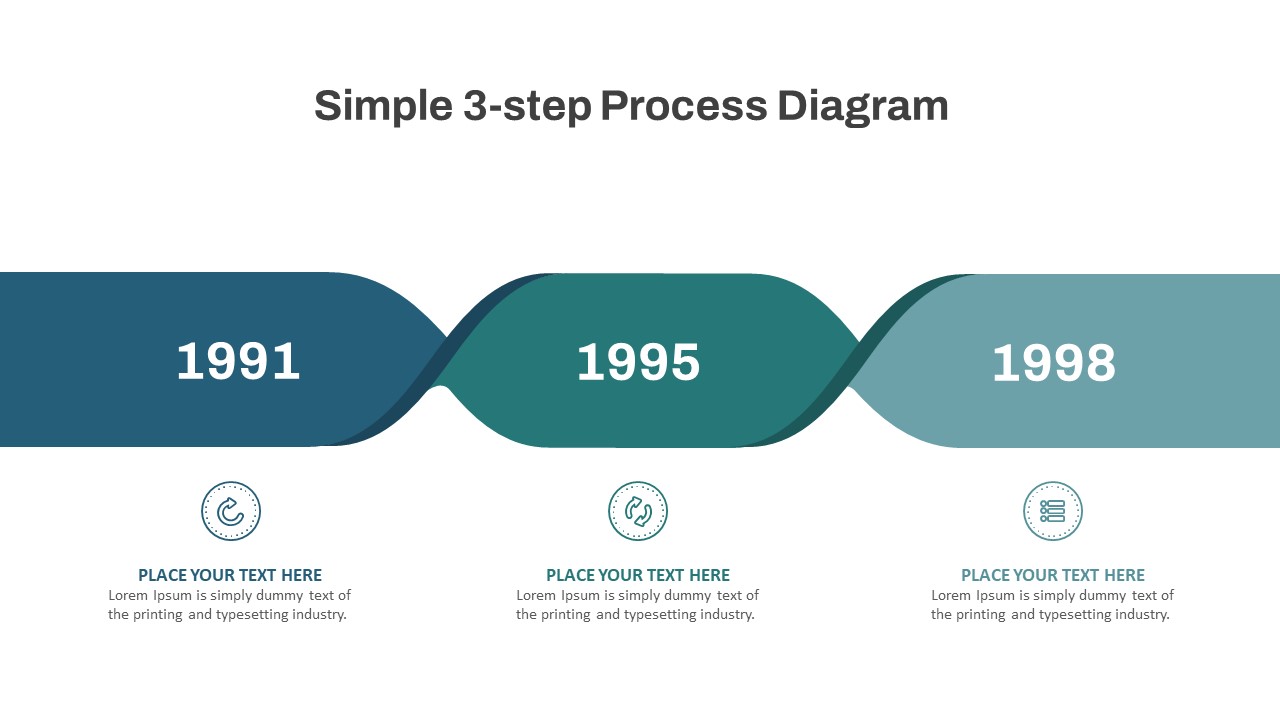
This template is structured into three main stages:
Filter 1 – Initial Screening: Raw data is gathered from multiple sources, and unnecessary inputs are removed to retain only relevant information.
Filter 2 – Refinement: The filtered data undergoes further processing to eliminate errors and inconsistencies, improving accuracy and relevance.
Filter 3 – Final Output: The last stage ensures only high-quality, well-processed data remains, making it ready for analysis, decision-making, or actionable insights.
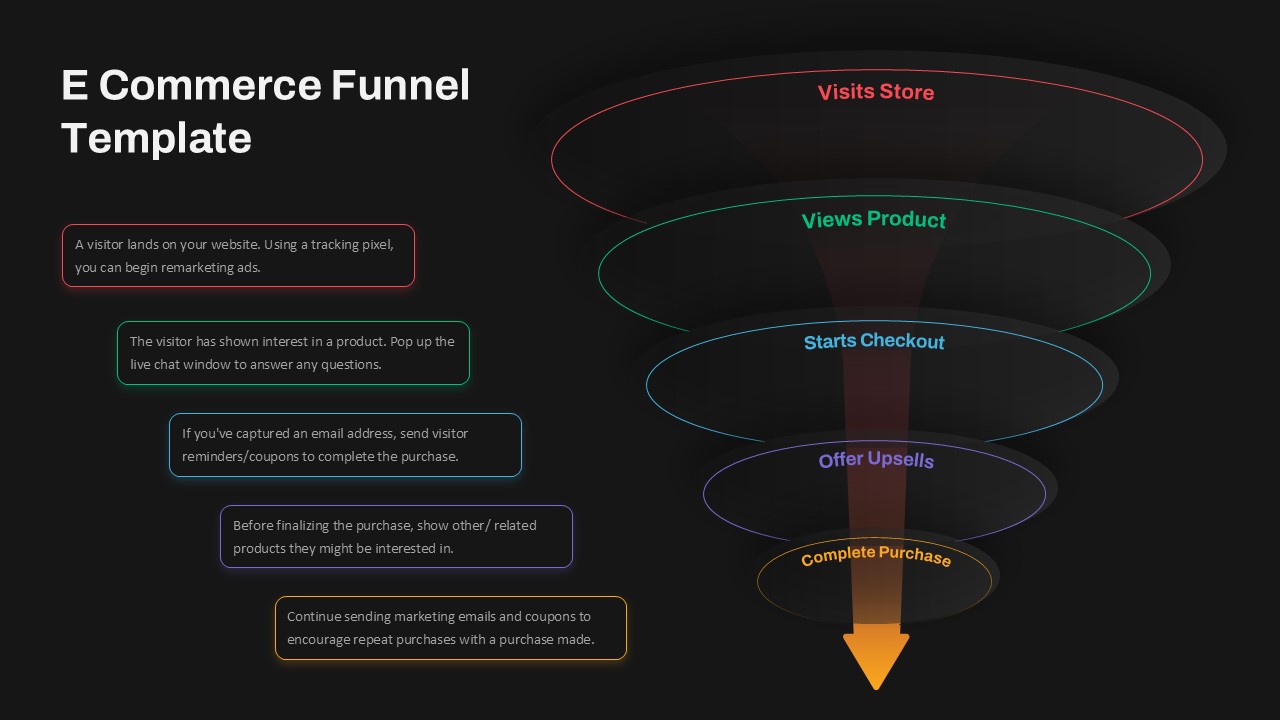
The modern funnel-based design makes it perfect for presentations related to data processing, business intelligence, decision-making workflows, information management, and strategic analysis. The gradient background and three-stage filtering process visually emphasize the gradual refinement of raw input into a meaningful and useful outcome.
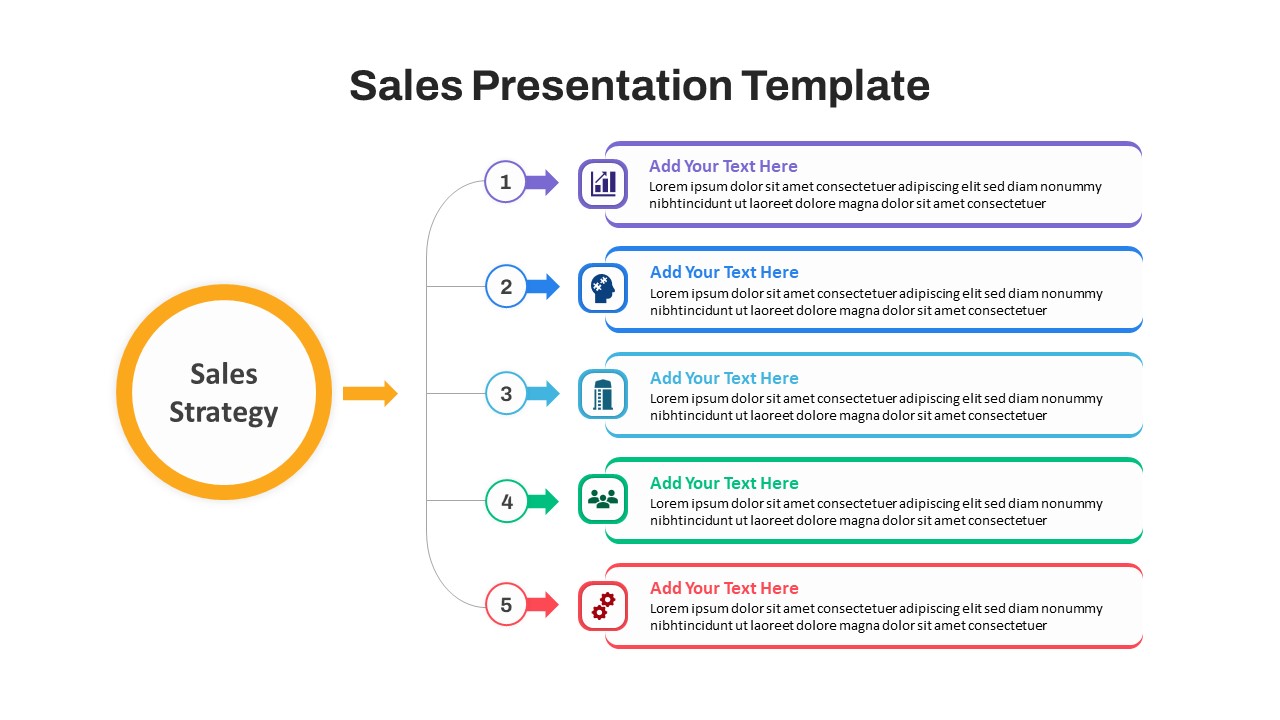
This fully editable template is compatible with PowerPoint and Google Slides, allowing users to customize colors, text, and design elements based on their specific requirements. Whether you are explaining data filtration, project assessment, risk management, or business process optimization, this template provides a clear and effective visual aid.
See more

Aspect Ratio
16:9Item ID
SKT03301
Features of this template
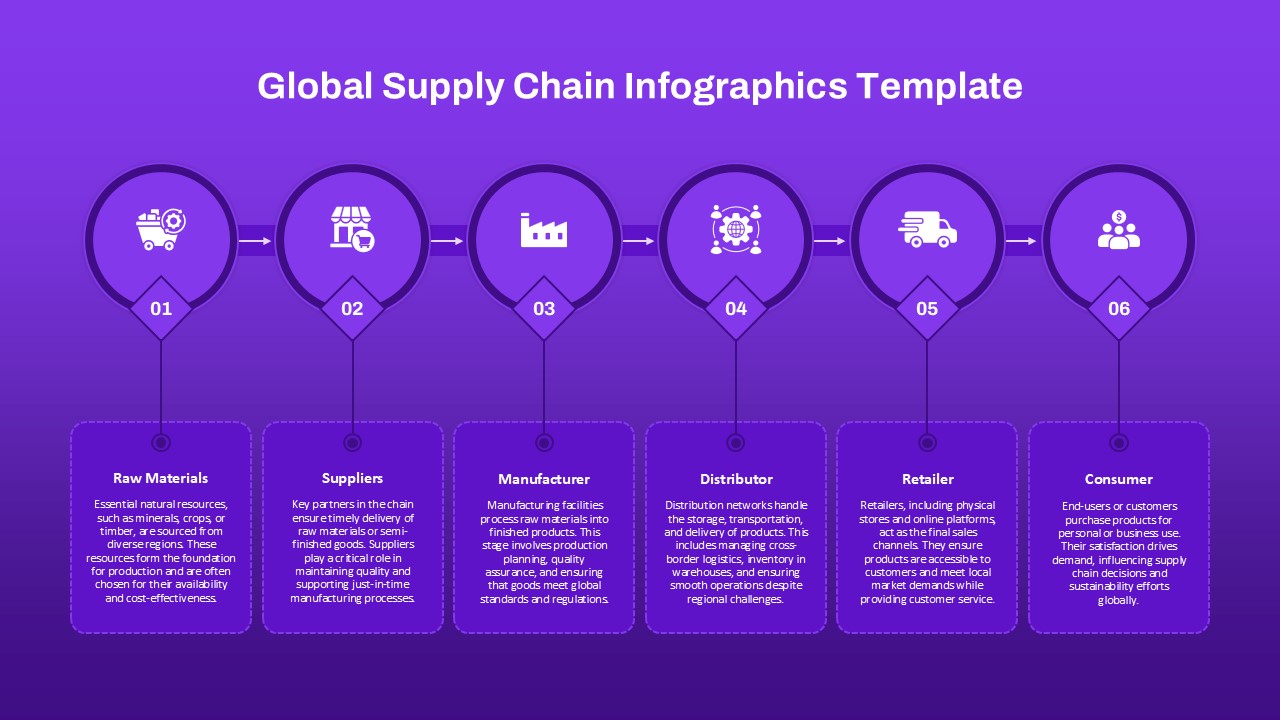
Other User Cases of the Template:
Data processing workflow, business intelligence reporting, lead qualification process, content moderation, risk management strategy, customer segmentation, market research data filtering, machine learning data preprocessing, supply chain optimization, quality control processes.
FAQs
You May Also Like These Presentation Templates


- Free
- Free
- Free


- Free
- Free
- Free
- Free
- Free
- Free
- Free