Gantt Chart Infographic PowerPoint & Google Slides Template

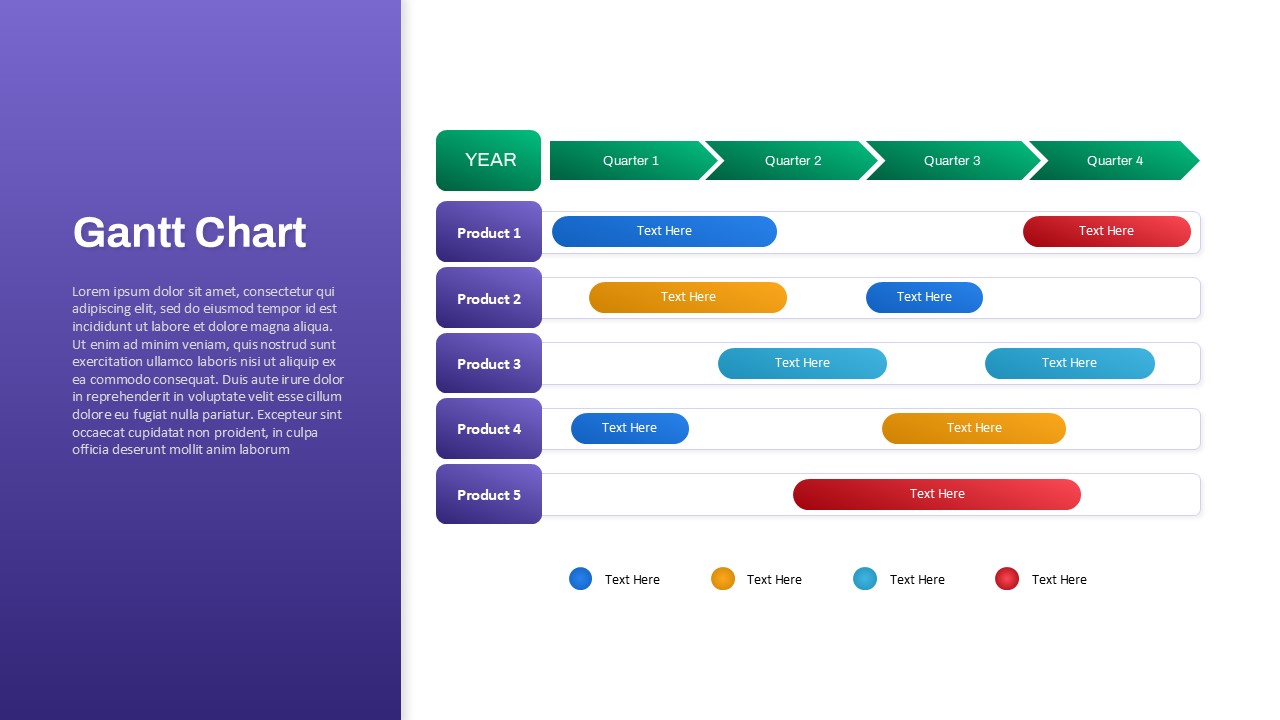
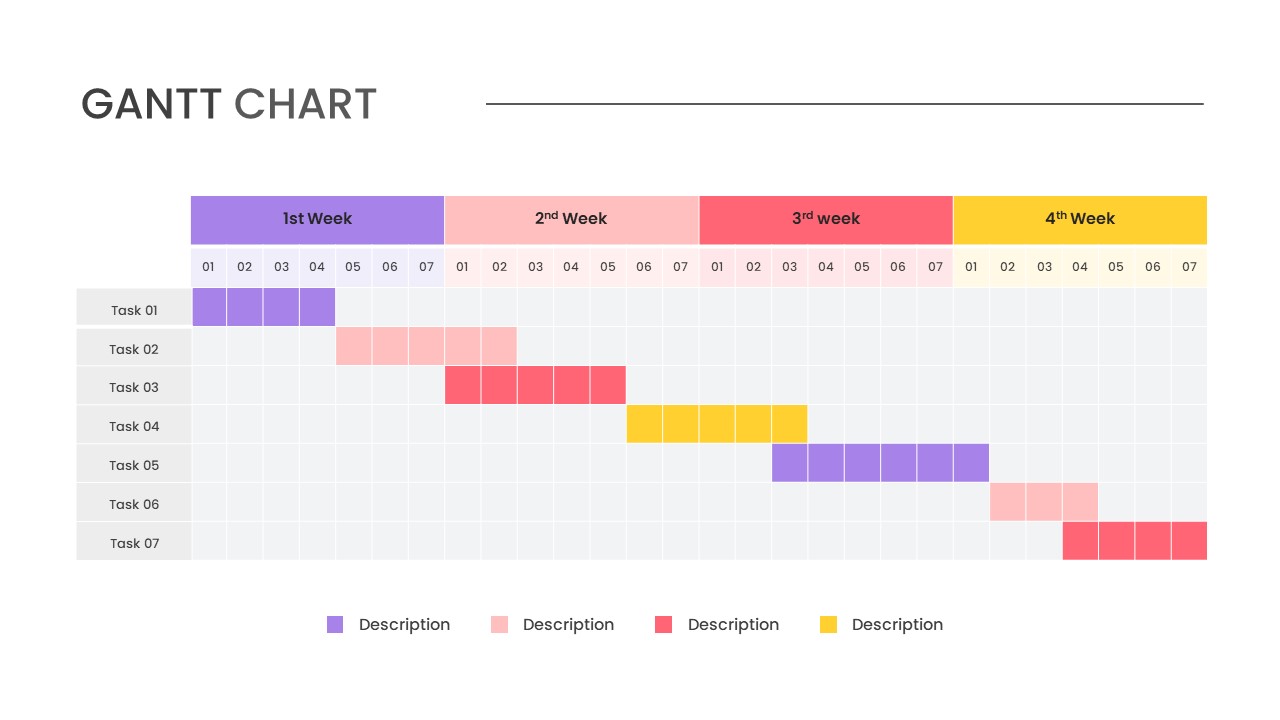
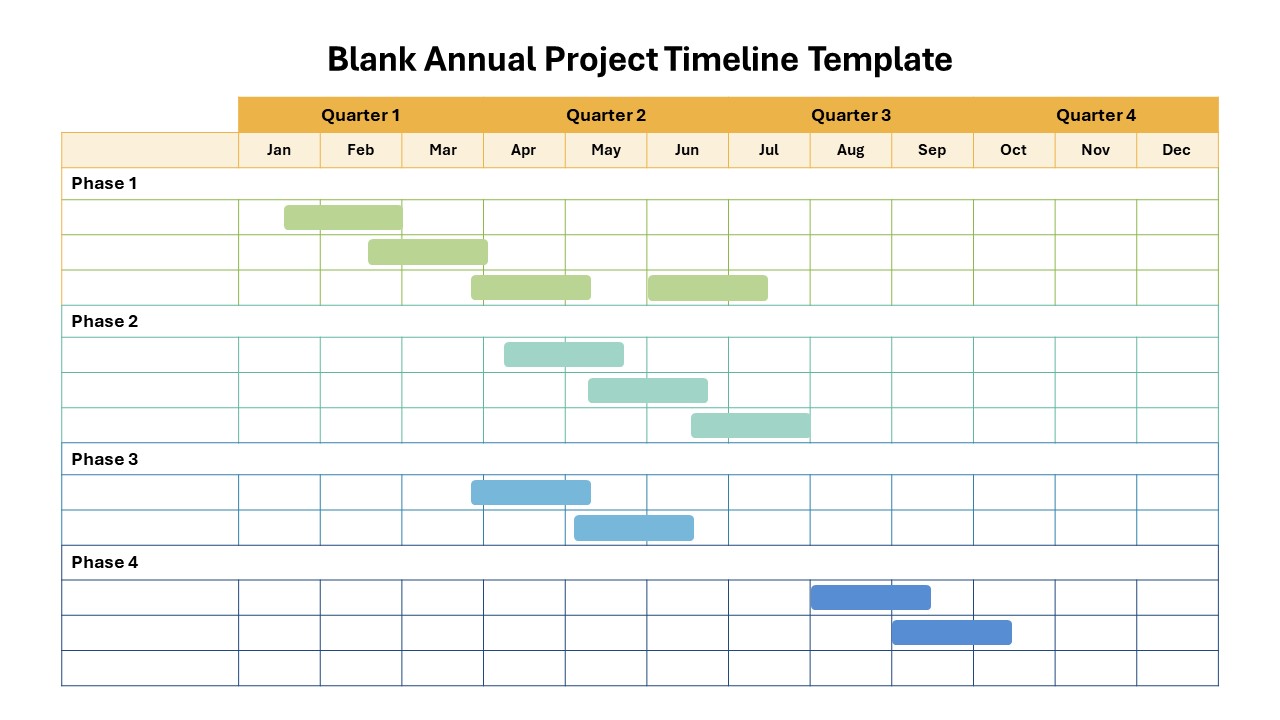
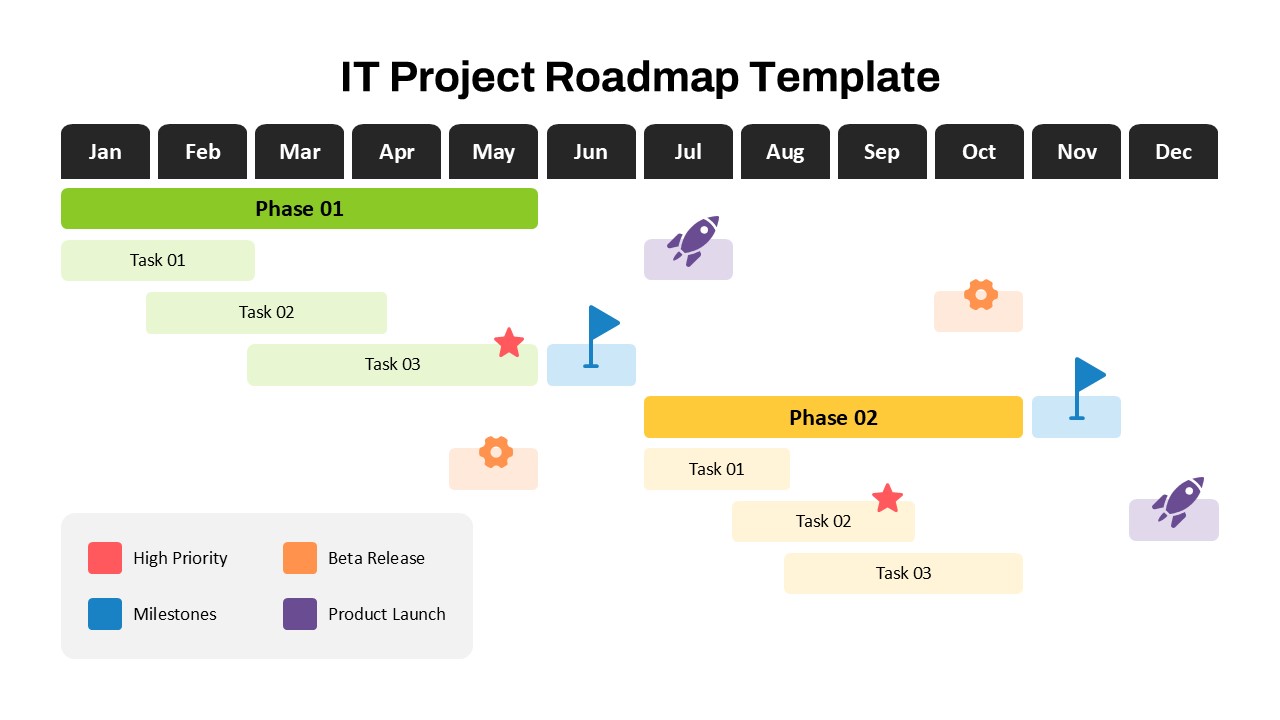
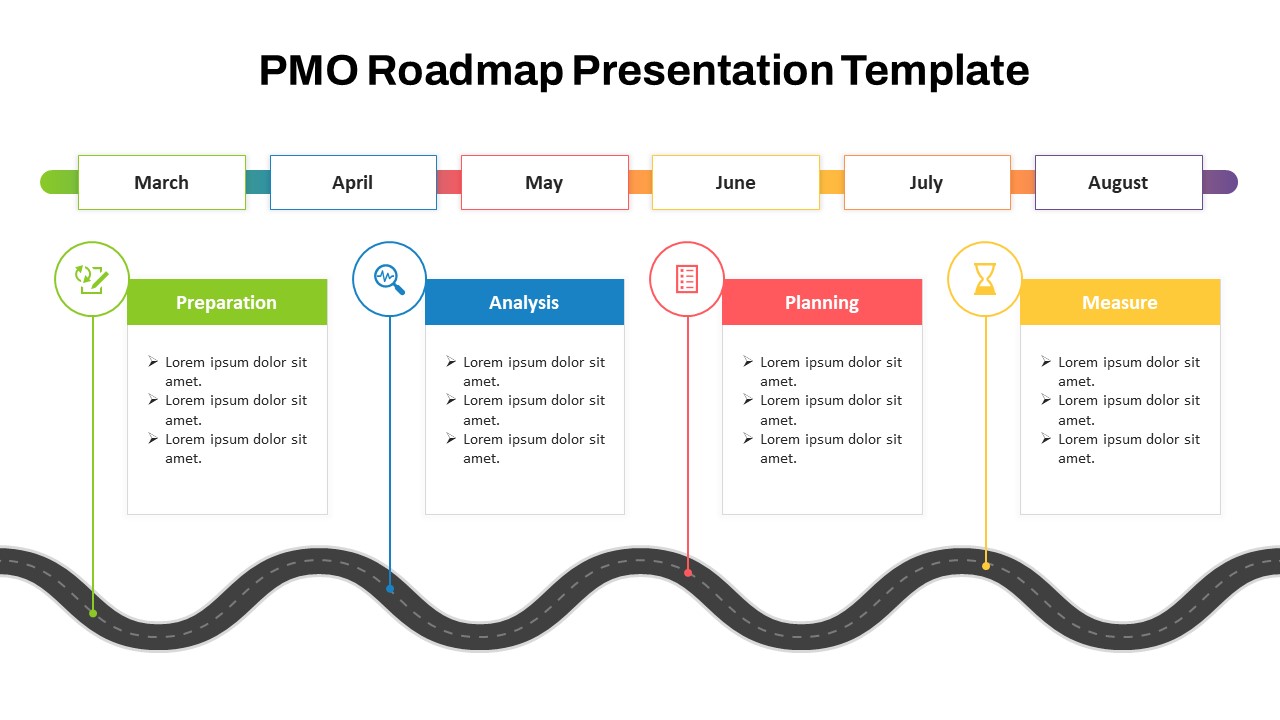
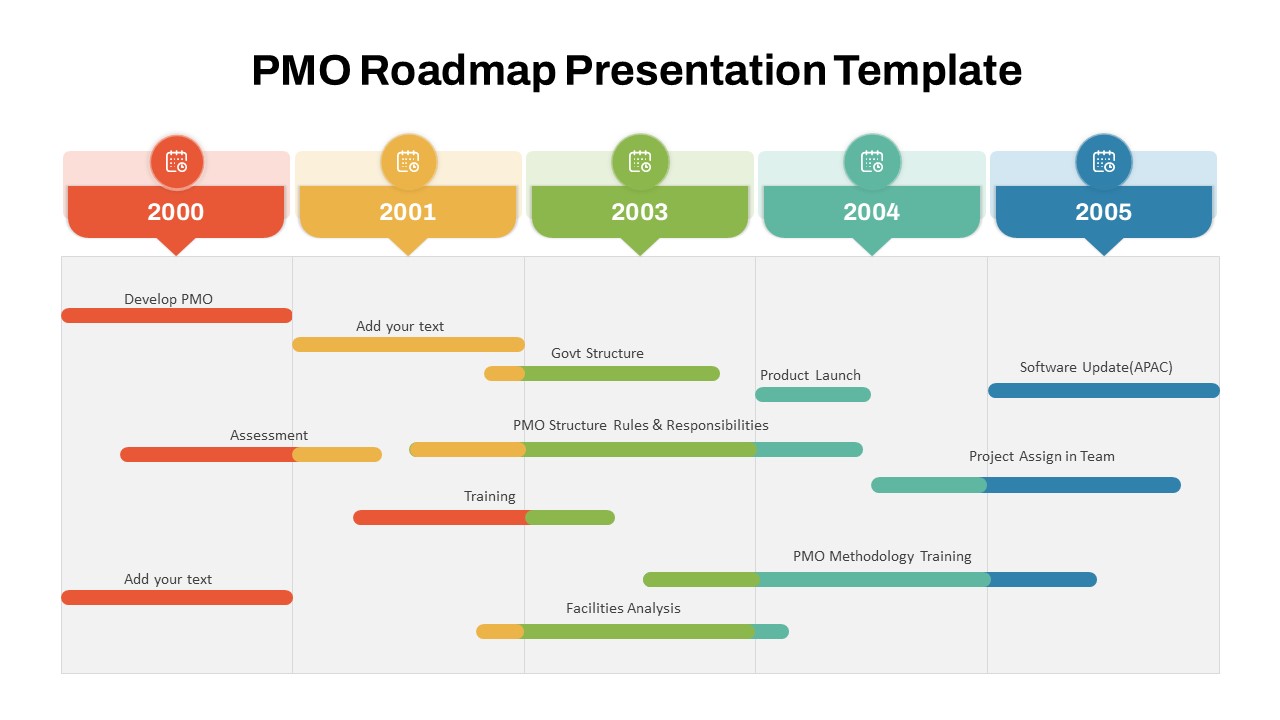
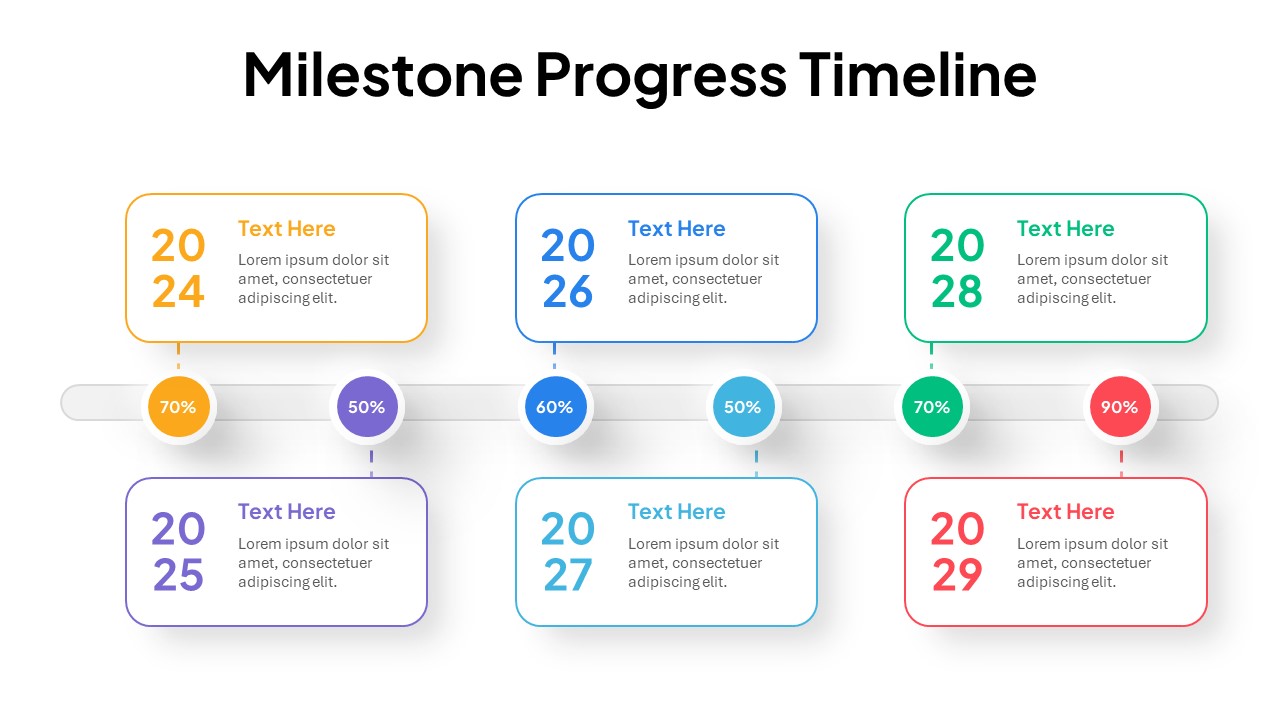
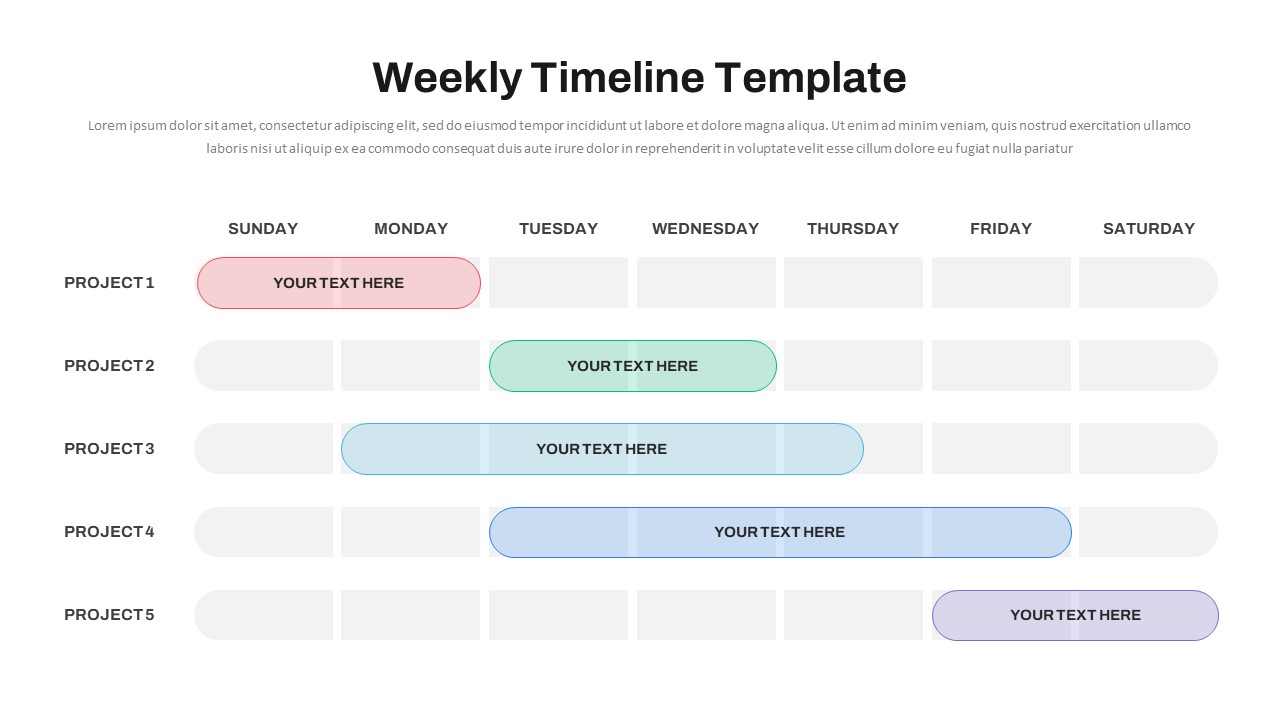
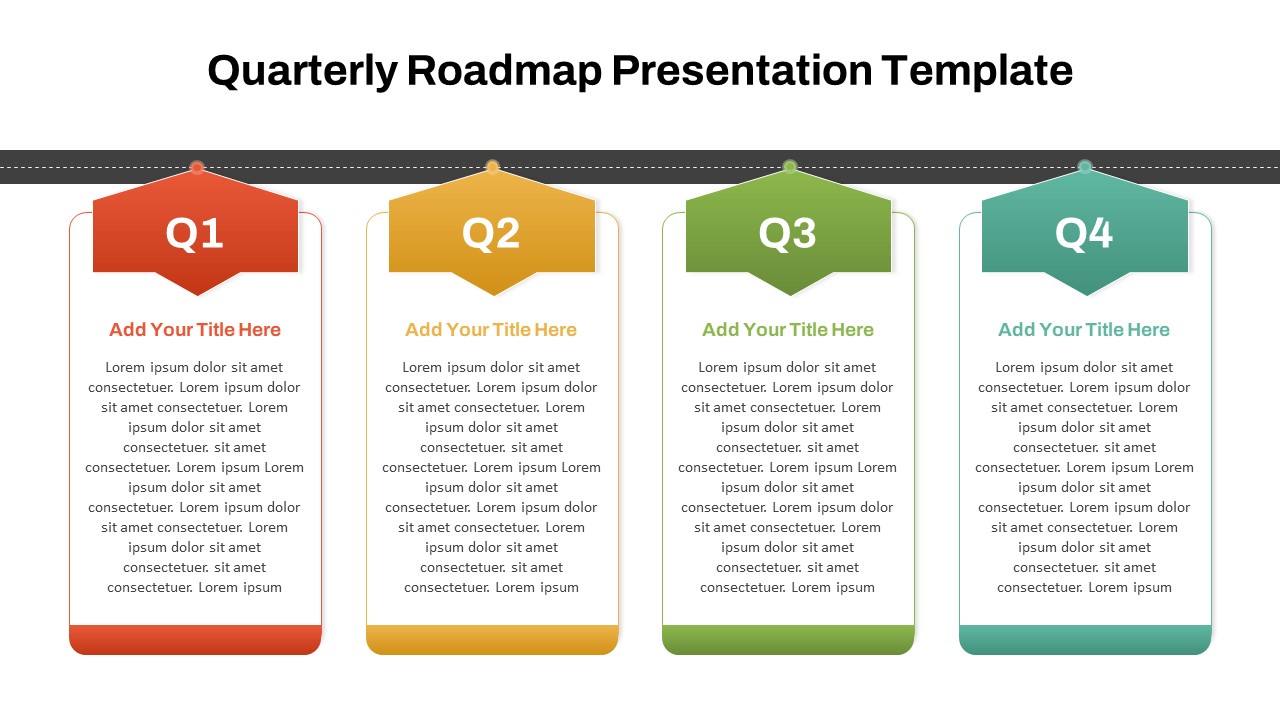
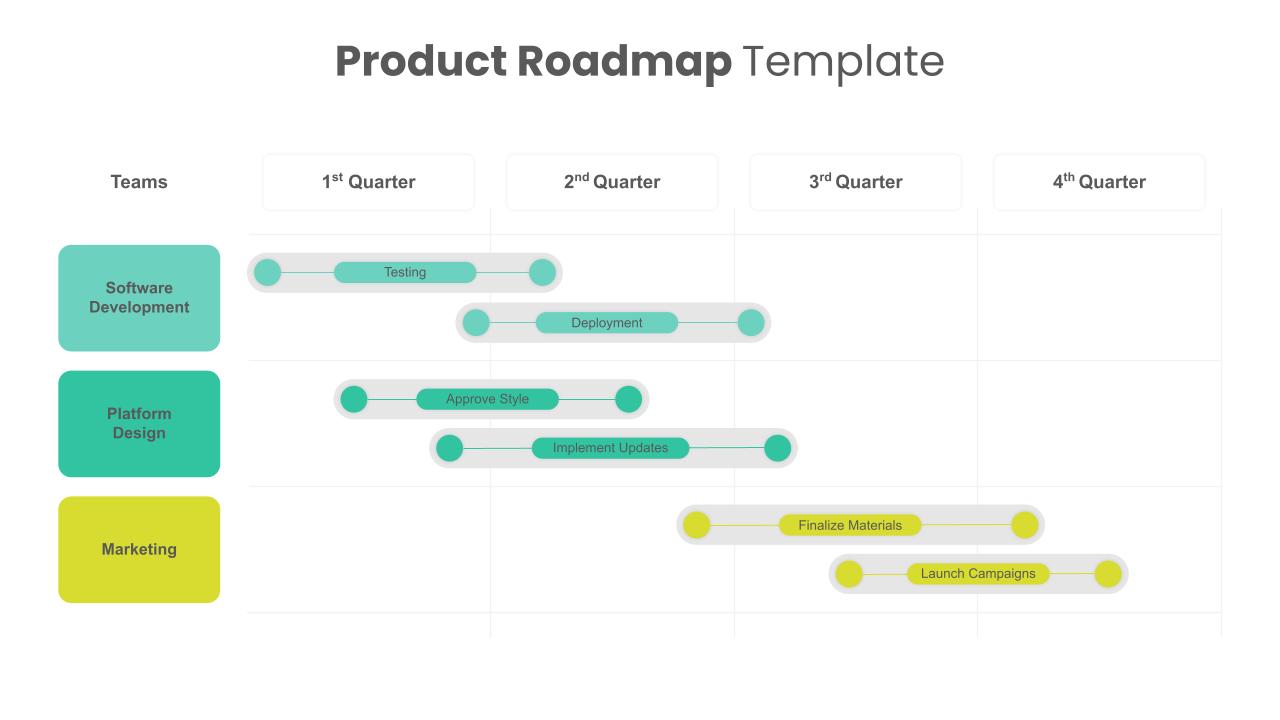
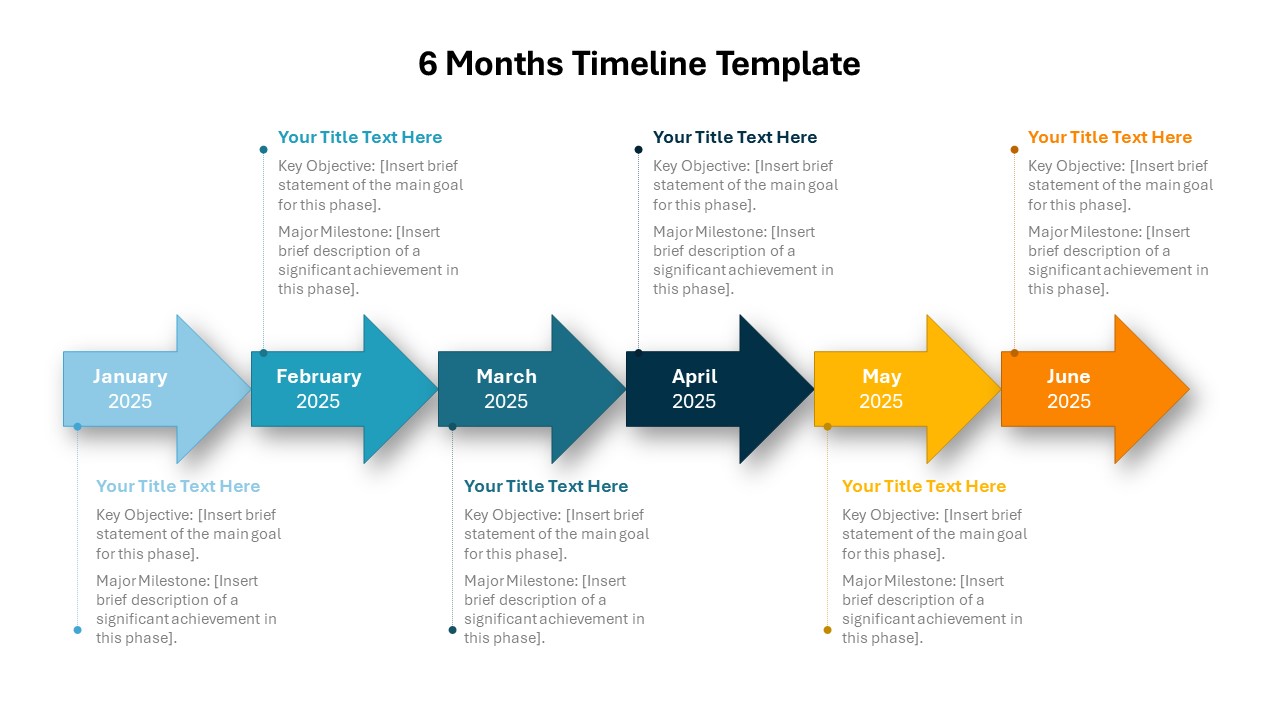
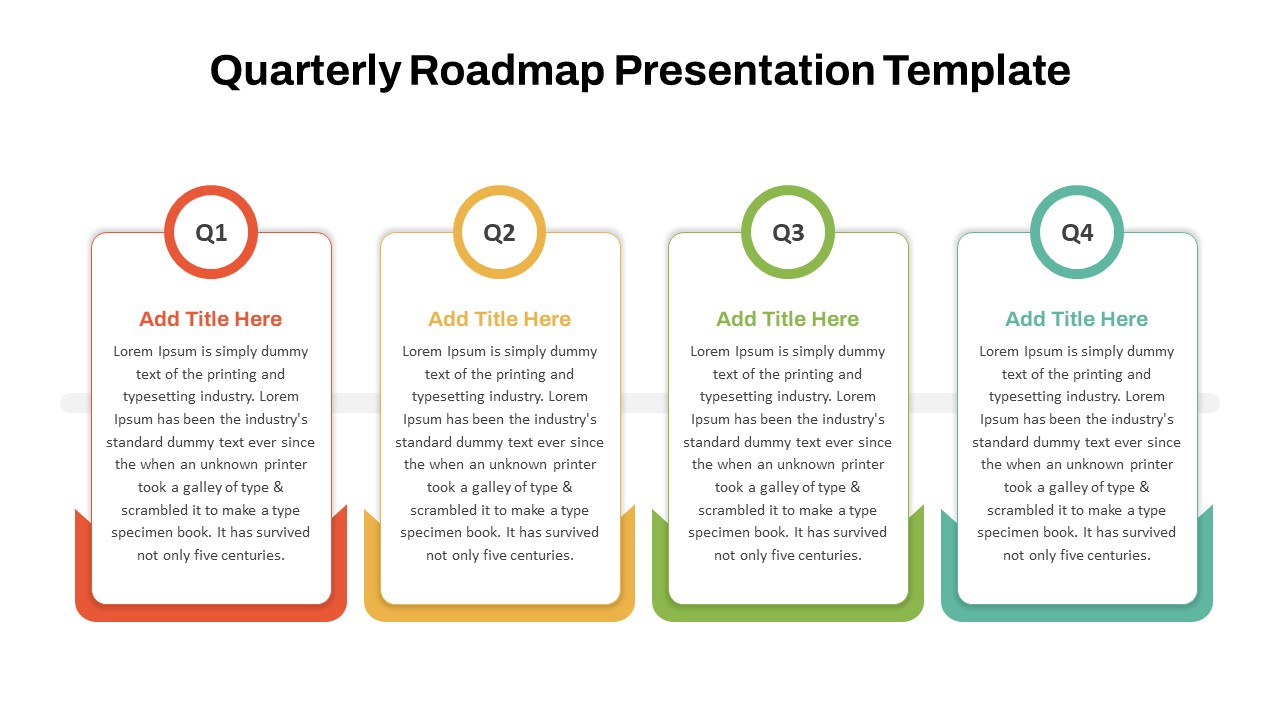
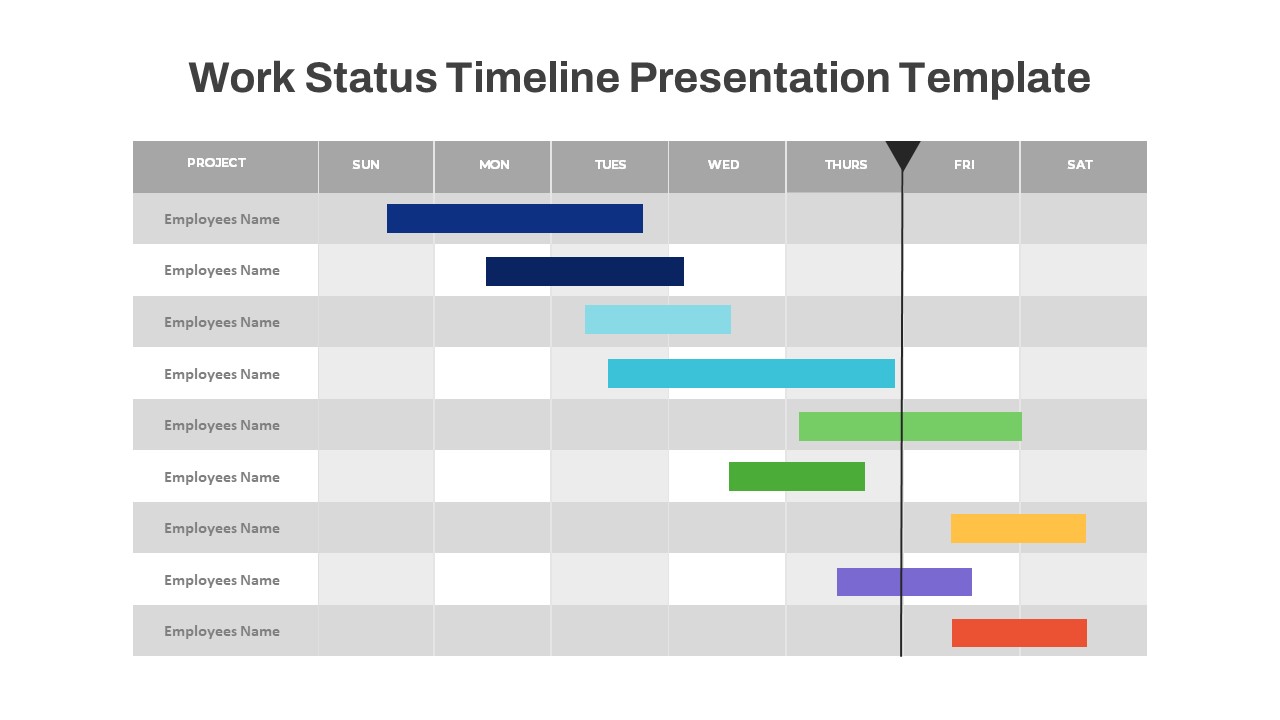
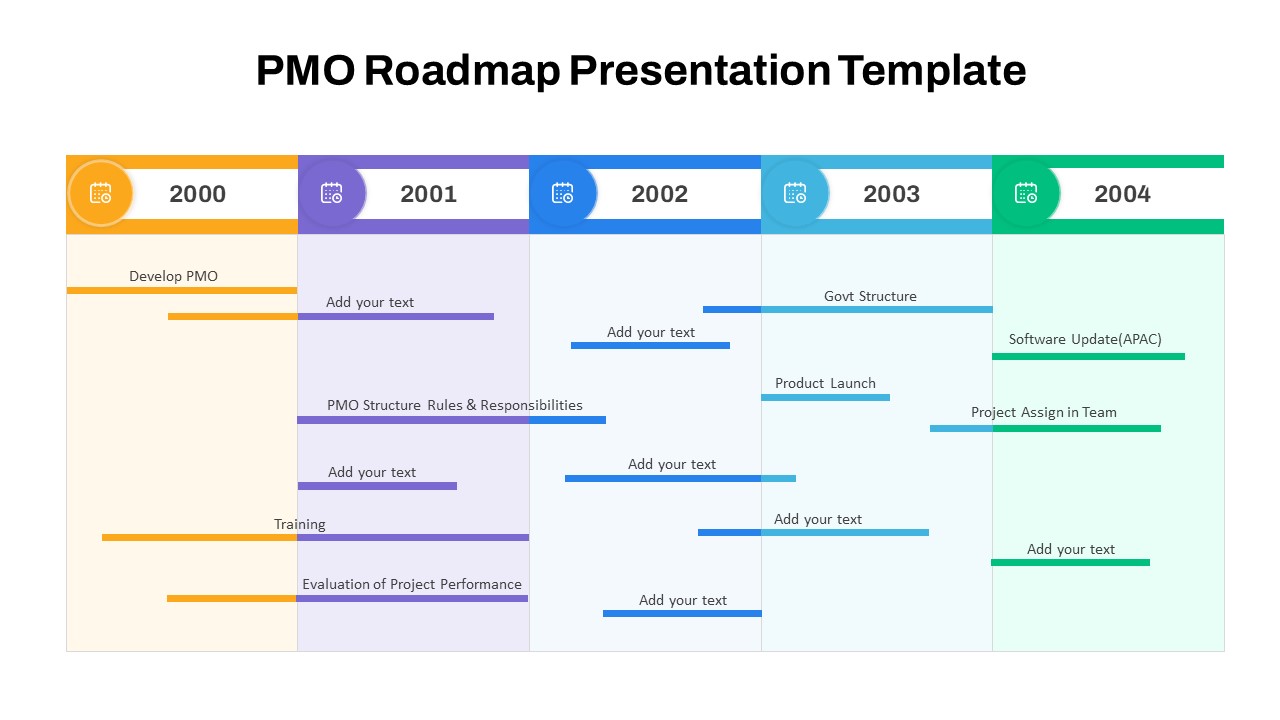
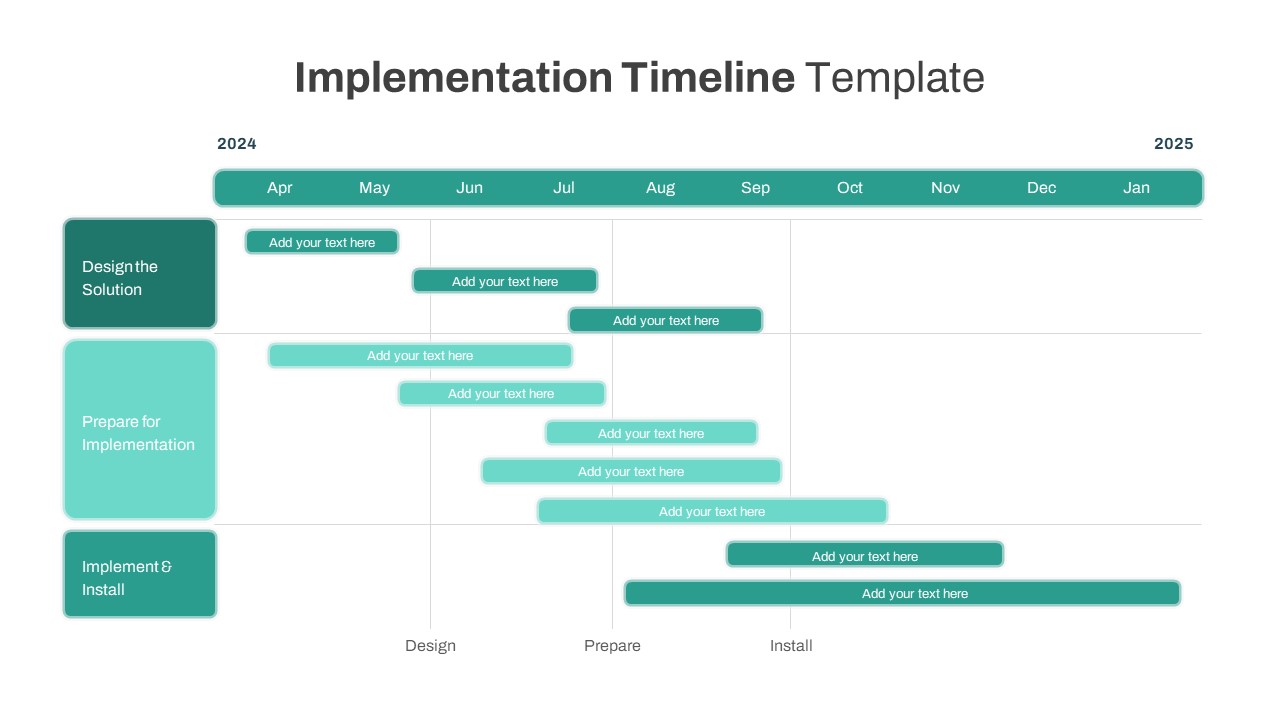
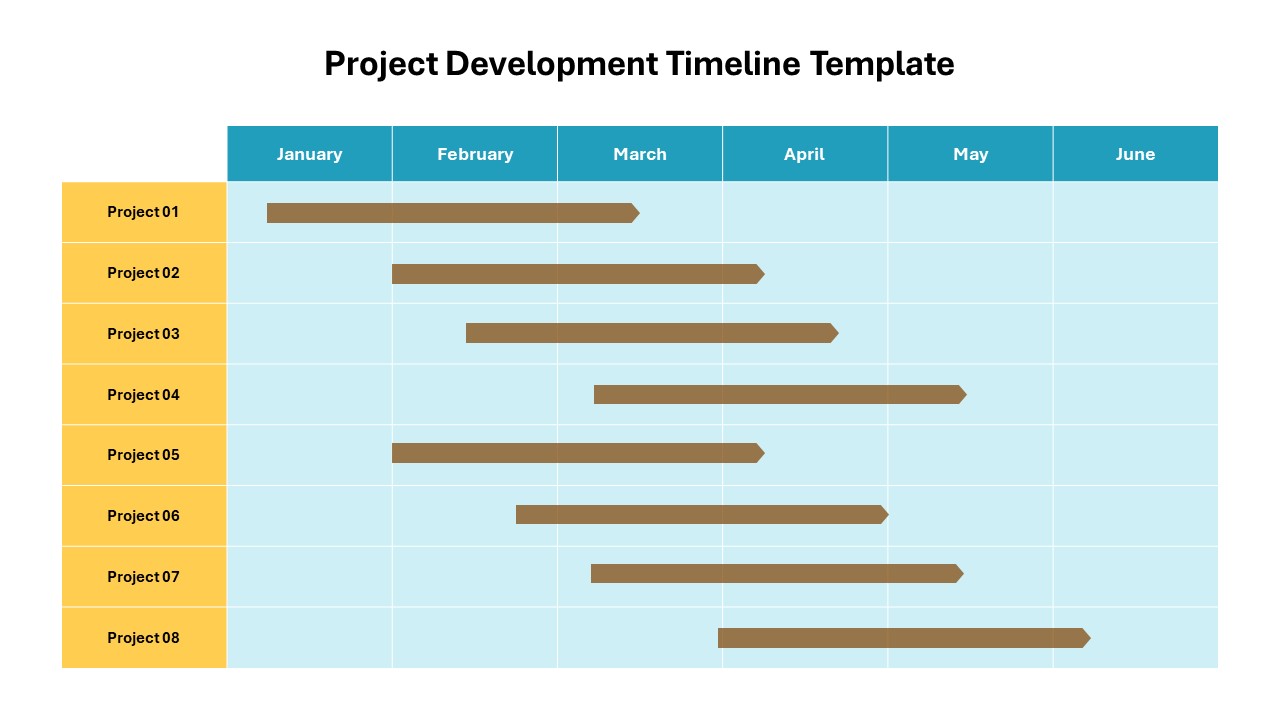
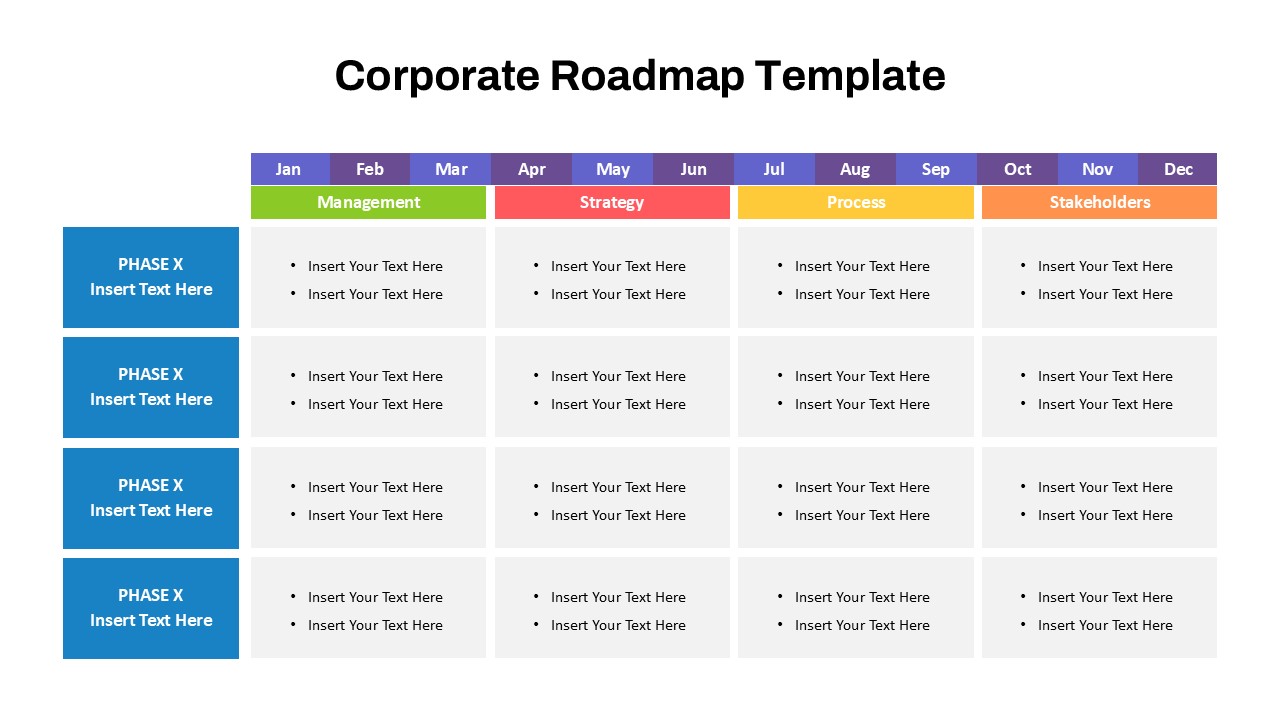
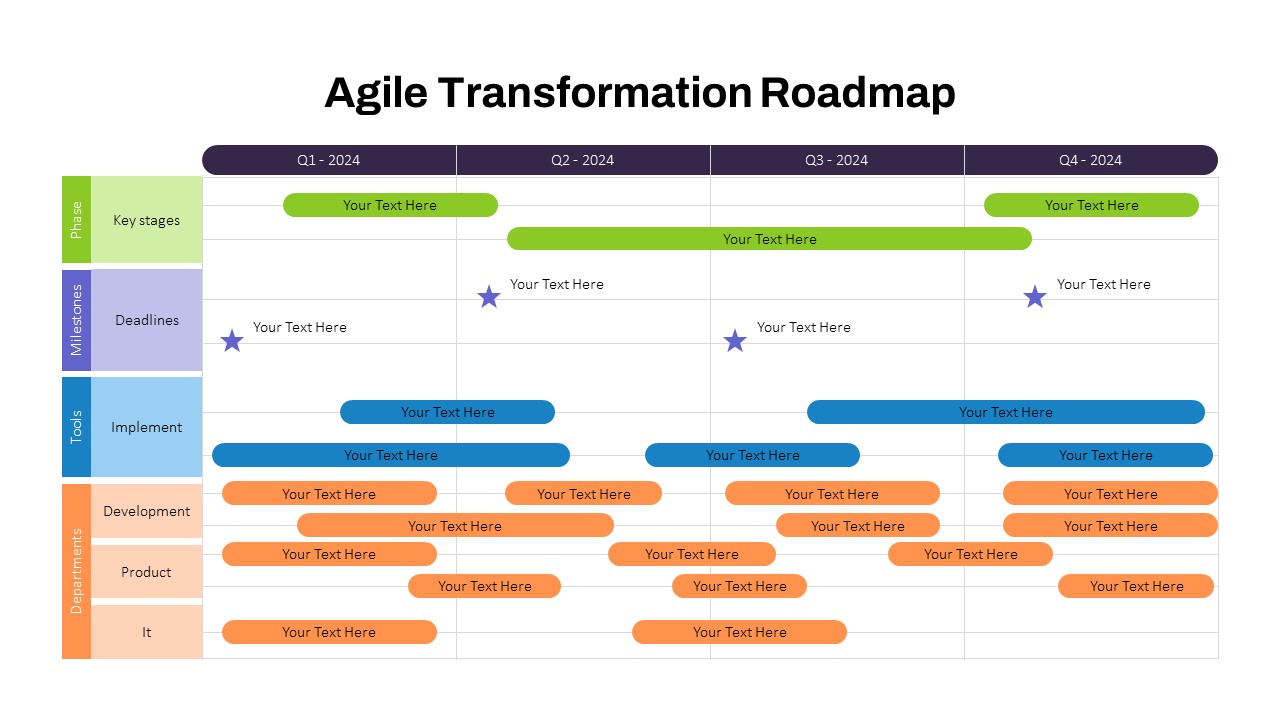
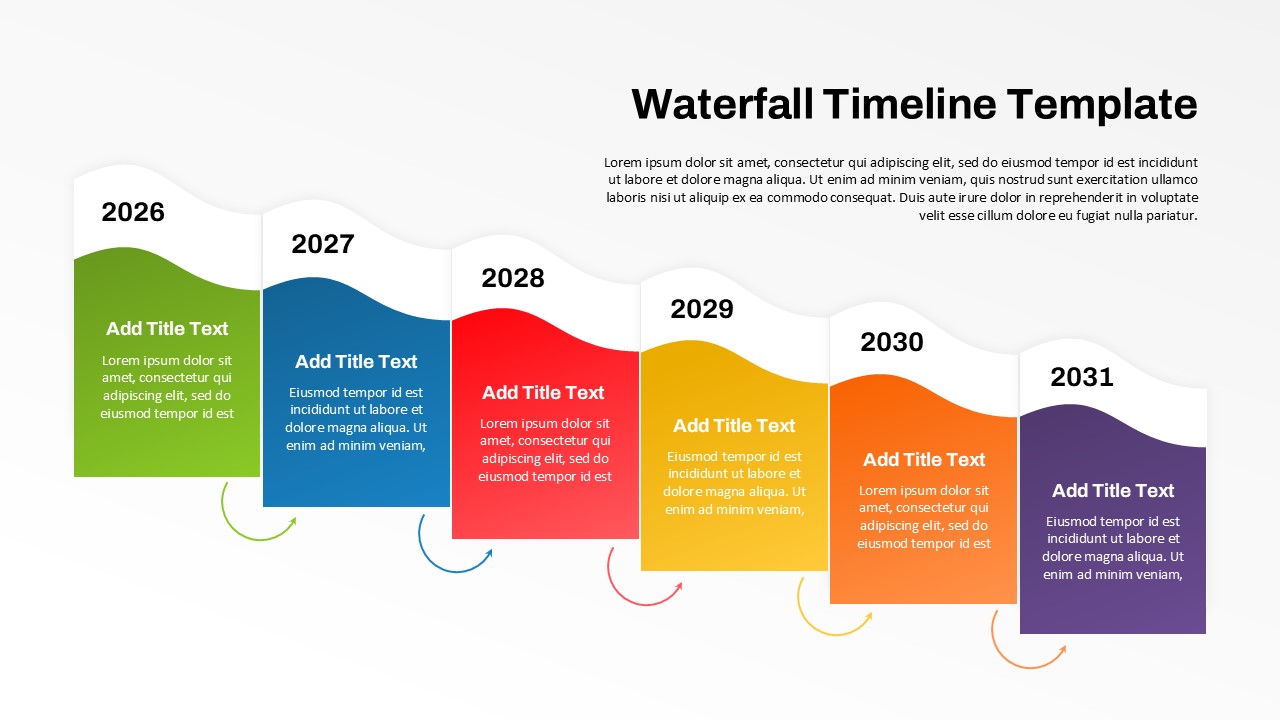
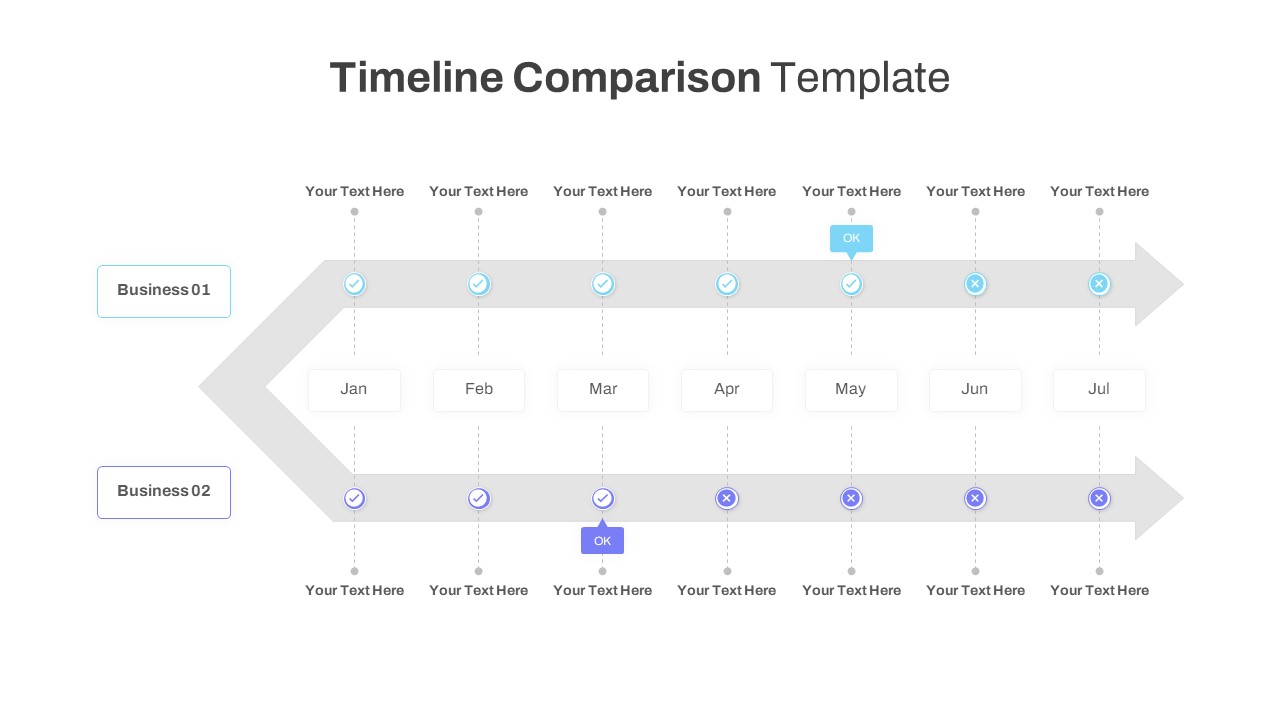
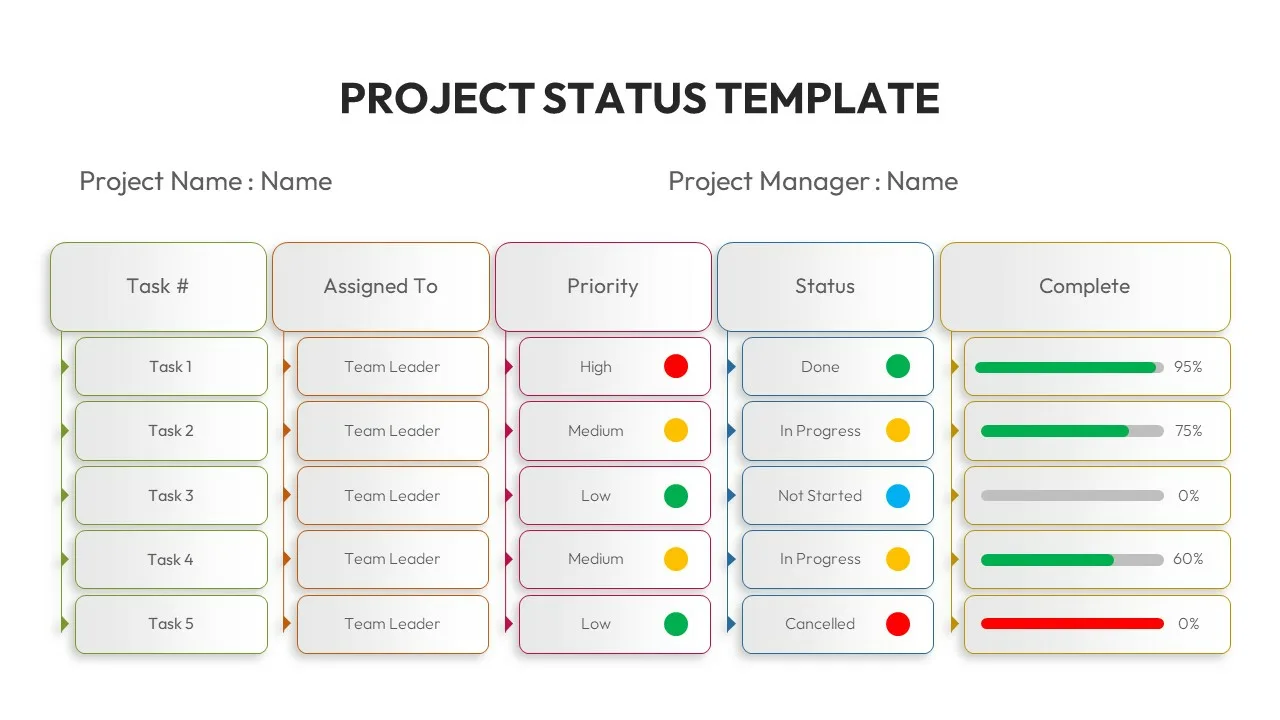
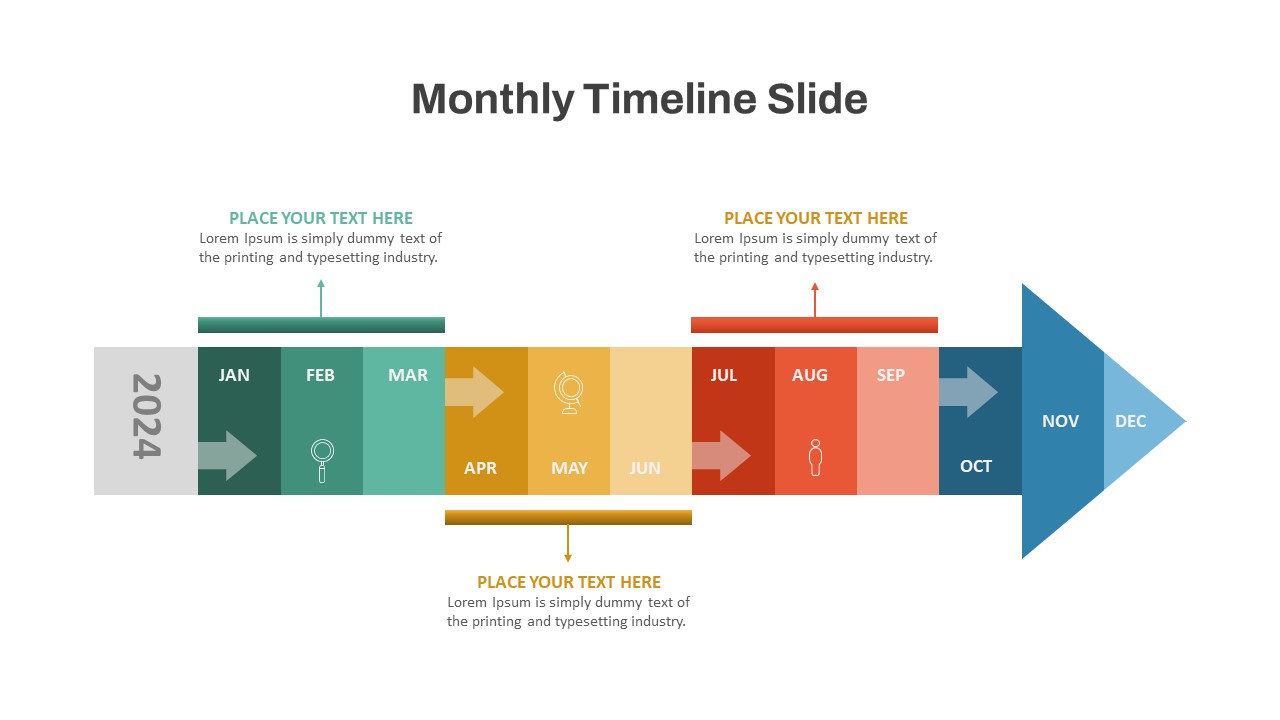
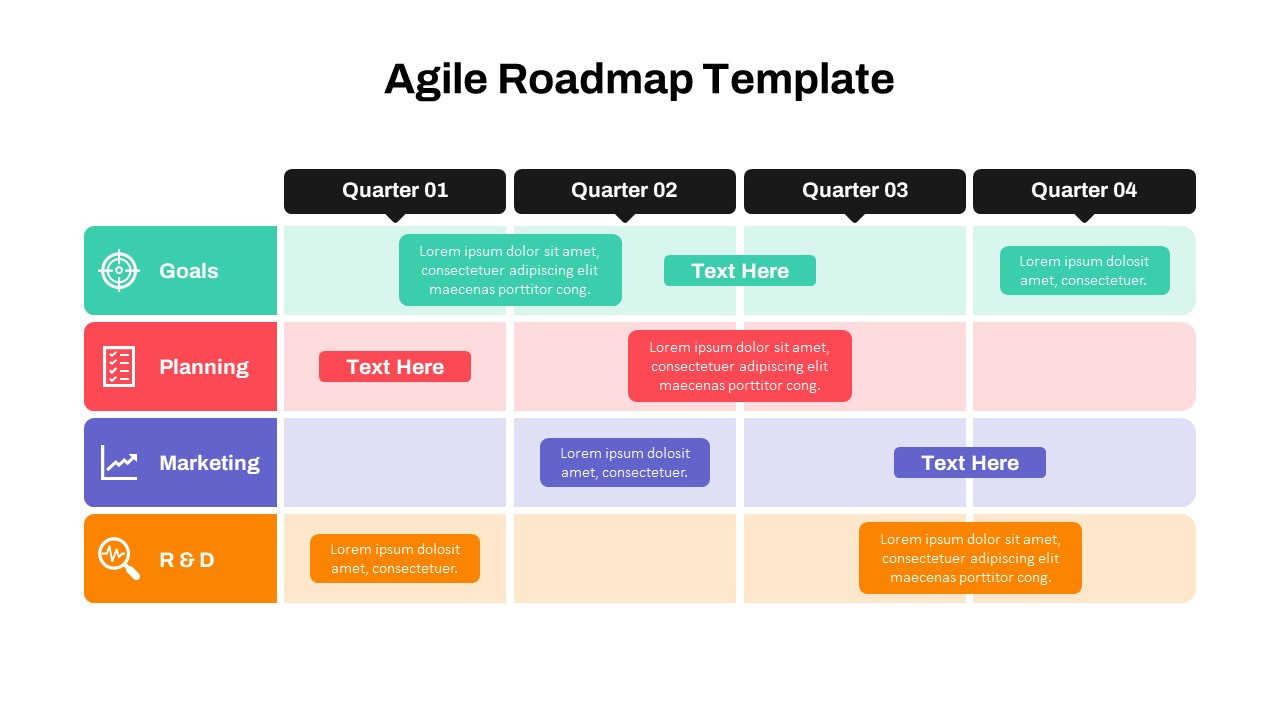
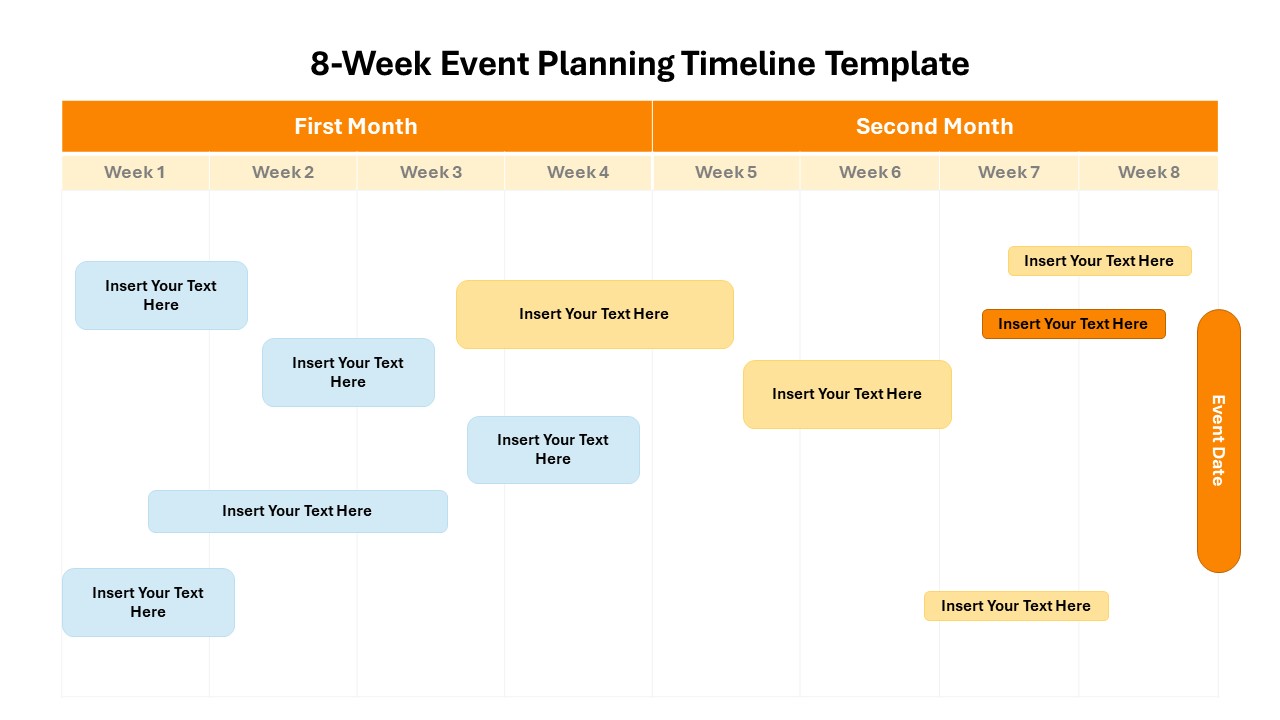
The Gantt Chart PowerPoint Template is a powerful tool for visualizing project timelines and tracking progress across various tasks or products. This power point Gantt chart template is ideal for project managers, team leaders, and business strategists who need to outline project phases, monitor deadlines, and coordinate team efforts over a given time period. Its design is structured by quarters, making it perfect for annual or multi-quarter projects, with distinct, color-coded bars representing different products or tasks.
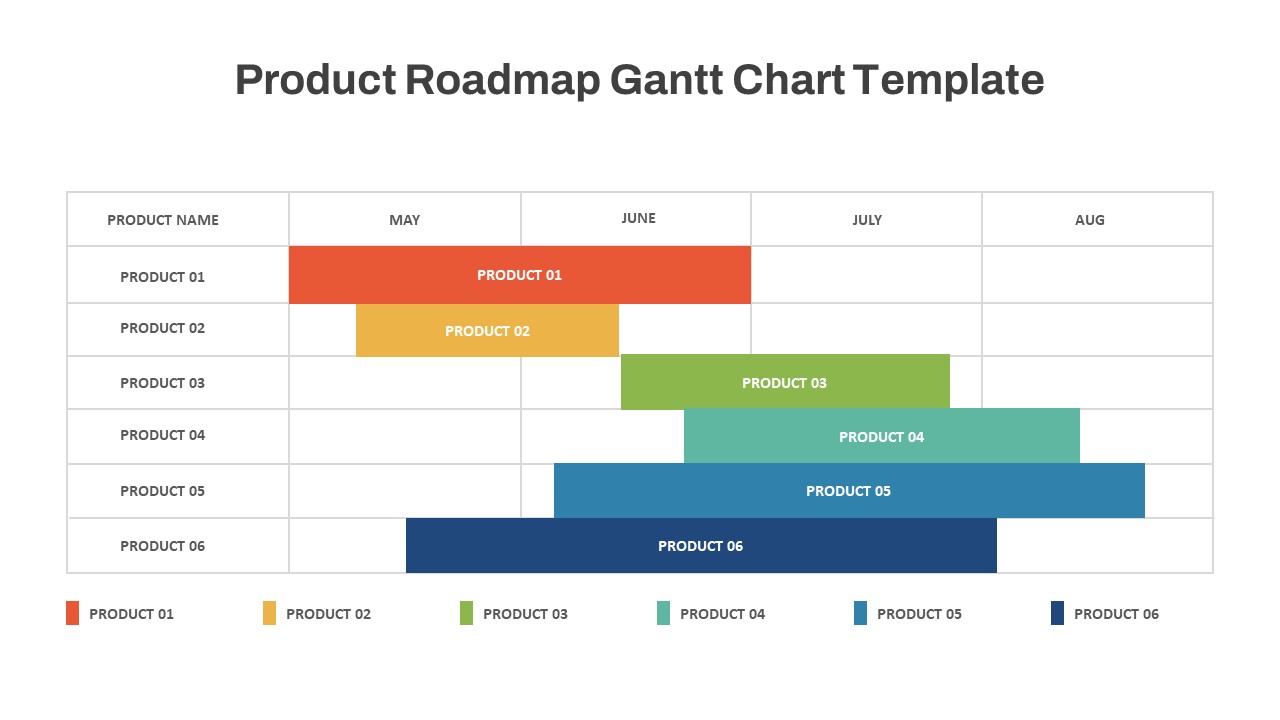
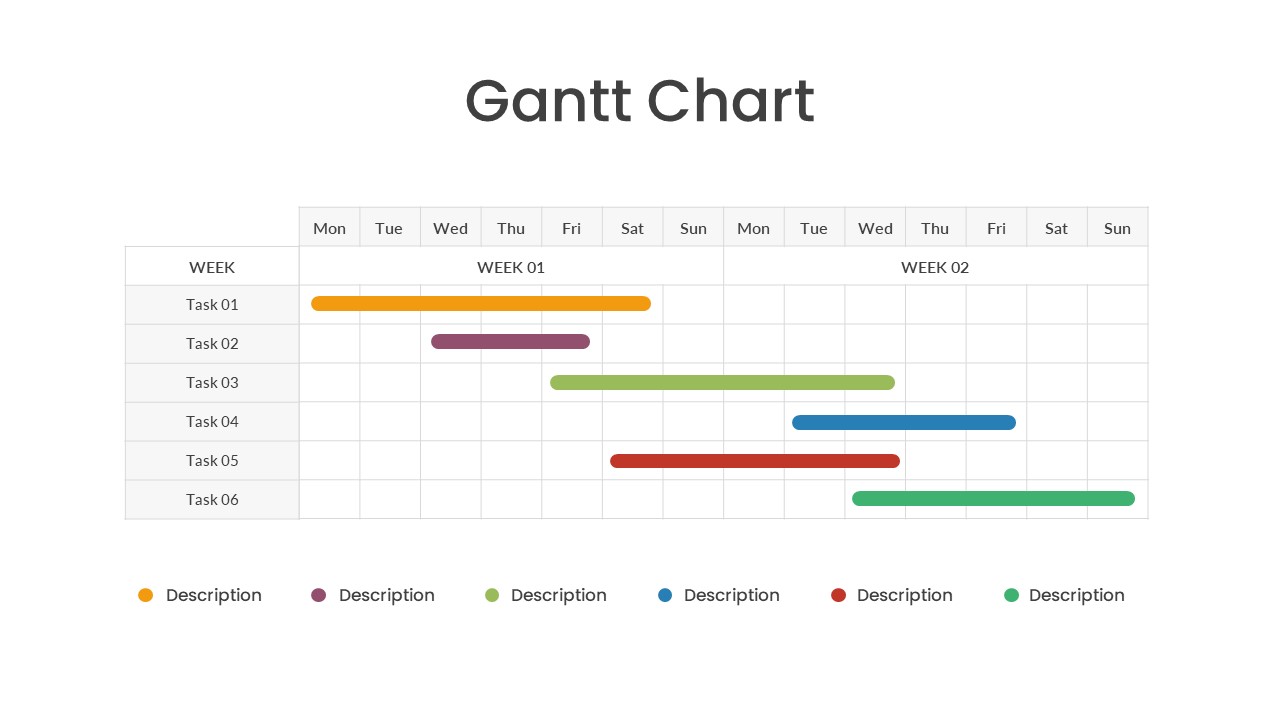
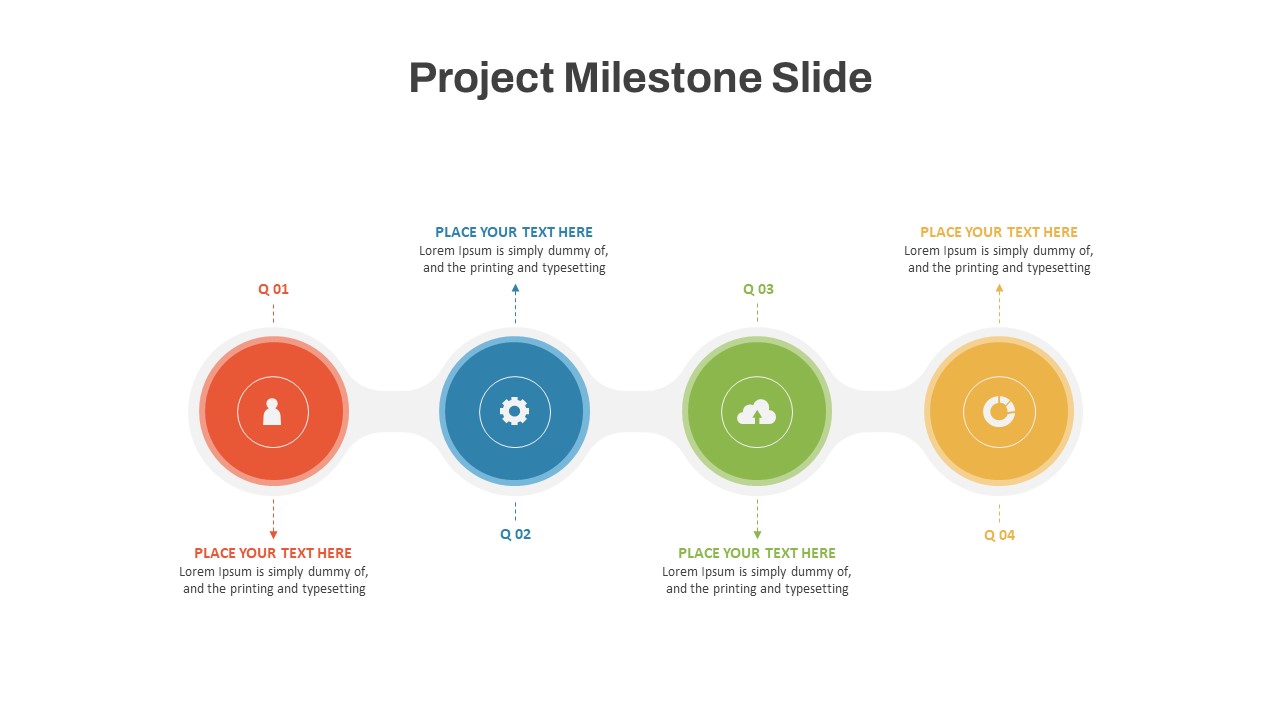
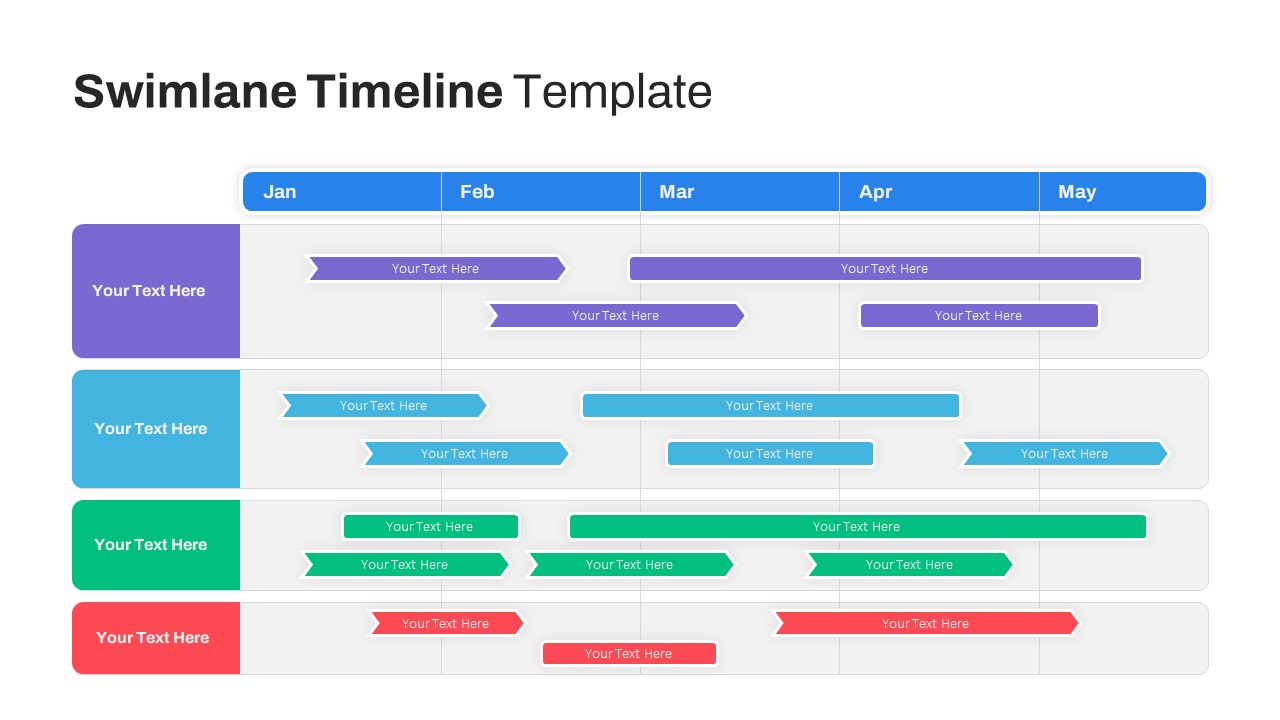
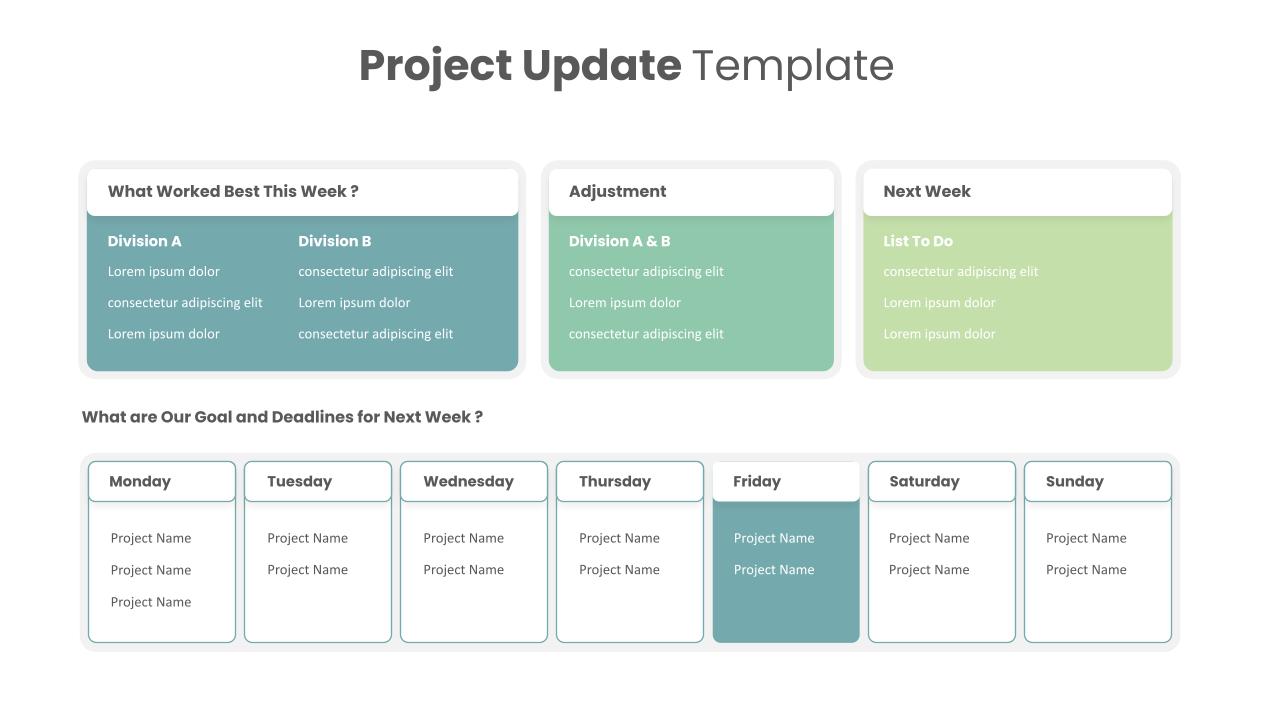
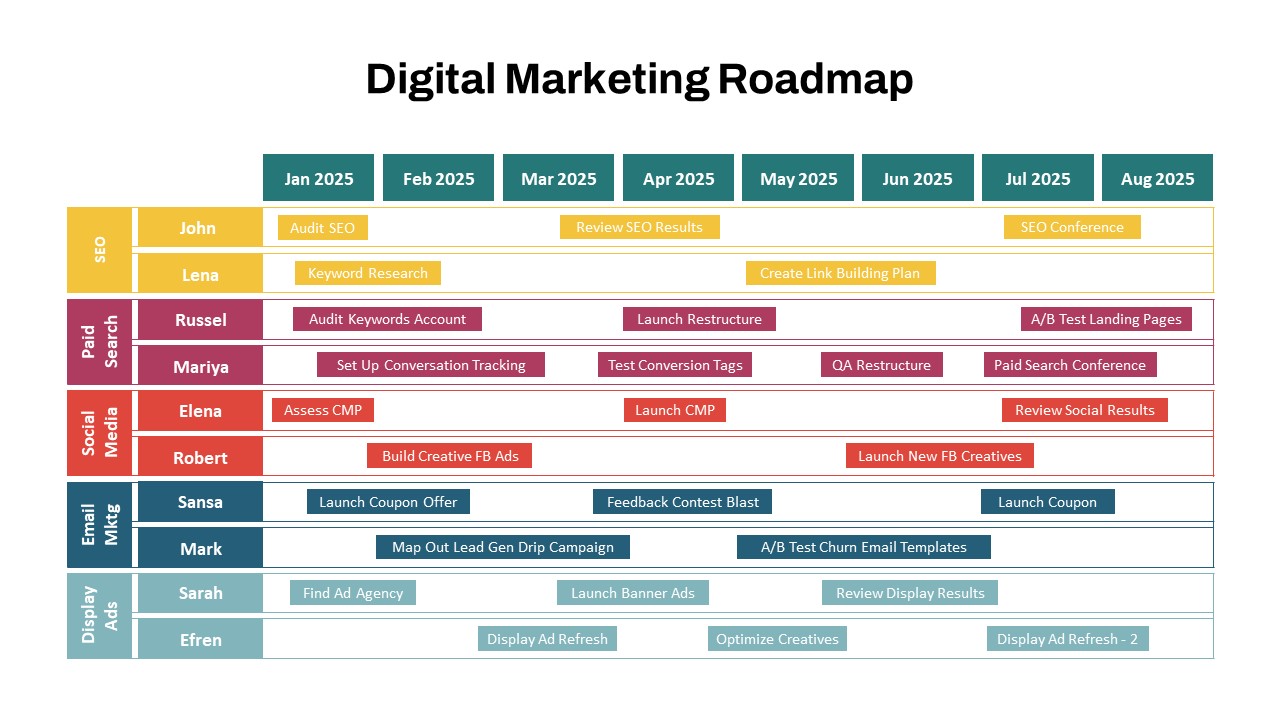
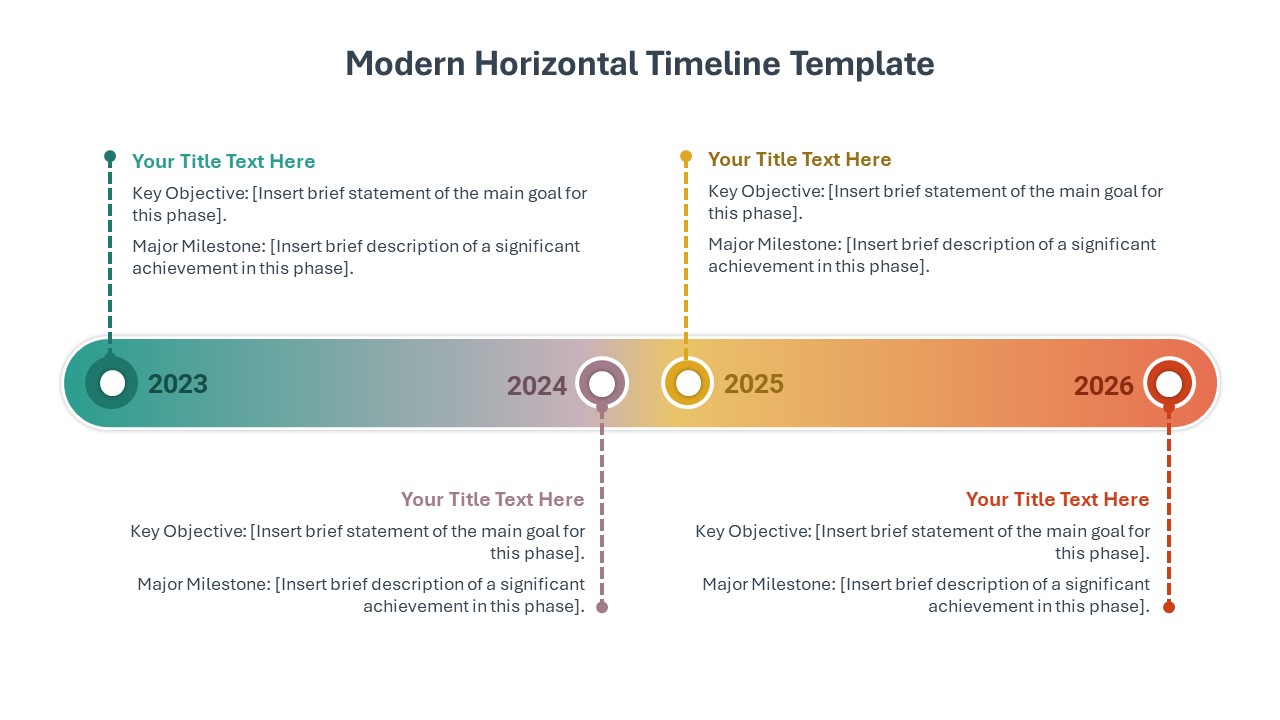
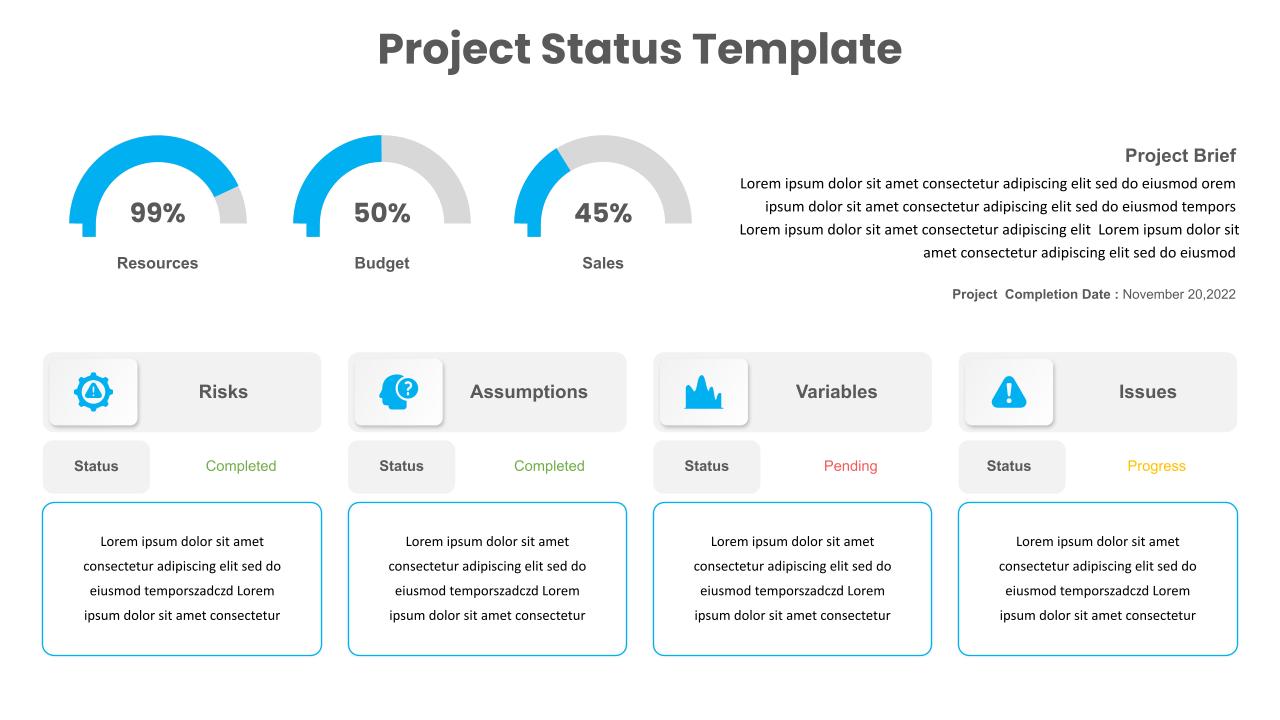
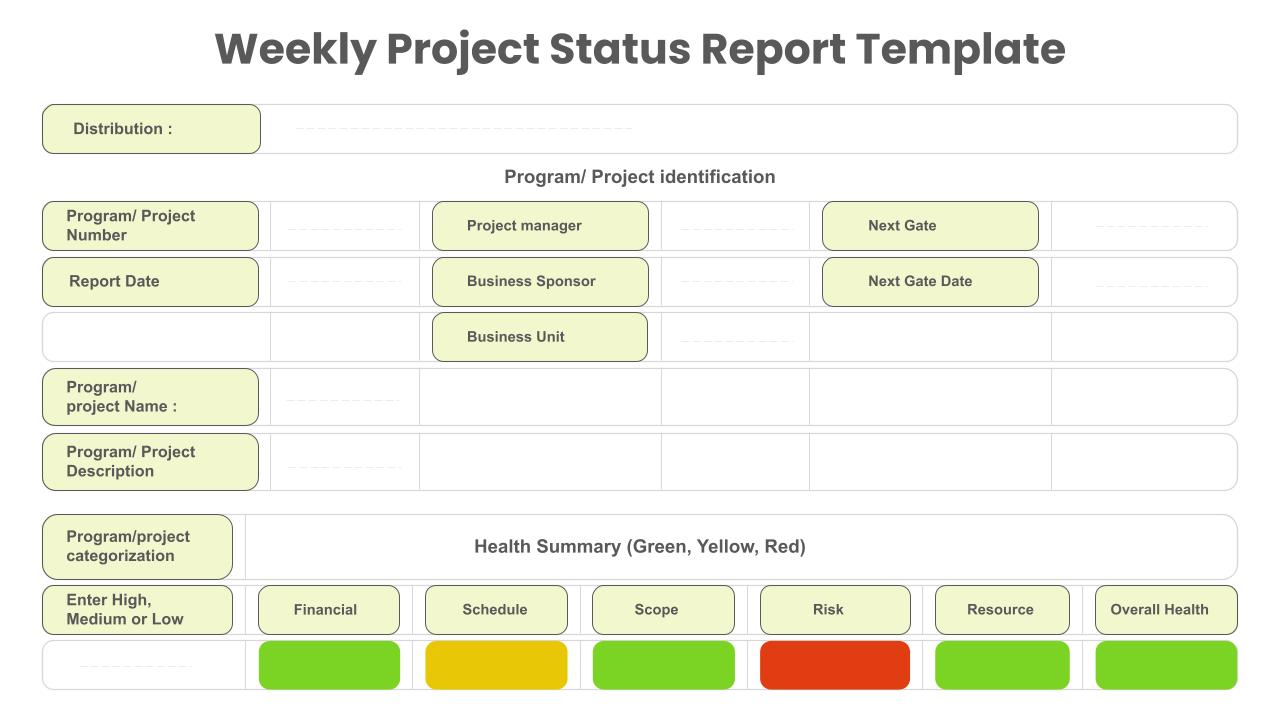
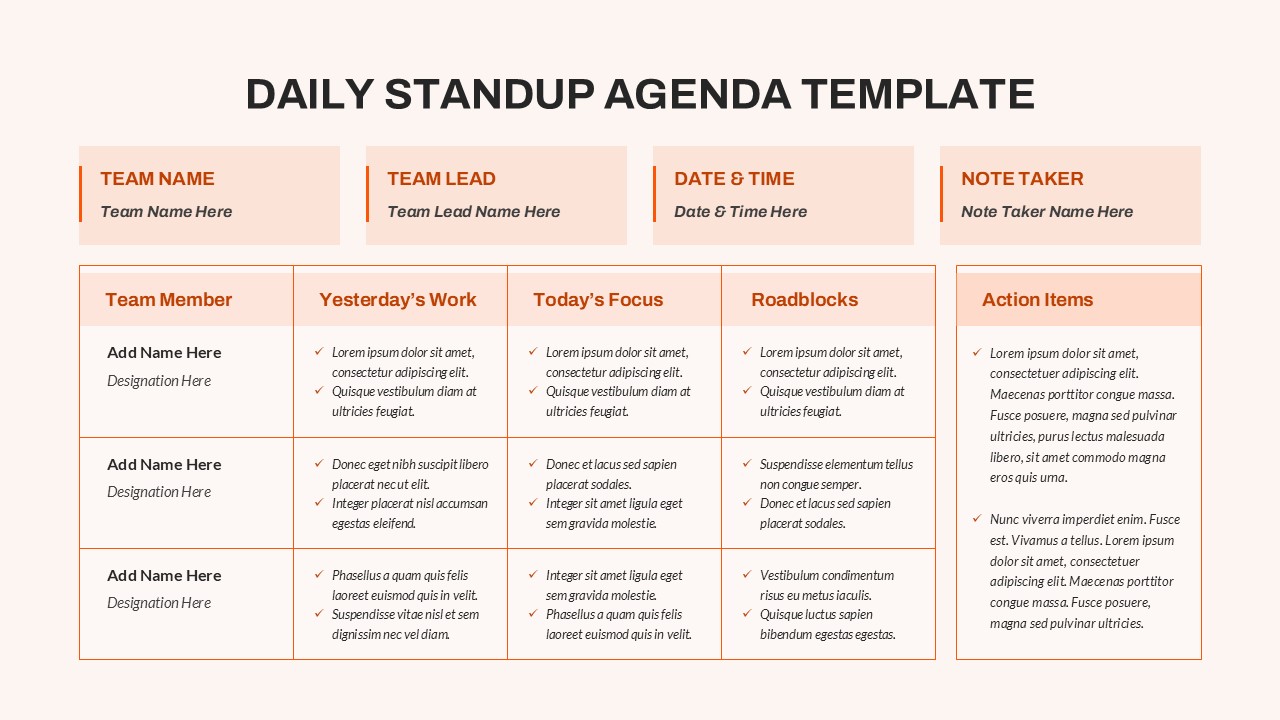
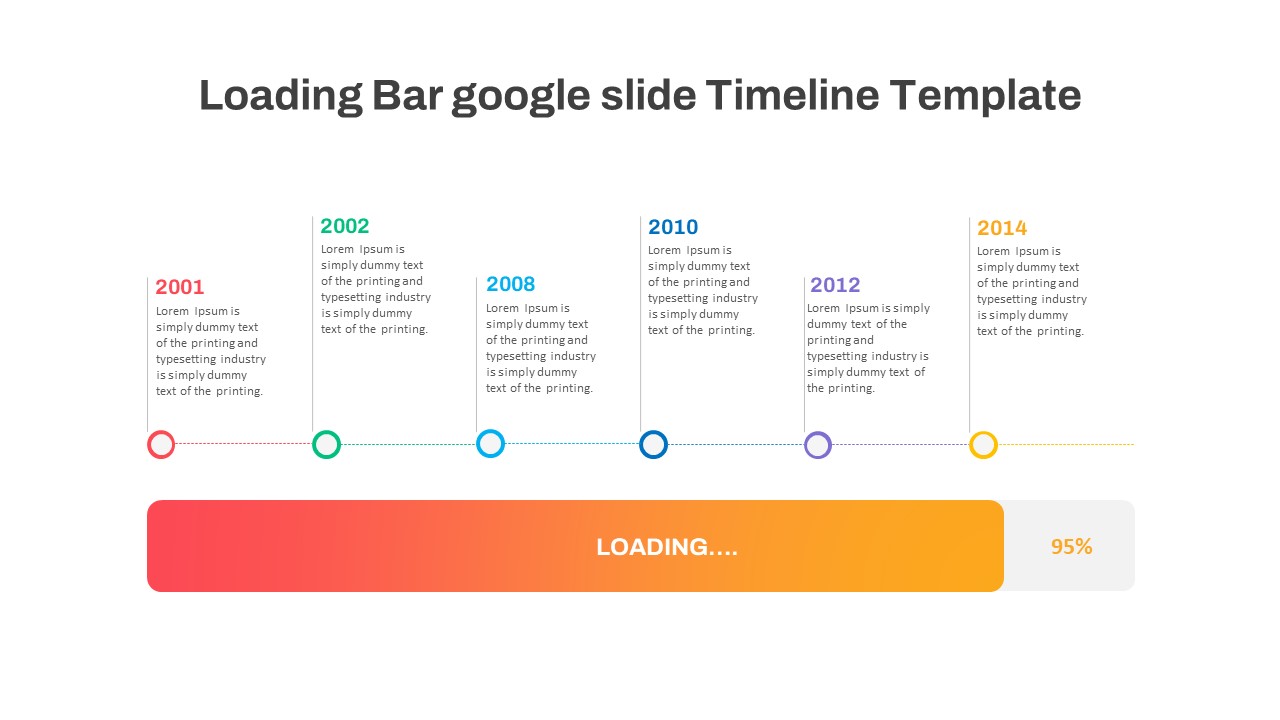
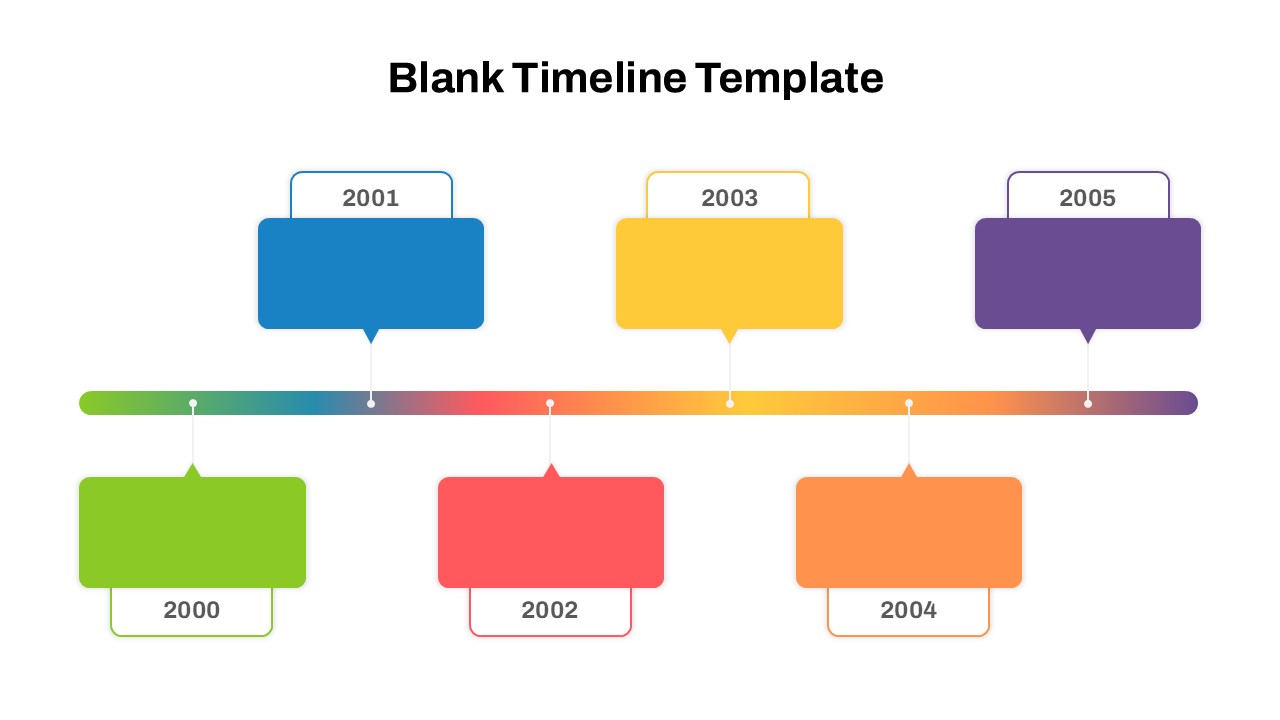
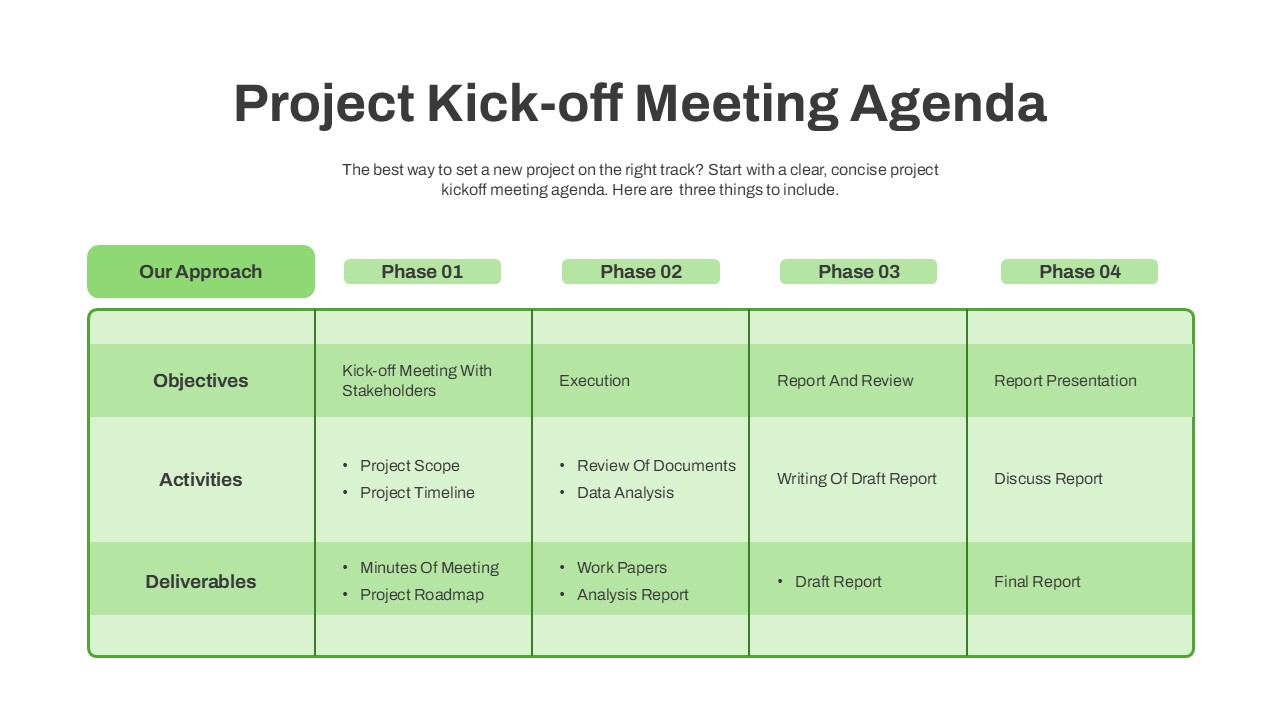
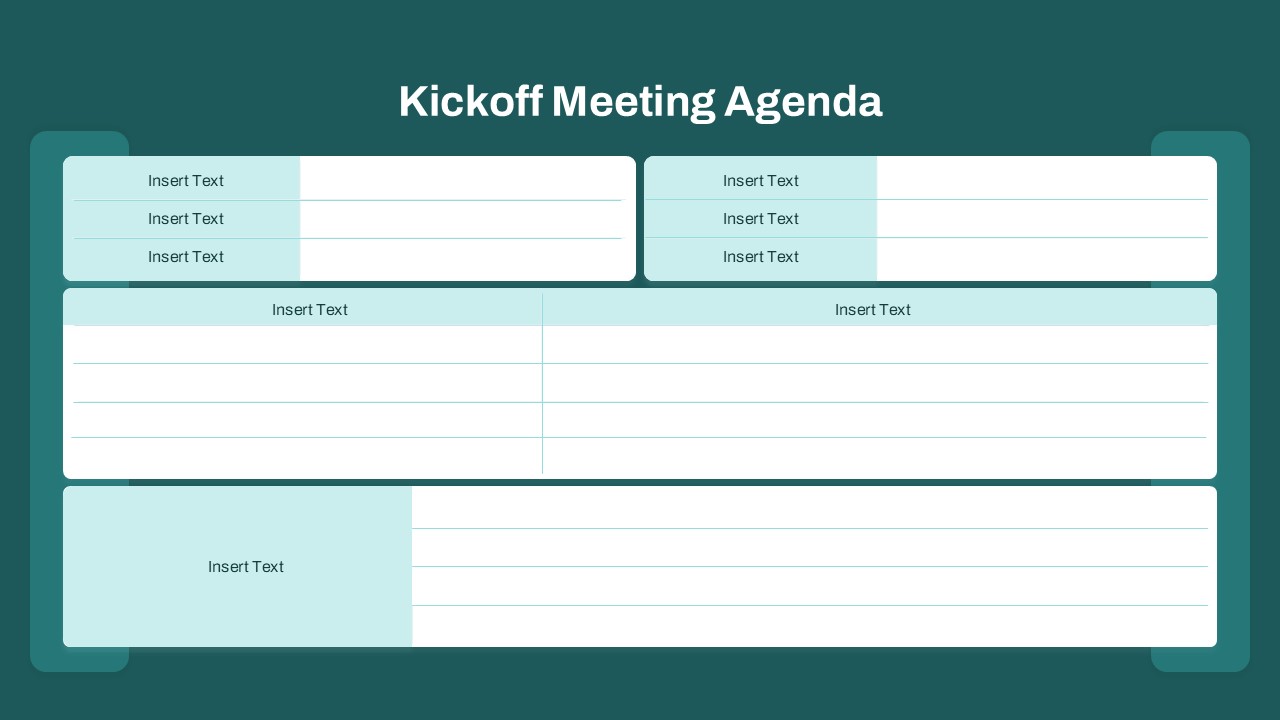
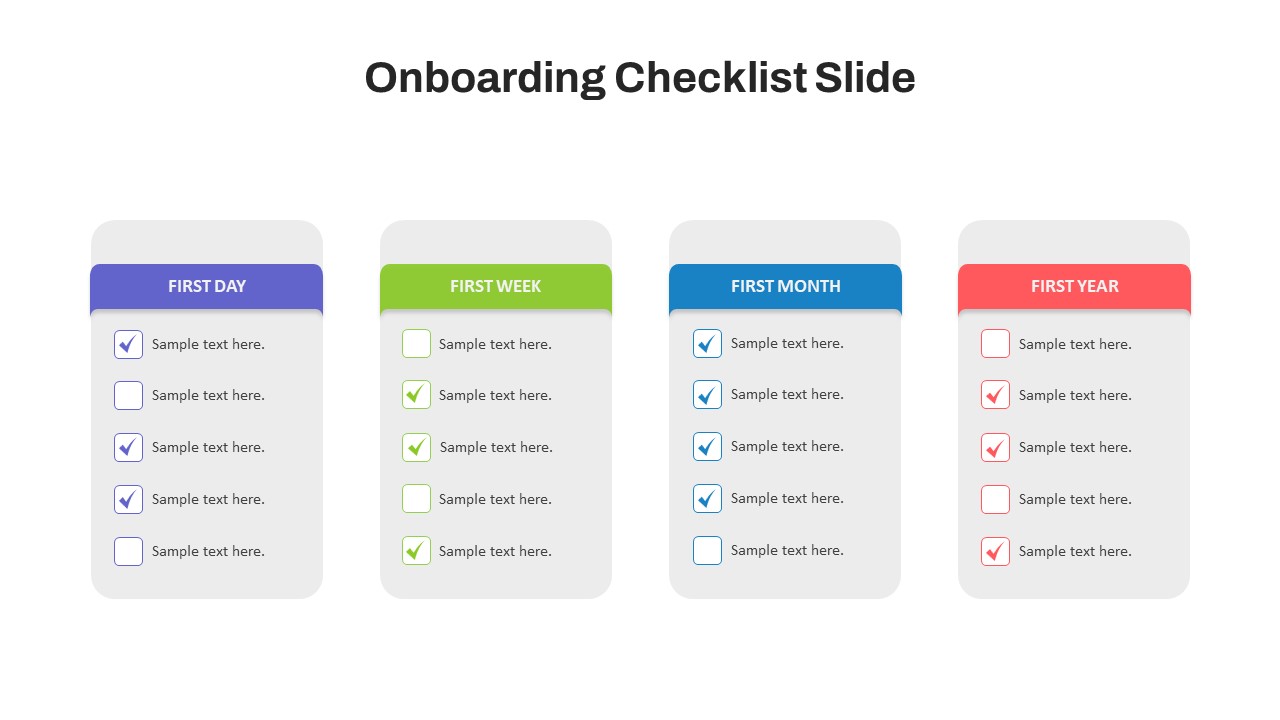
Each row is assigned to a different product, task, or team, while the timeline is split into four quarters, clearly displaying the start and end points of each activity. The color-coded bars allow easy differentiation between various phases or tasks, while also indicating progress in a visually appealing manner. Whether you’re managing a product launch, tracking multiple client projects, or organizing a marketing campaign, this Gantt chart provides an intuitive and structured way to keep everyone on the same page.
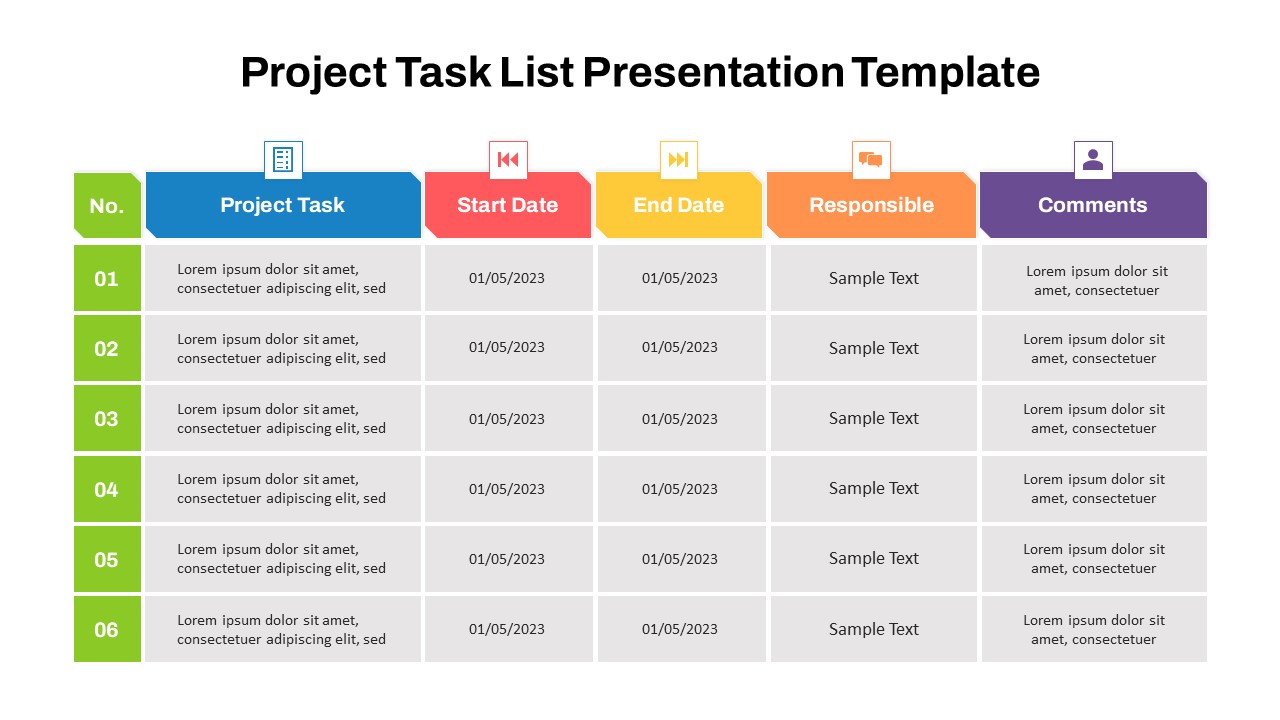
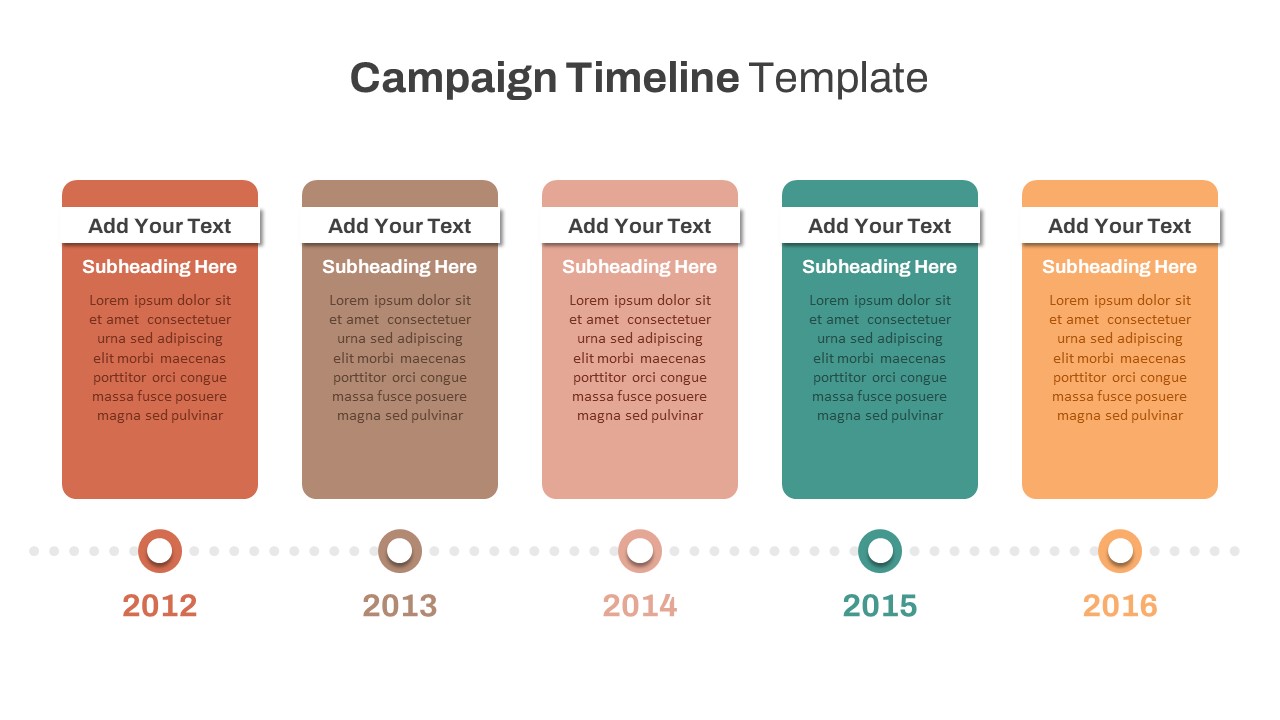
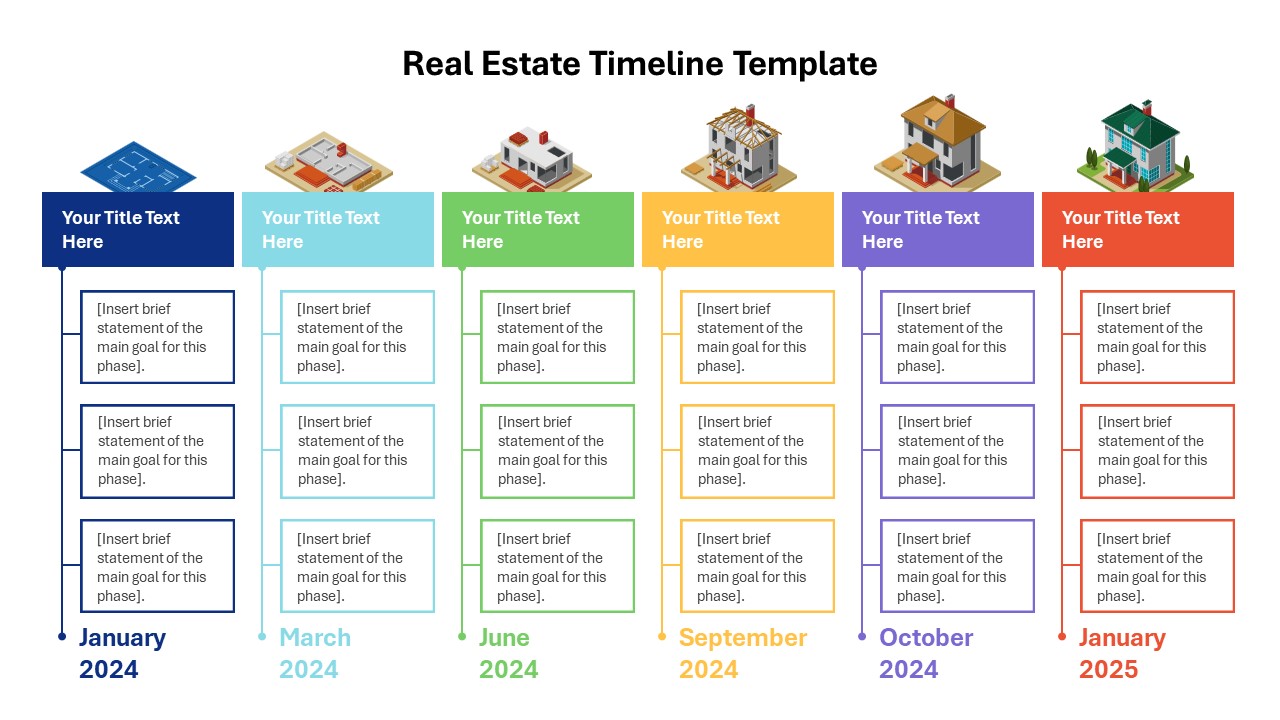
The template’s flexible design allows for the easy customization of text, dates, and project specifics, making it suitable for various industries, from tech development to event planning. Its clarity ensures that even complex, multi-faceted projects can be presented in a concise, organized manner, fostering better communication and team collaboration. Download now!
See more

Aspect Ratio
16:9Item ID
SKT01649
Features of this template
Other User Cases of the Template:
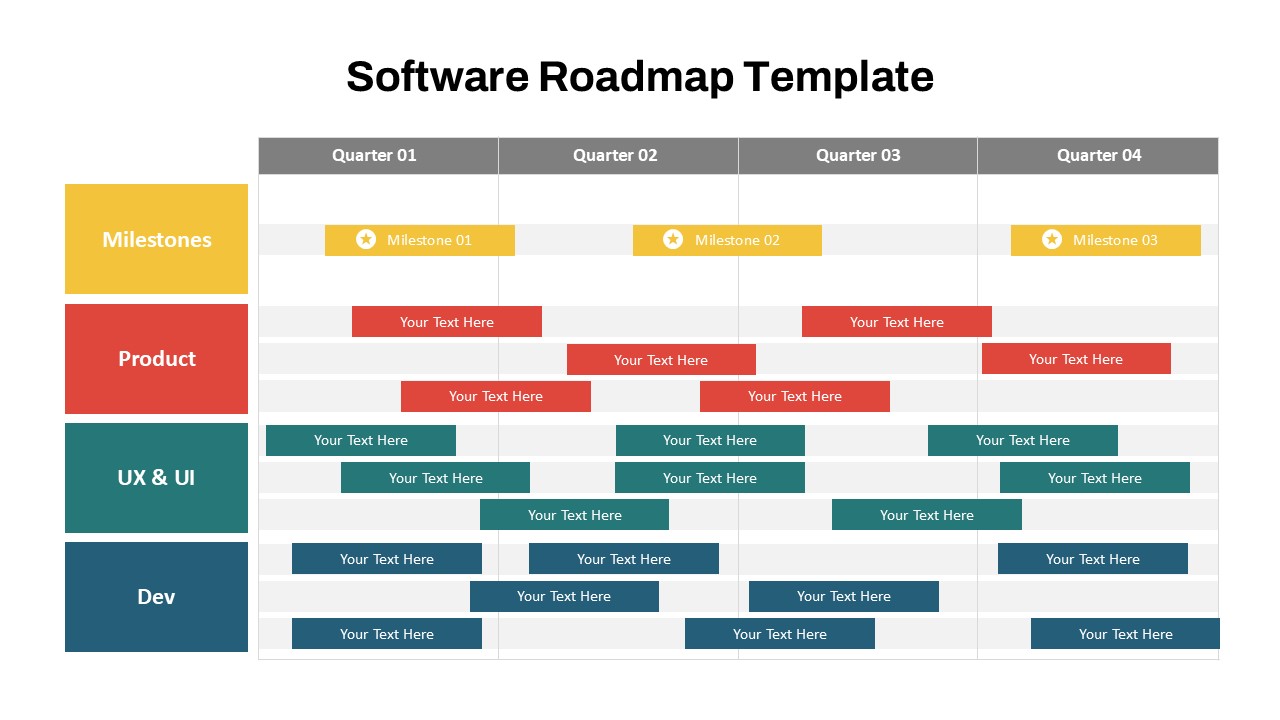
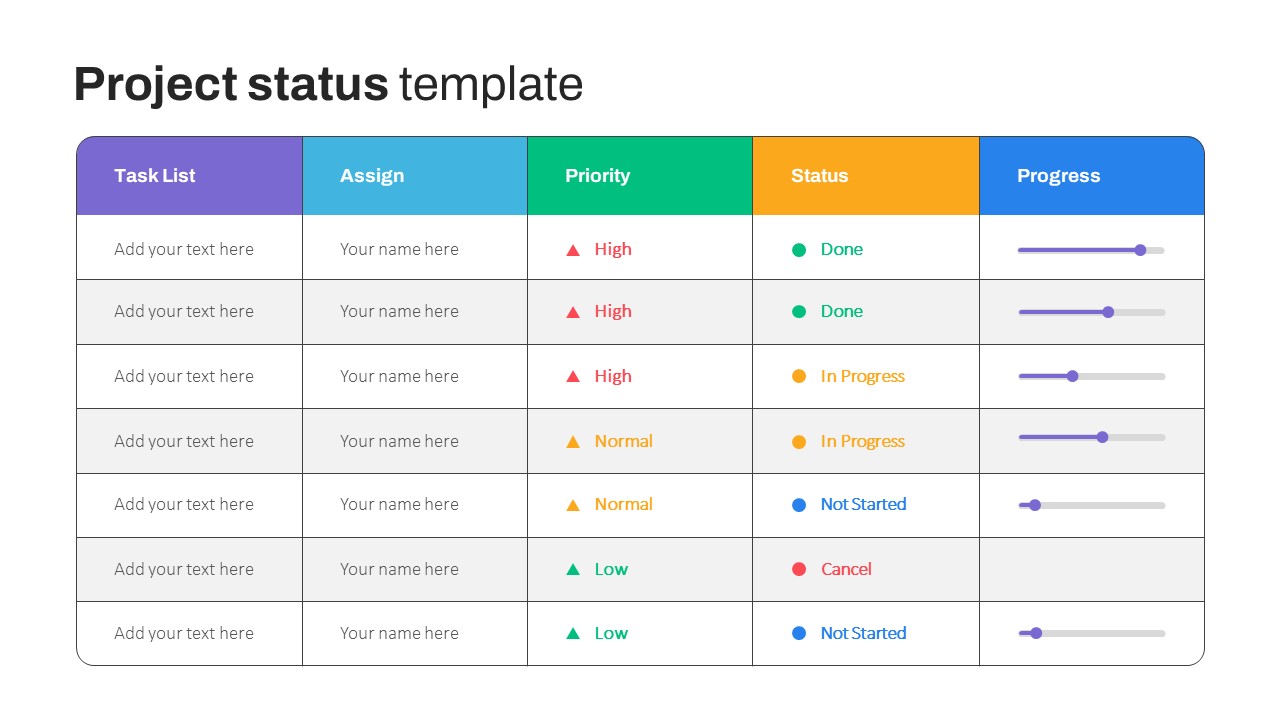
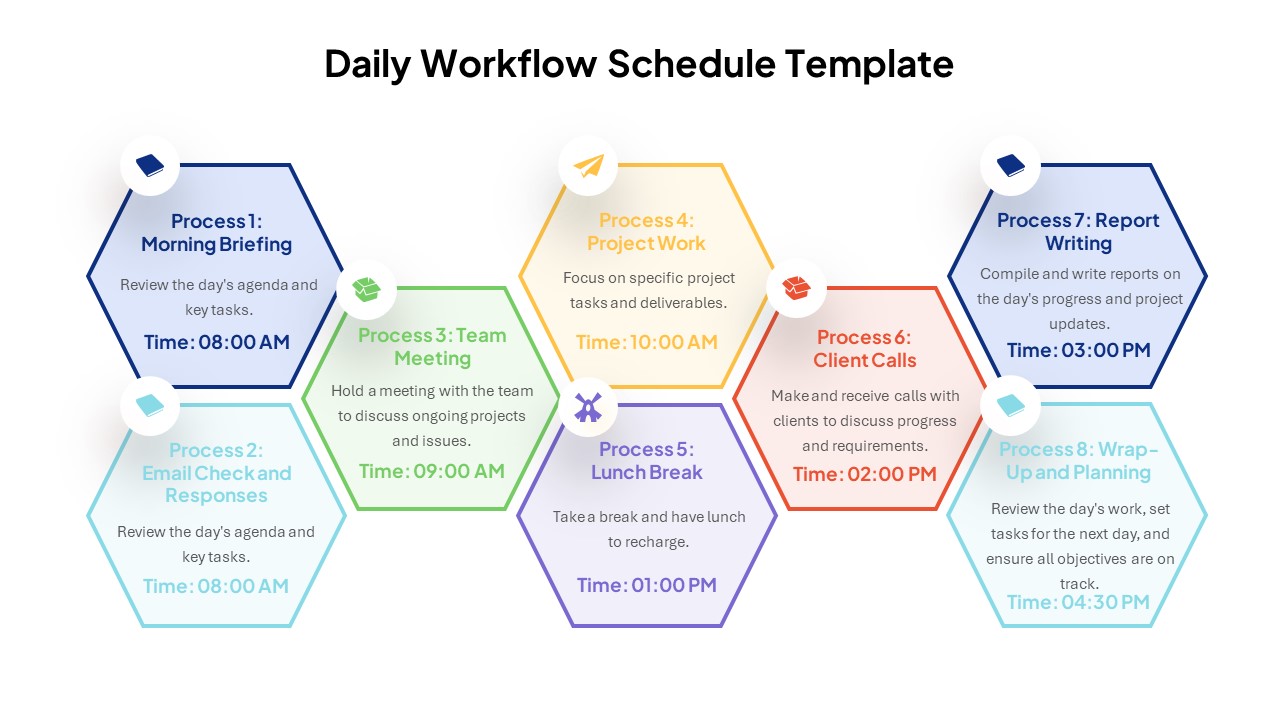
Product launch planning, quarterly project tracking, marketing campaign management, event planning timelines, client project management, software development roadmap, task prioritization, and cross-team collaboration charts.FAQs
You May Also Like These Presentation Templates

- Free

- Free
- Free
- Free
- Free
- Free
- Free
- Free