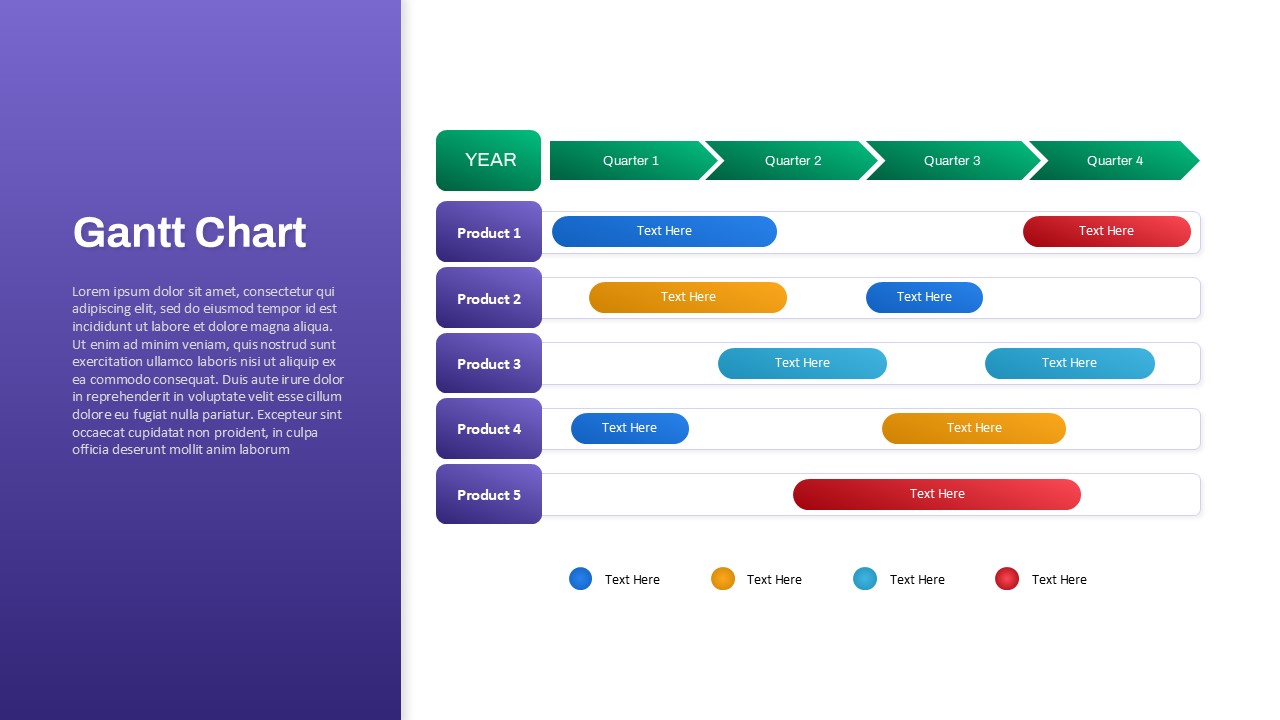
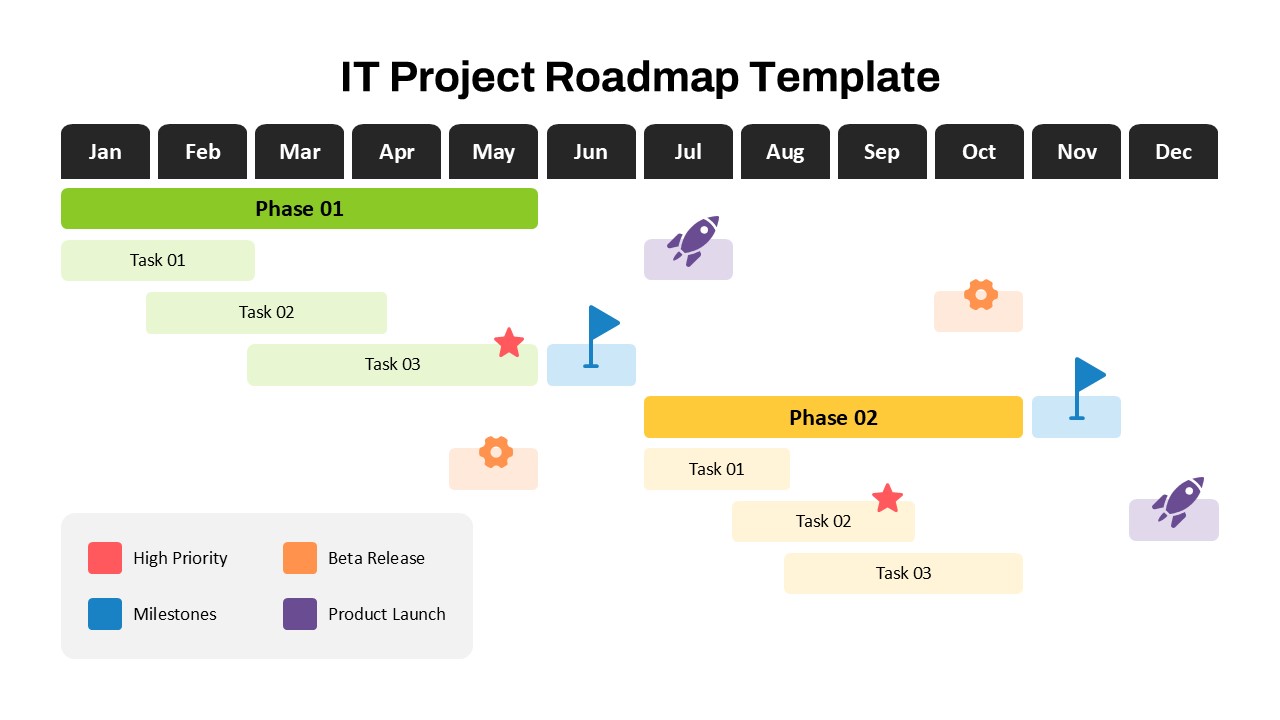
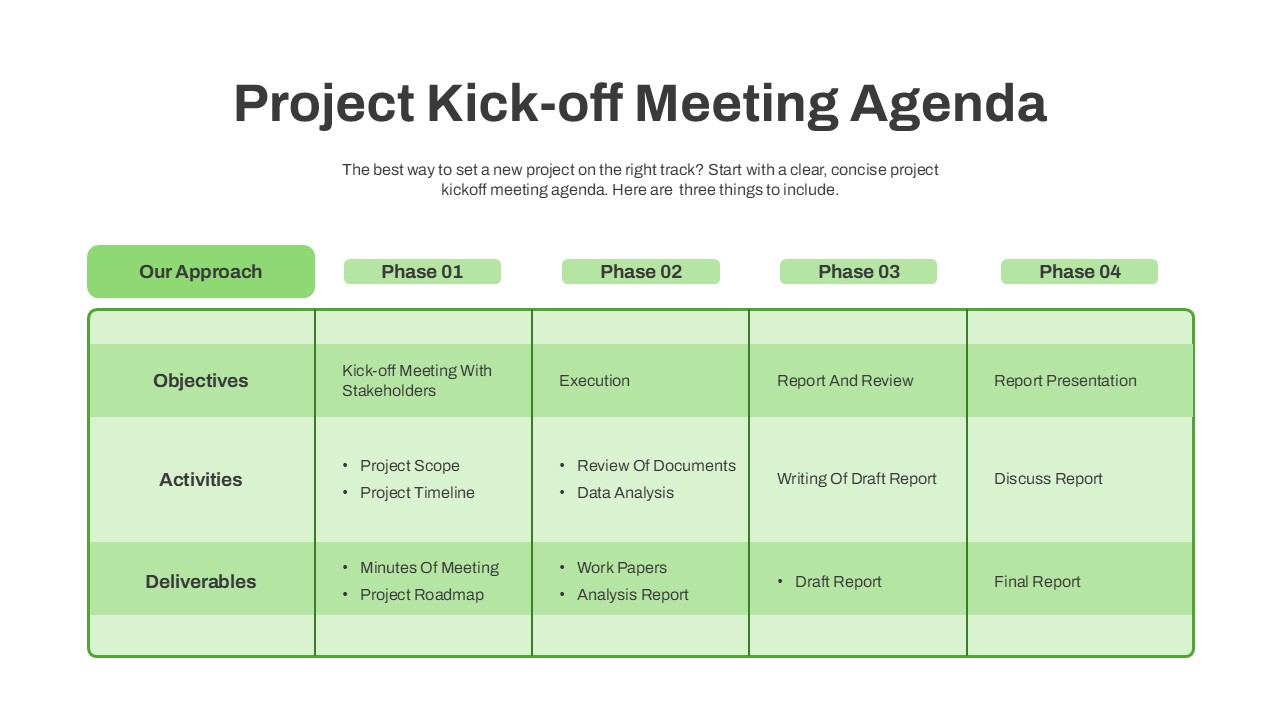
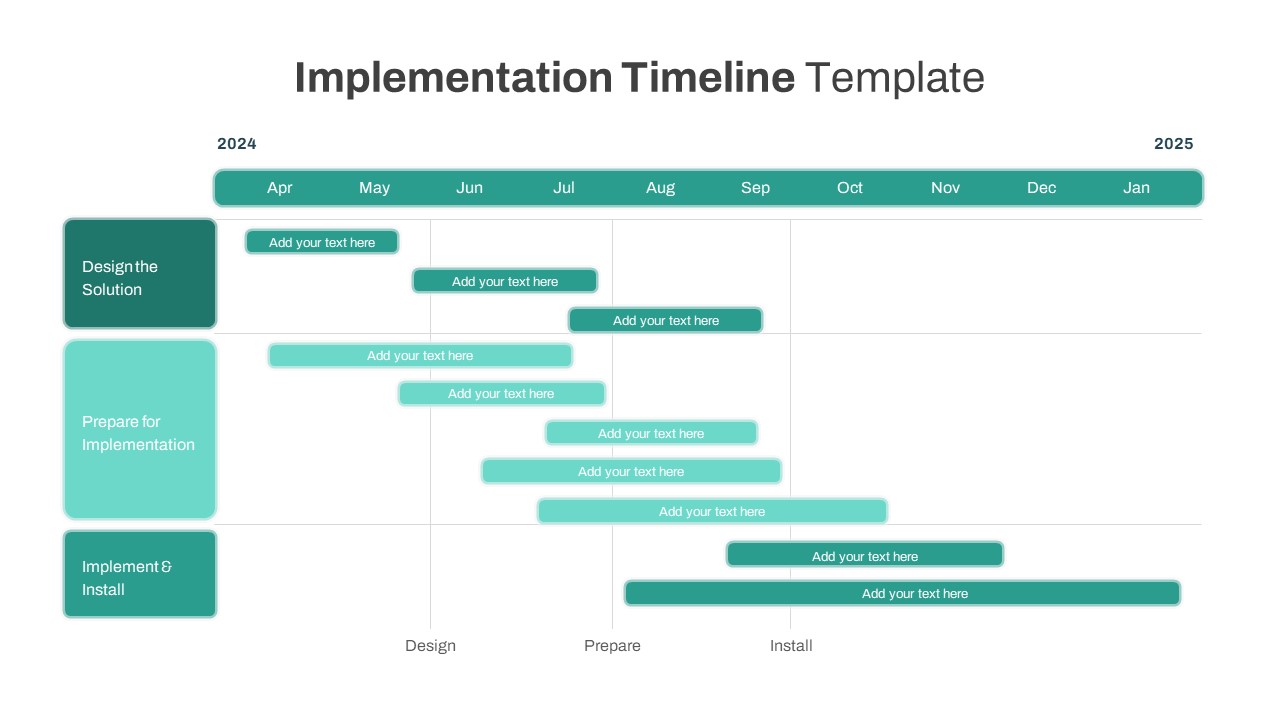
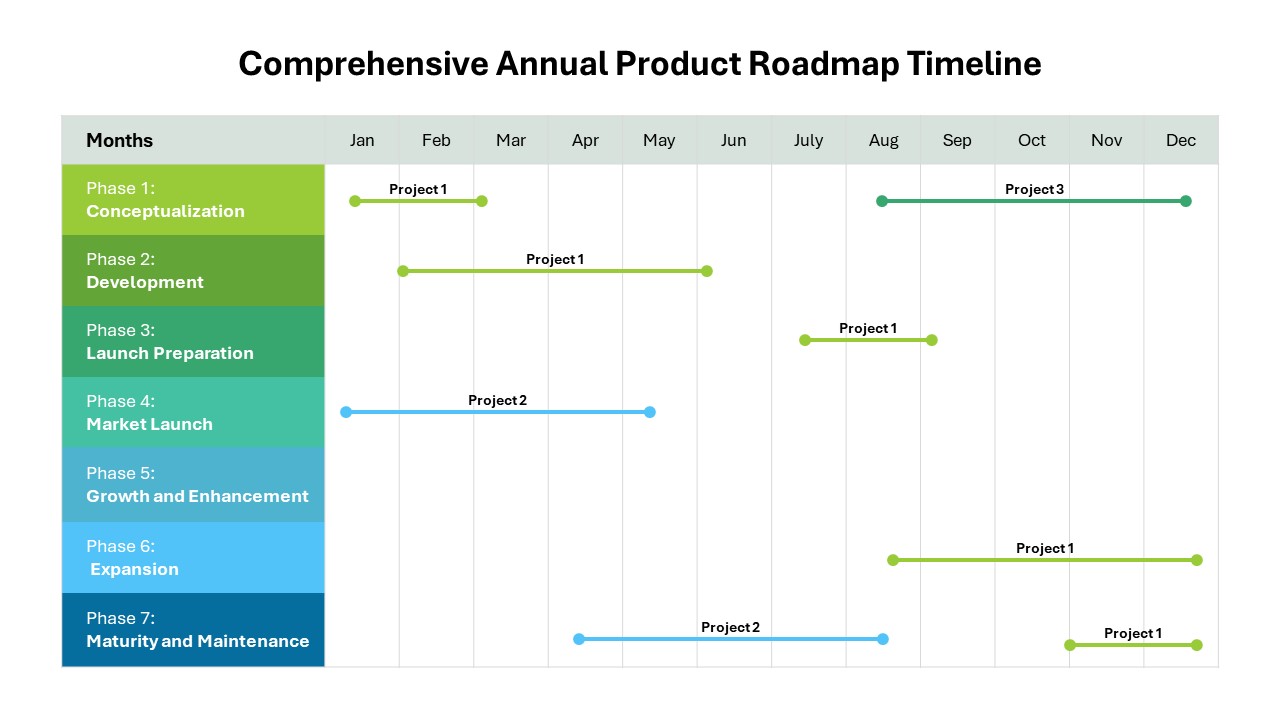
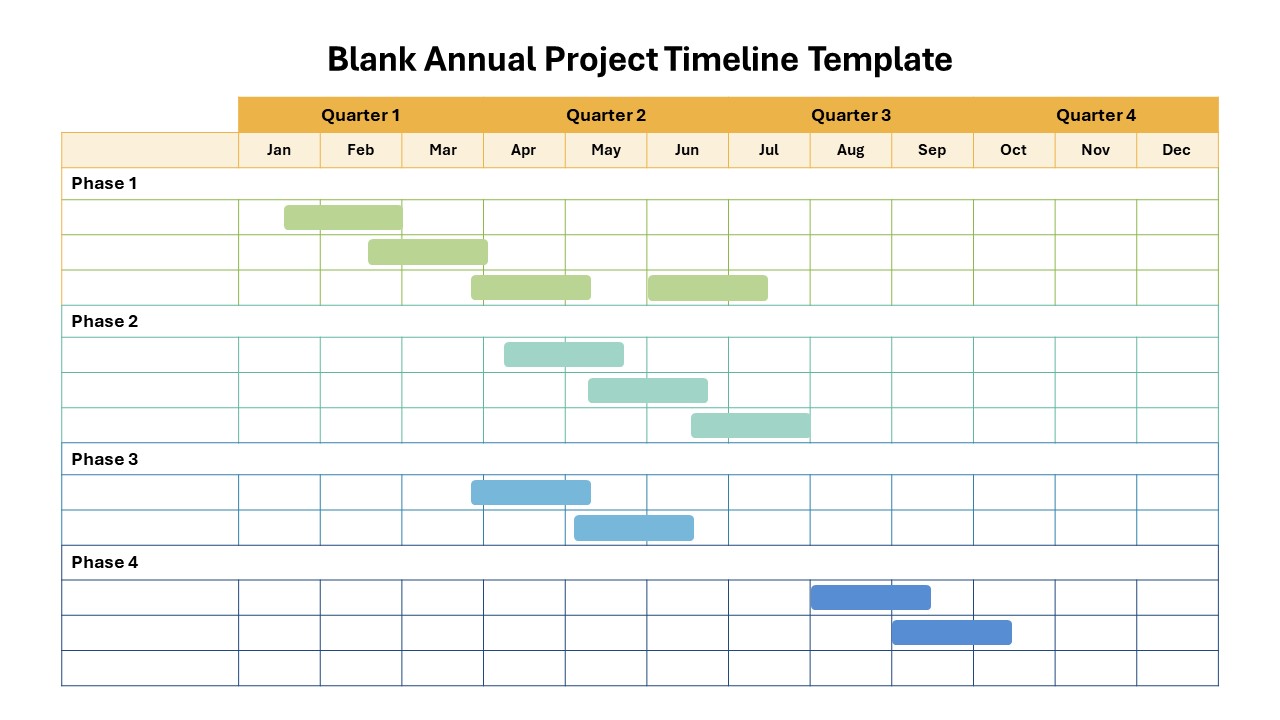
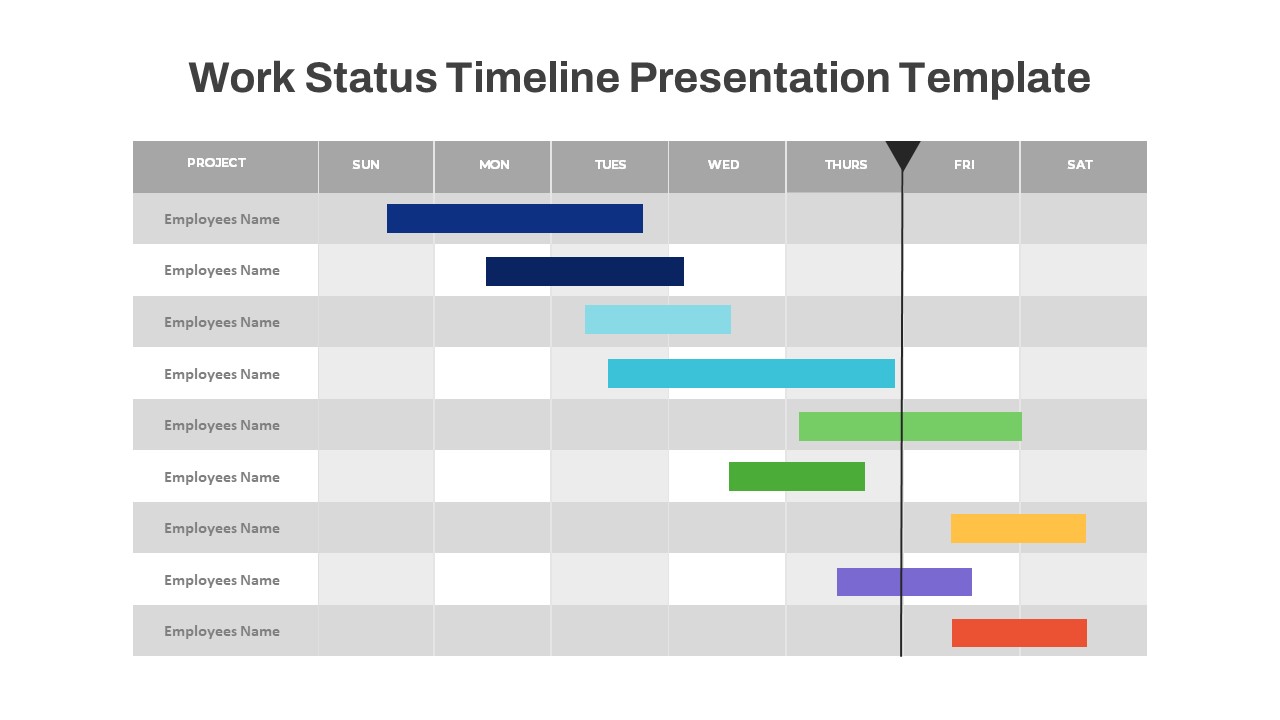
Gantt Chart Project Process Template
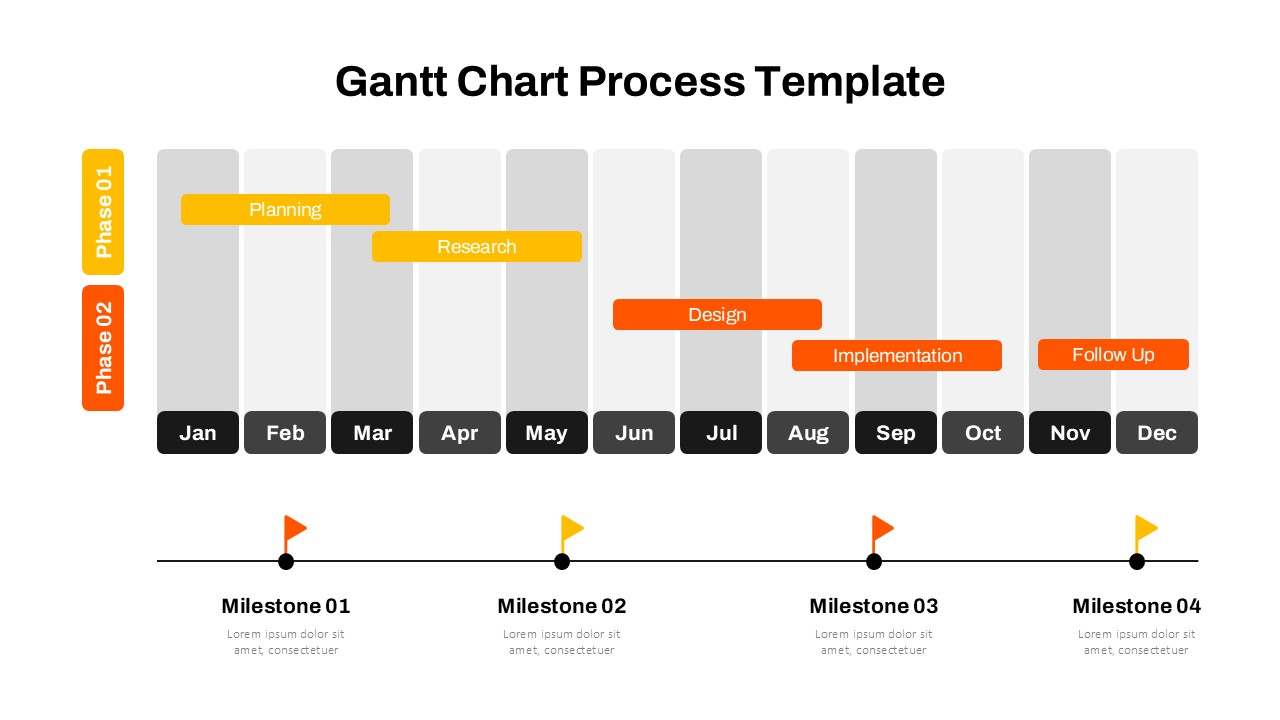
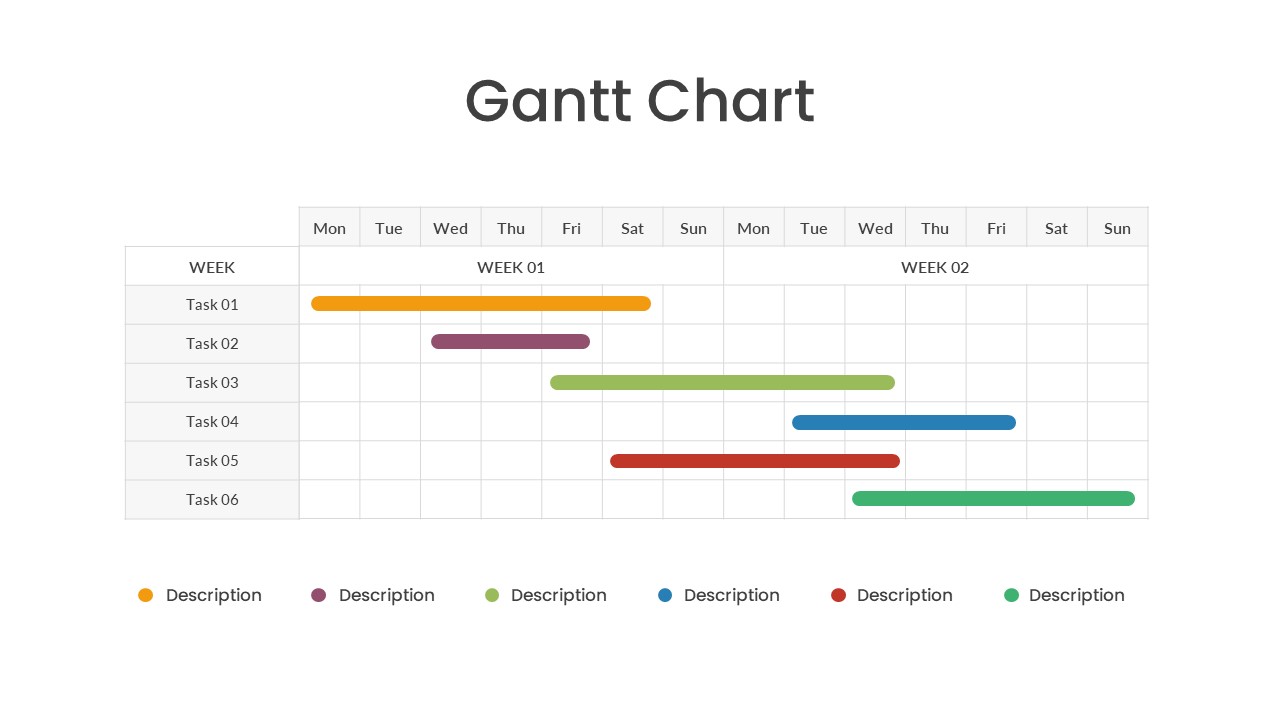
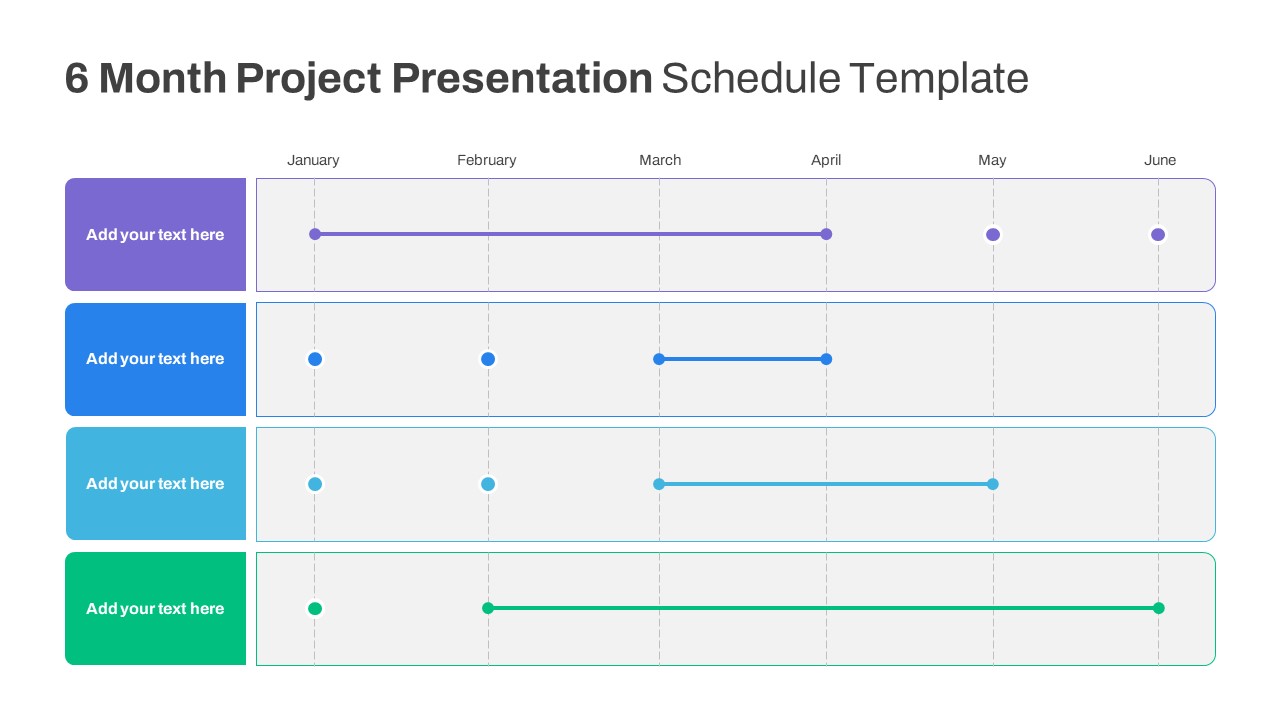
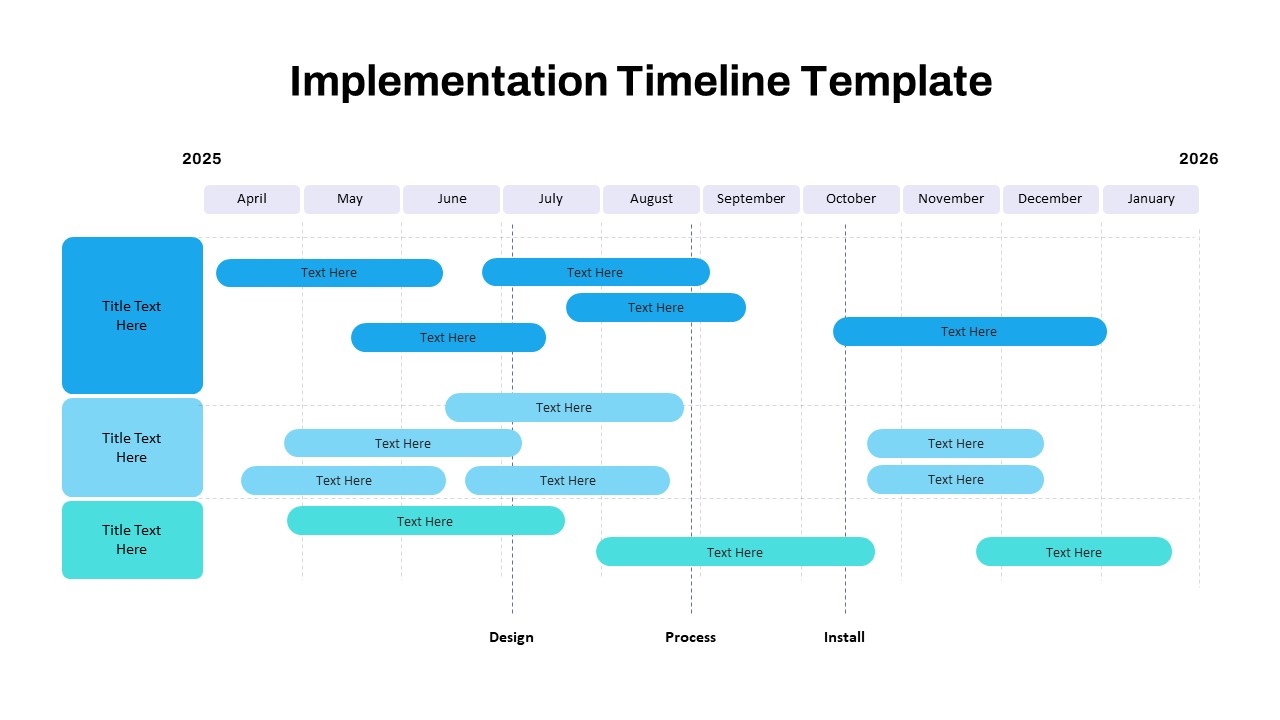
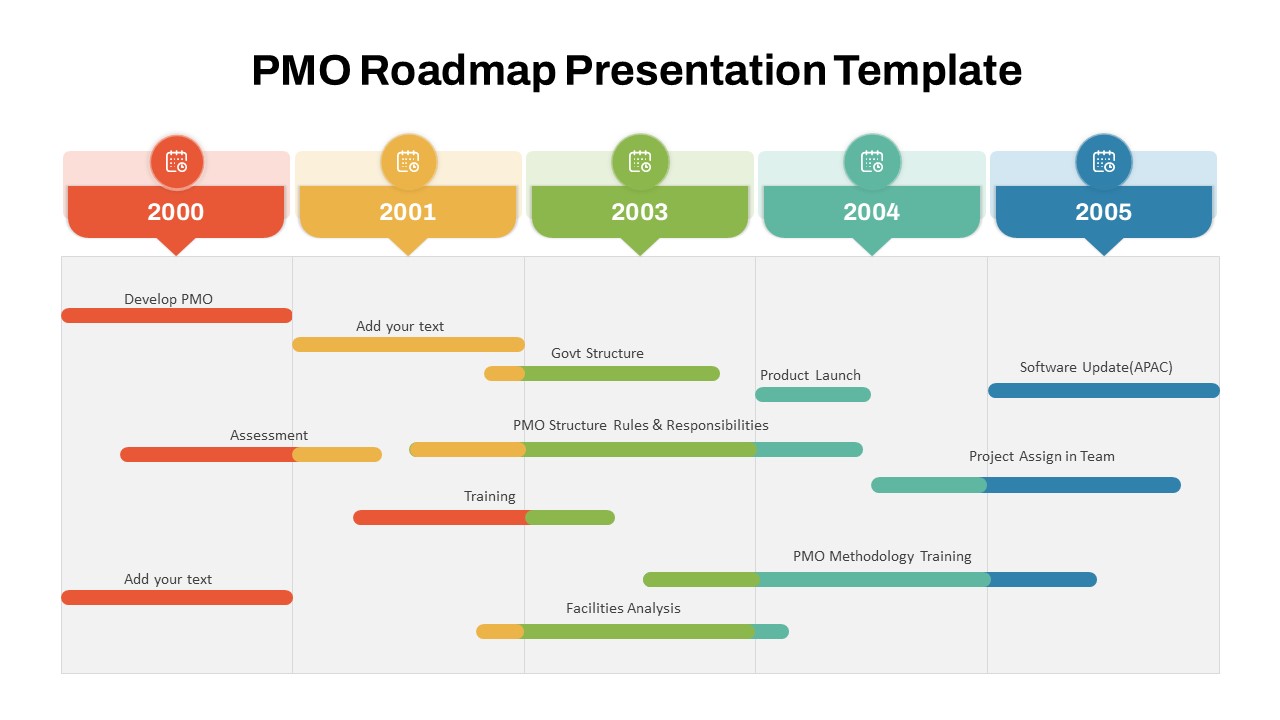
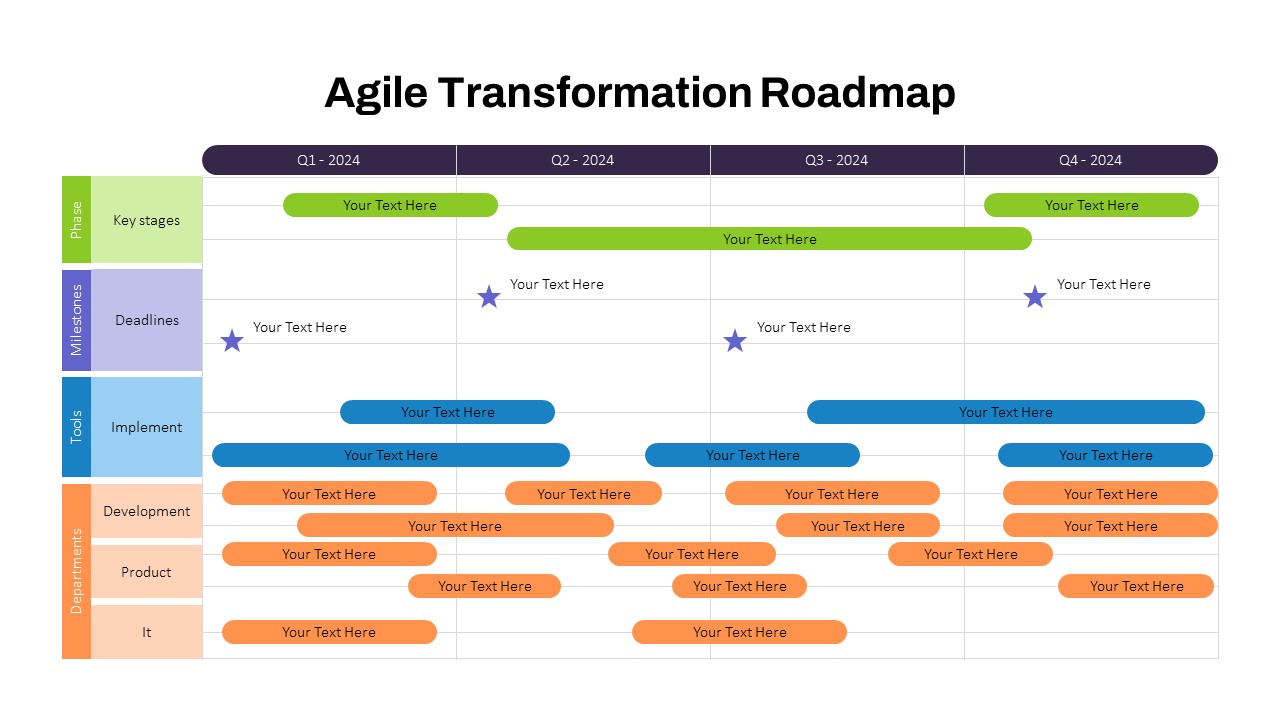
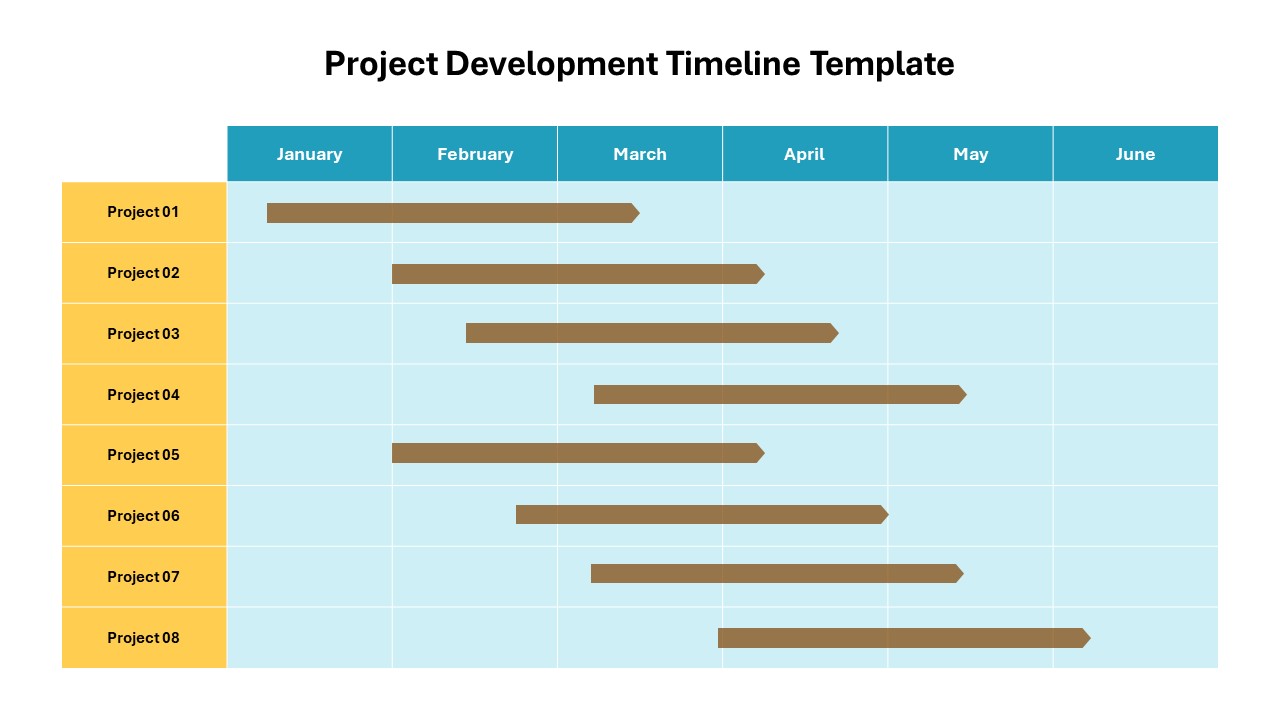
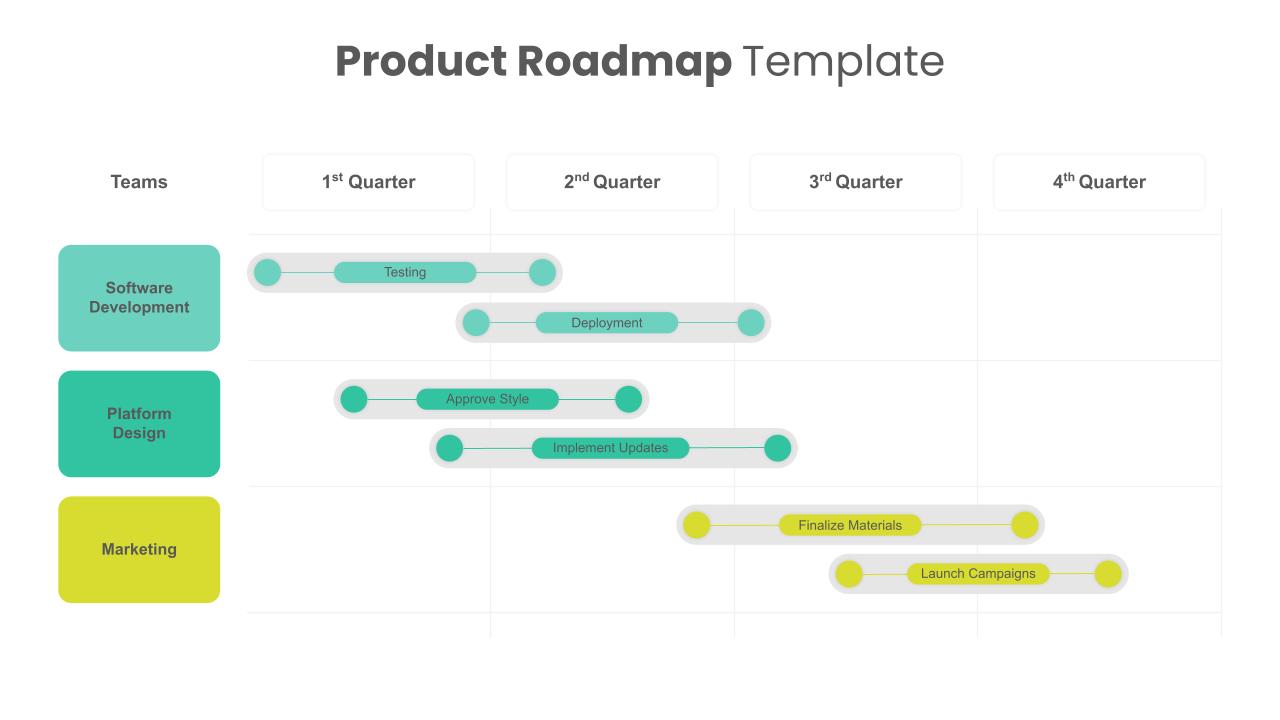
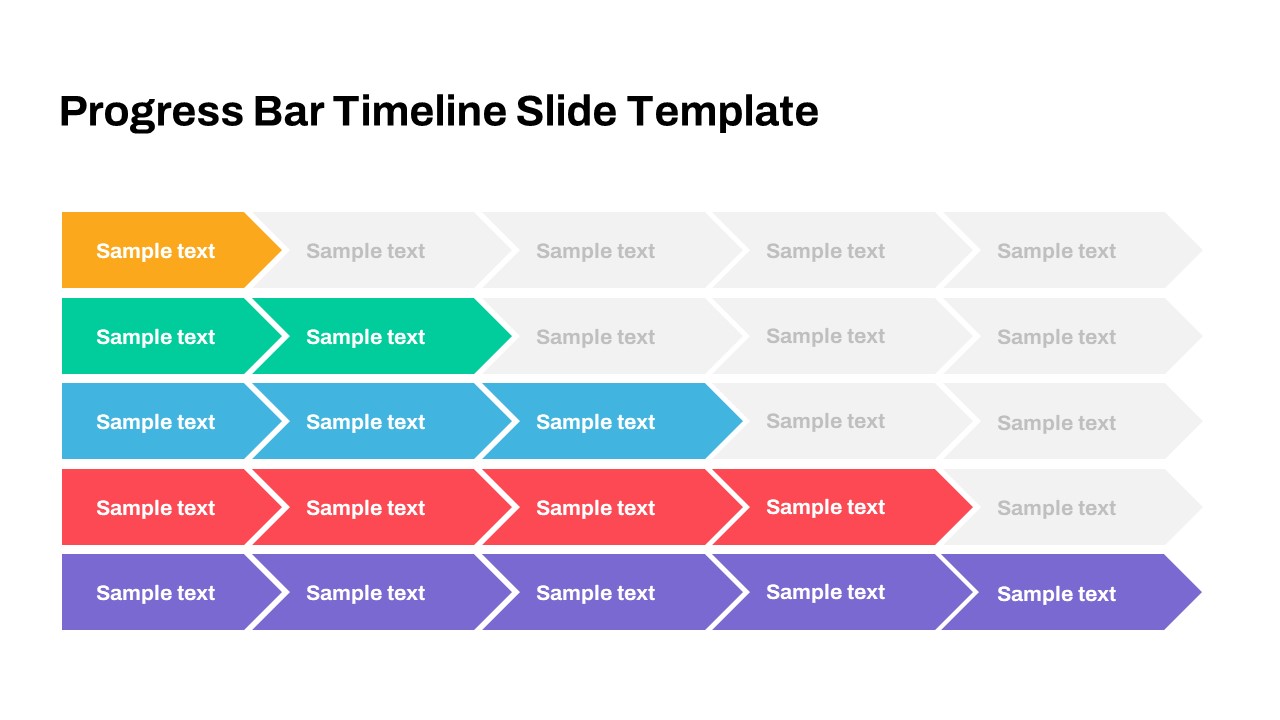
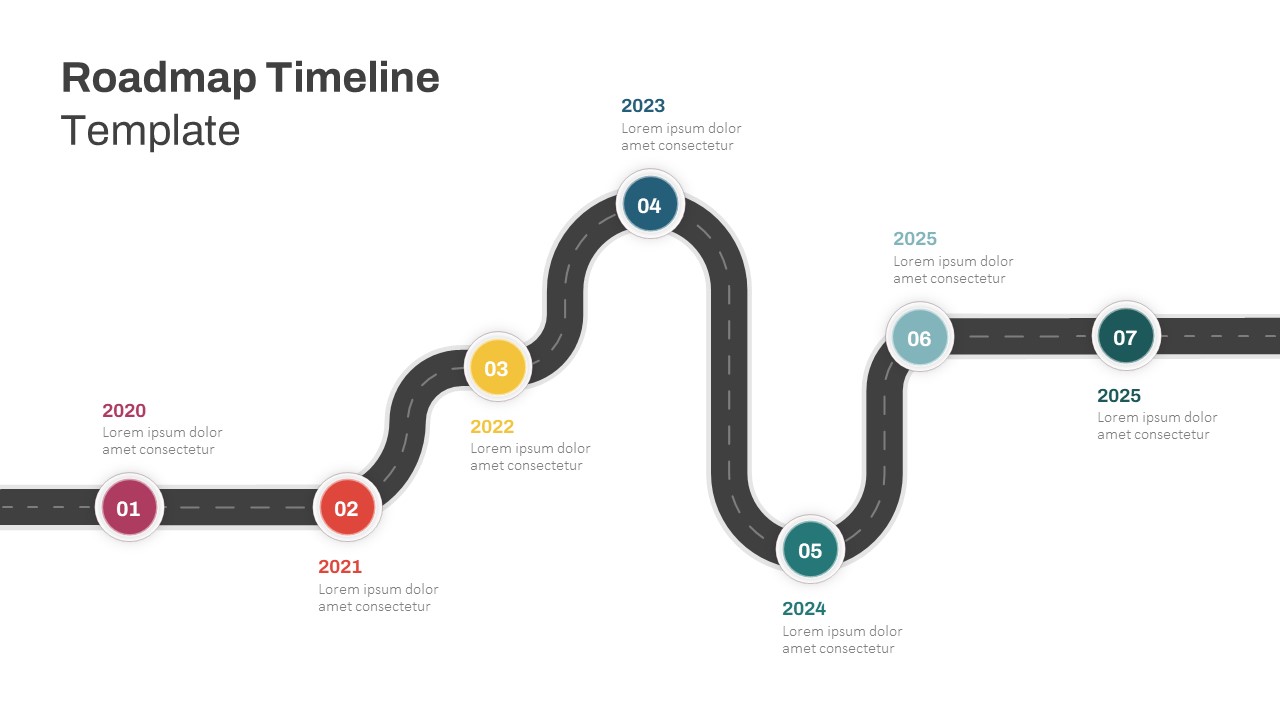
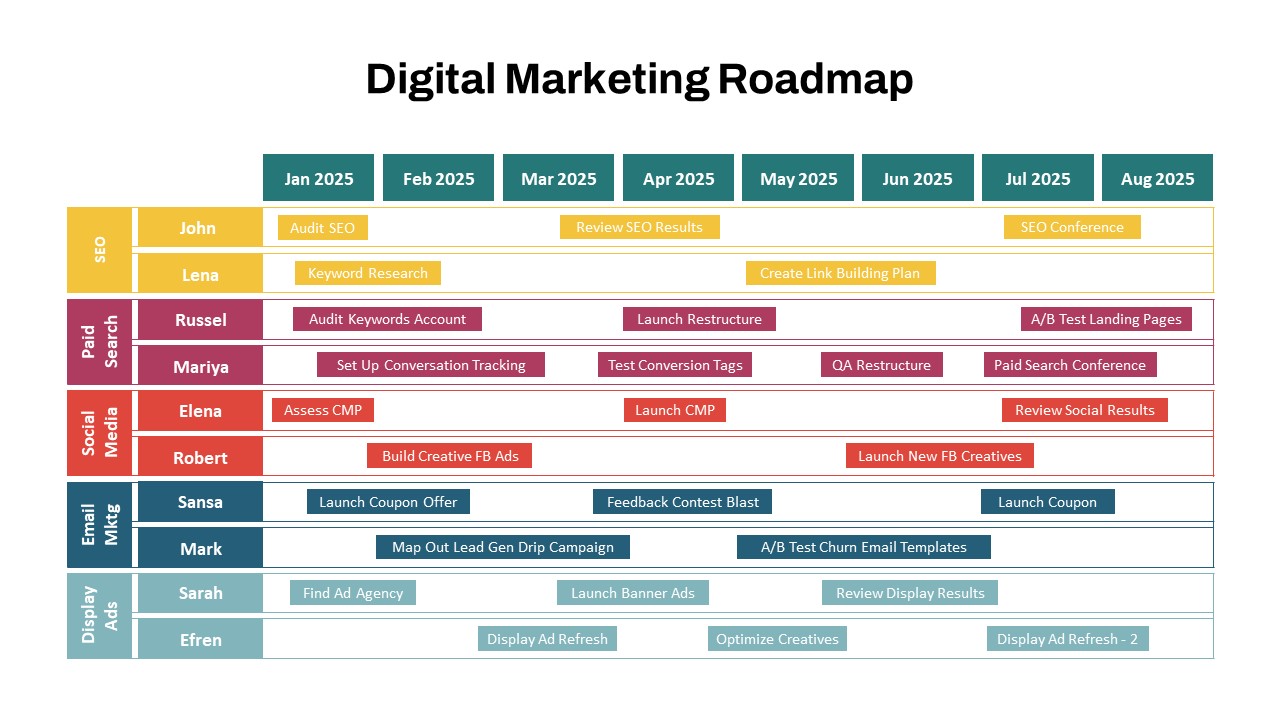
The Gantt Chart Project Process Template is a versatile and highly visual tool designed to help teams streamline their project management process. This template offers a clear, month-by-month breakdown of tasks, milestones, and phases, making it easy to track progress and ensure all project elements are moving smoothly. The chart is divided into two key phases (Phase 01 and Phase 02), each represented by a unique color for easy identification. Tasks such as Planning, Research, Design, Implementation, and Follow-up are displayed across a full calendar year, allowing for long-term project tracking. Below the main Gantt chart, milestones are visually marked along a timeline, further simplifying the identification of critical points in the project’s lifecycle.
The intuitive layout ensures that stakeholders can quickly grasp timelines and task dependencies, promoting better communication and coordination. This Gantt chart template is perfect for managers, project leads, and teams looking for a structured and organized way to manage workflows. Customizable in both PowerPoint and Google Slides, this template can easily adapt to various projects or industries, ensuring flexibility for different types of work environments.
See more

Aspect Ratio
16:9Item ID
SKT01662
Features of this template
Other User Cases of the Template:
Project management, task tracking, product development, marketing campaign planning, software development roadmap, event planning, research project scheduling, construction project management, strategic planning, client project updates.FAQs
You May Also Like These Presentation Templates

- Free

- Free
- Free
- Free
- Free
- Free
- Free