Georgia Map Template for PowerPoint and Google Slides
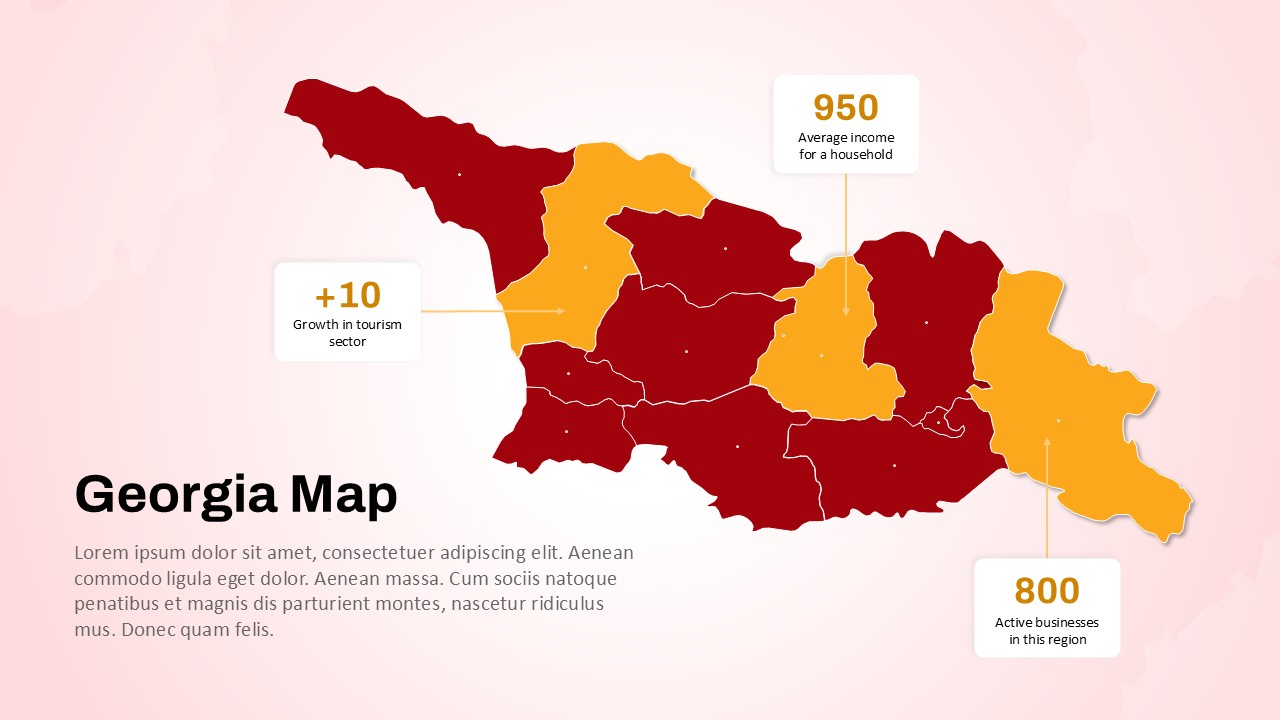
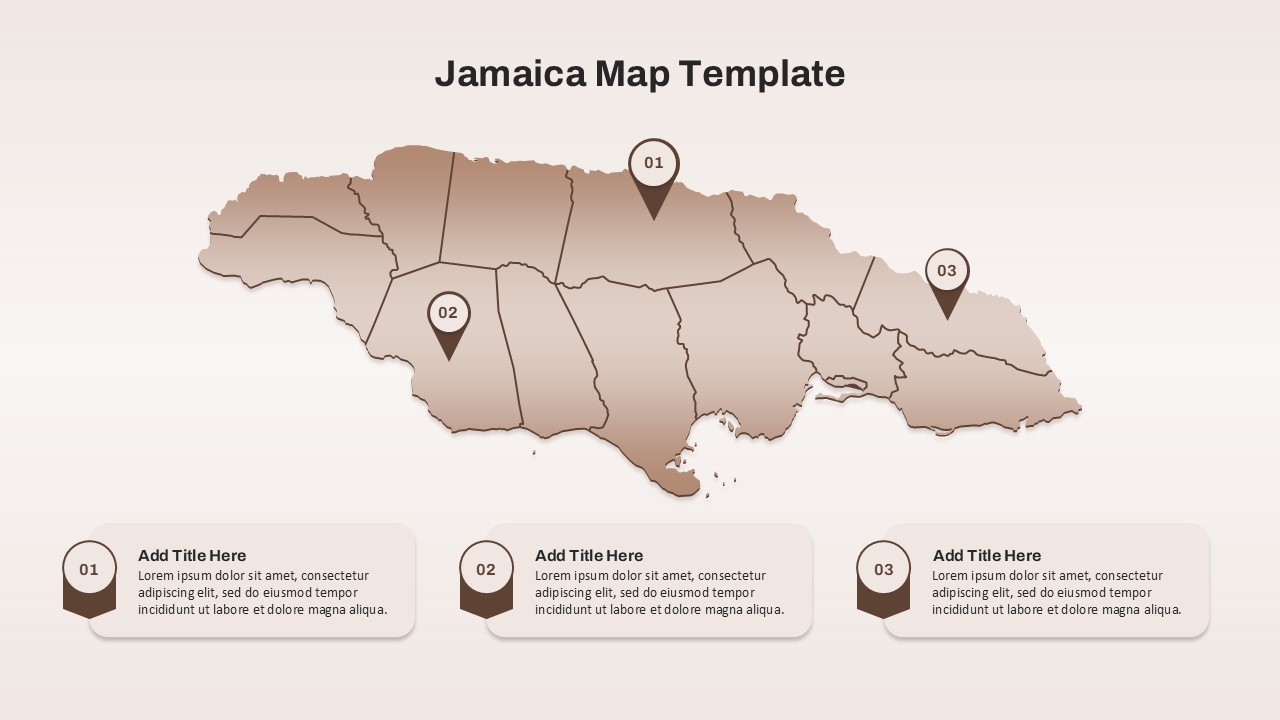
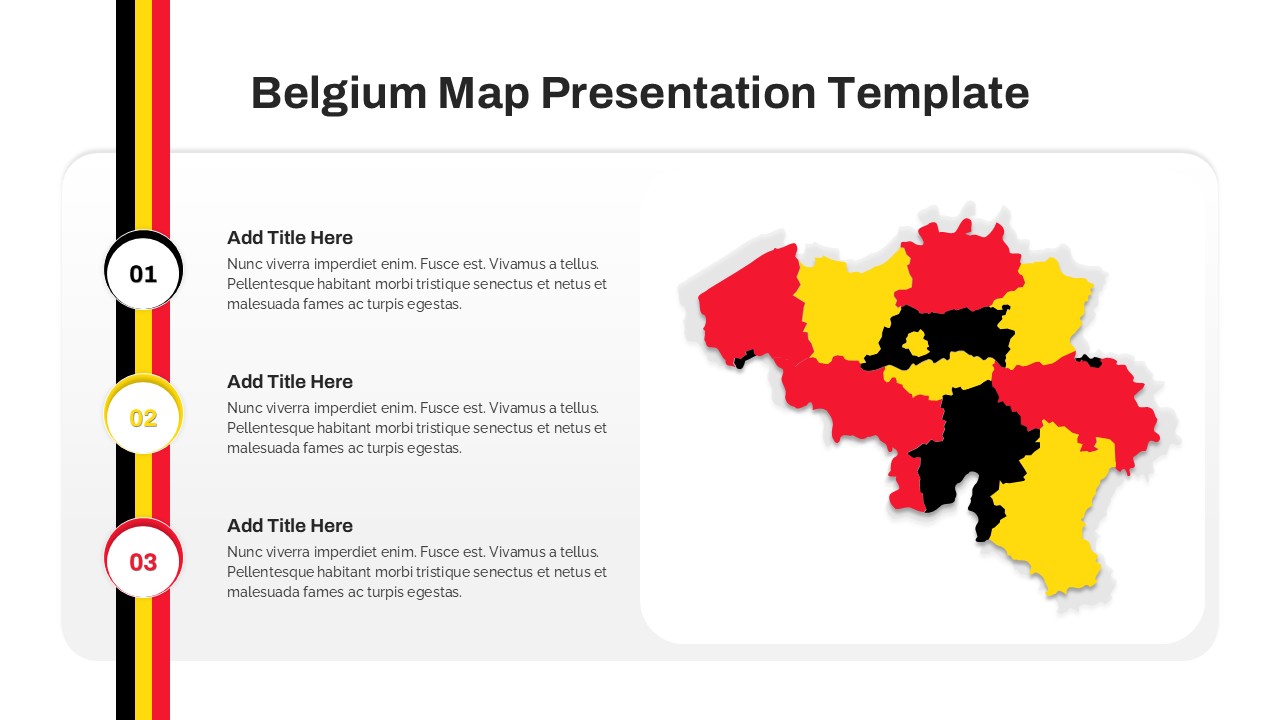
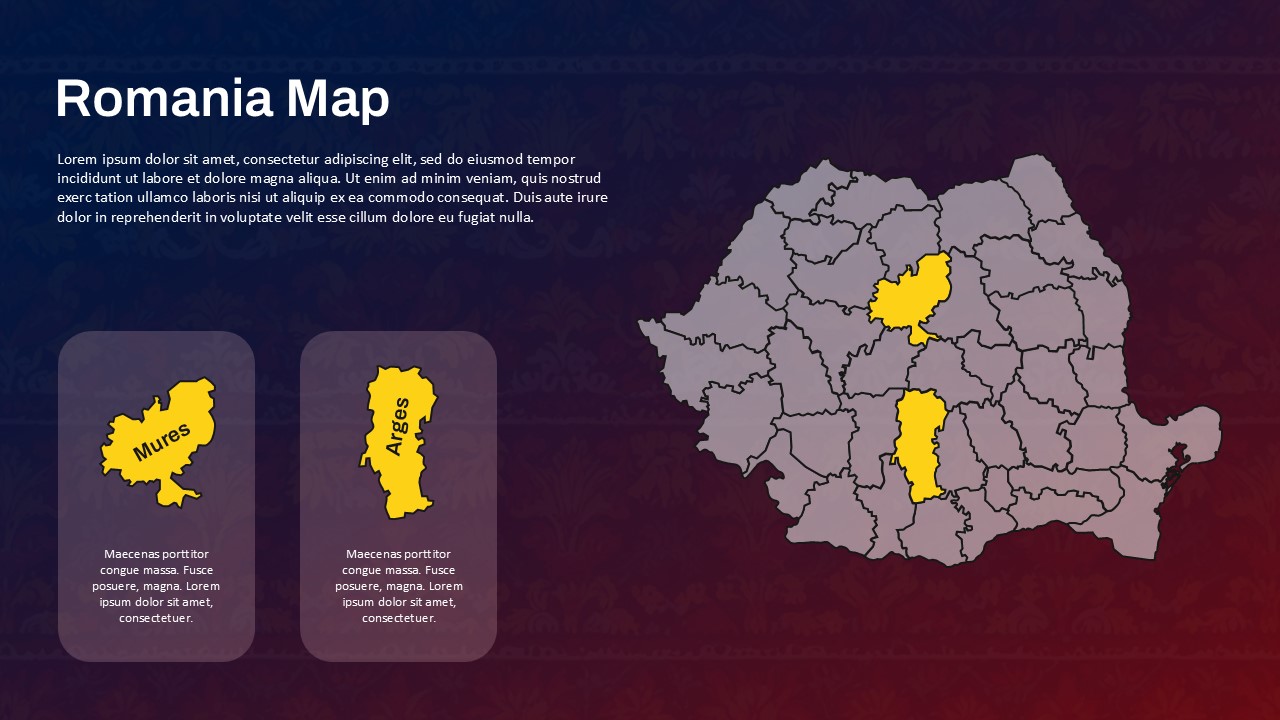
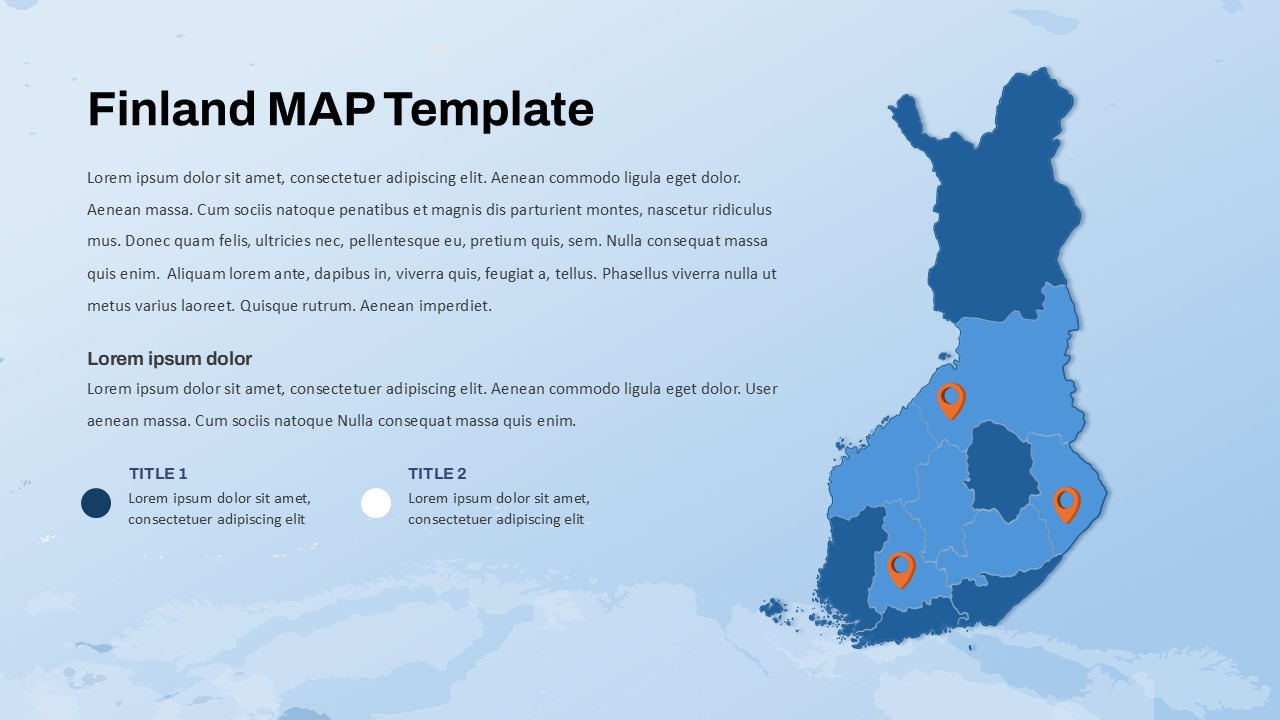
Present region-specific data effectively with this editable Georgia Map Template, crafted for both PowerPoint and Google Slides. Designed with a professional and modern aesthetic, this template visually represents the country of Georgia, highlighting regional statistics and insights that are easy to interpret and customize.
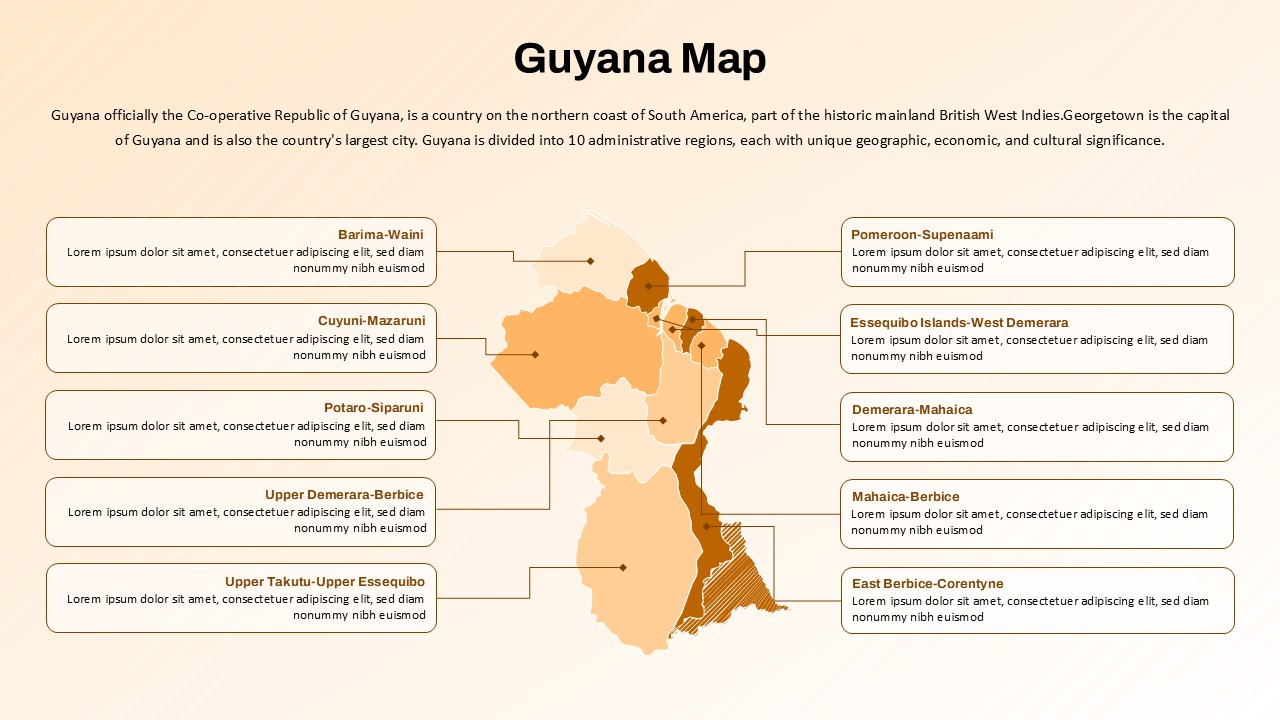
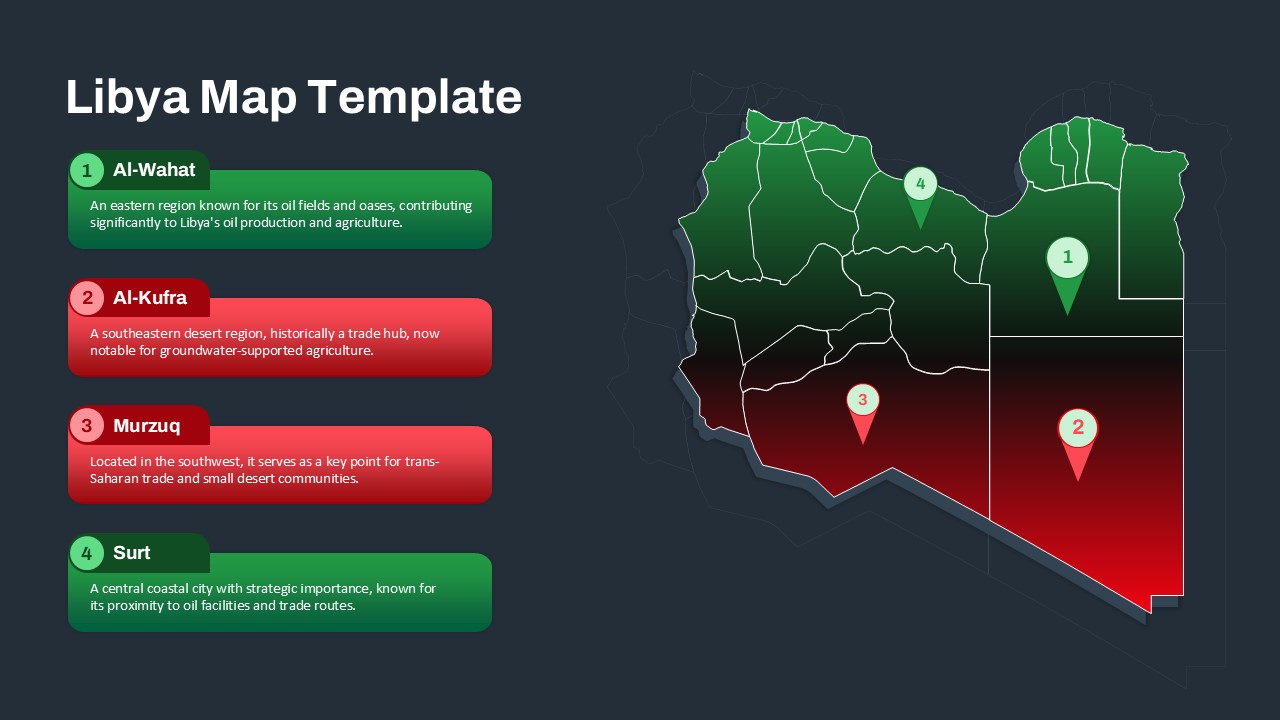
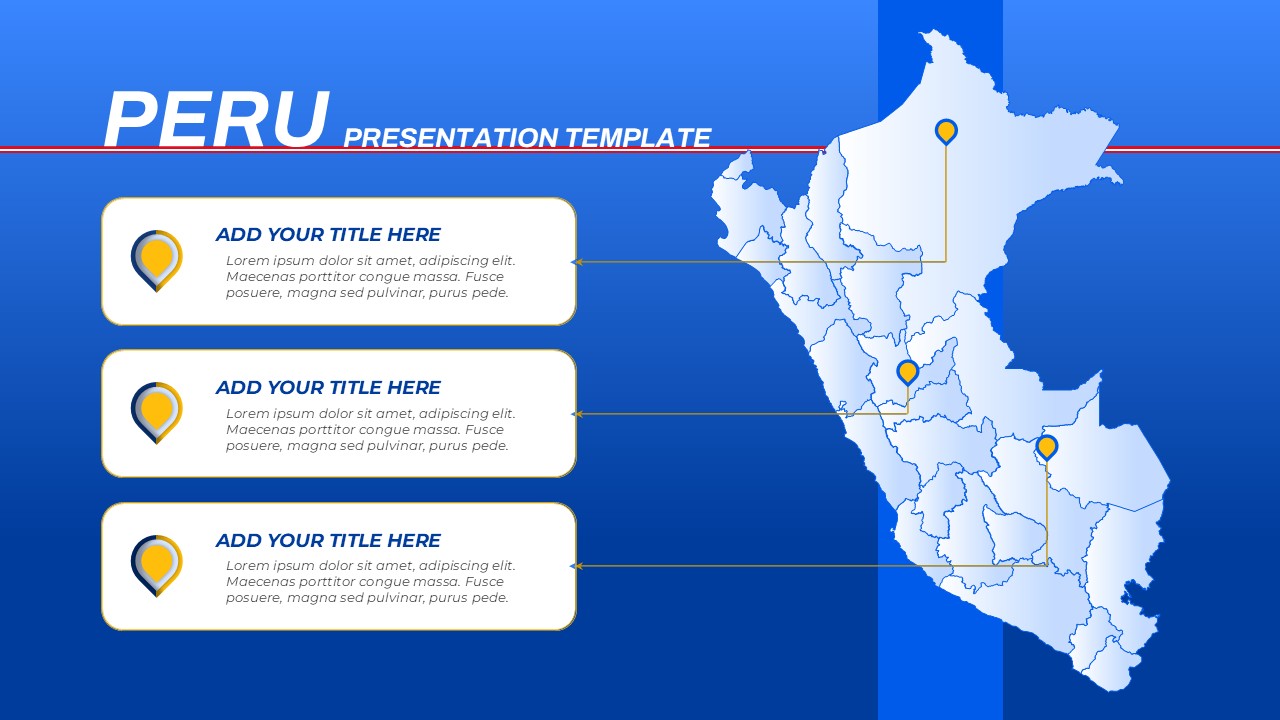
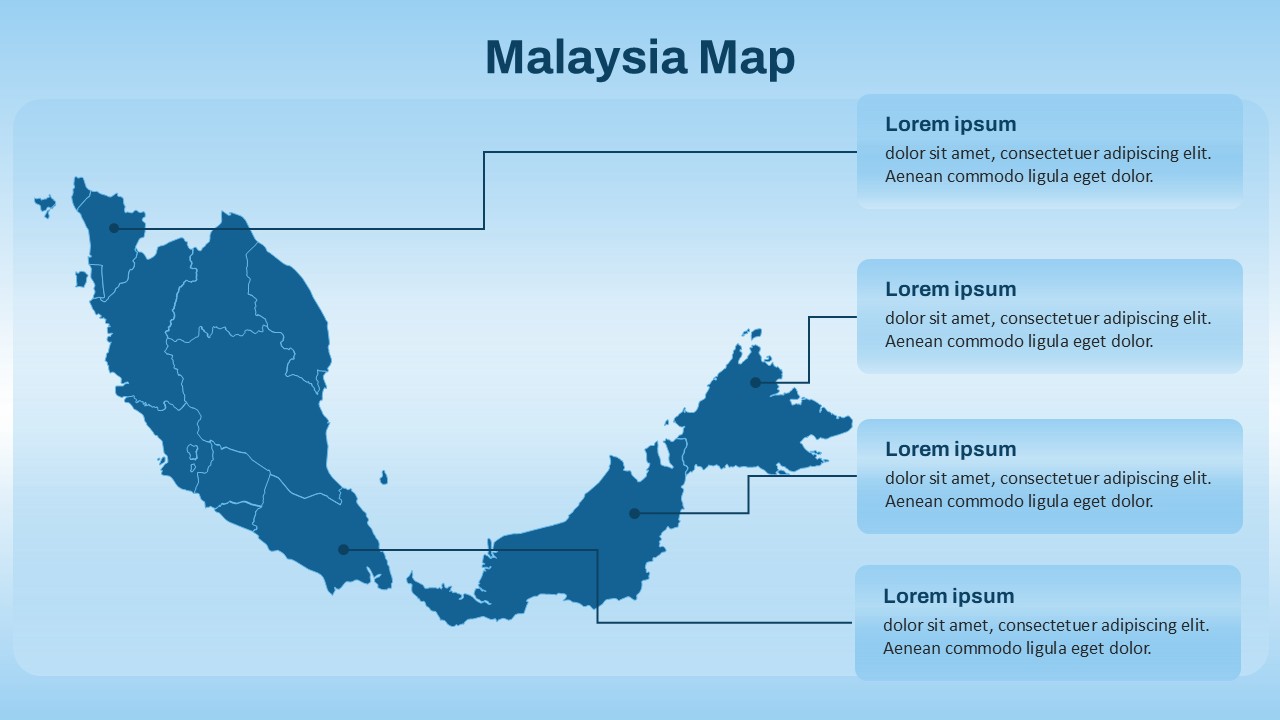
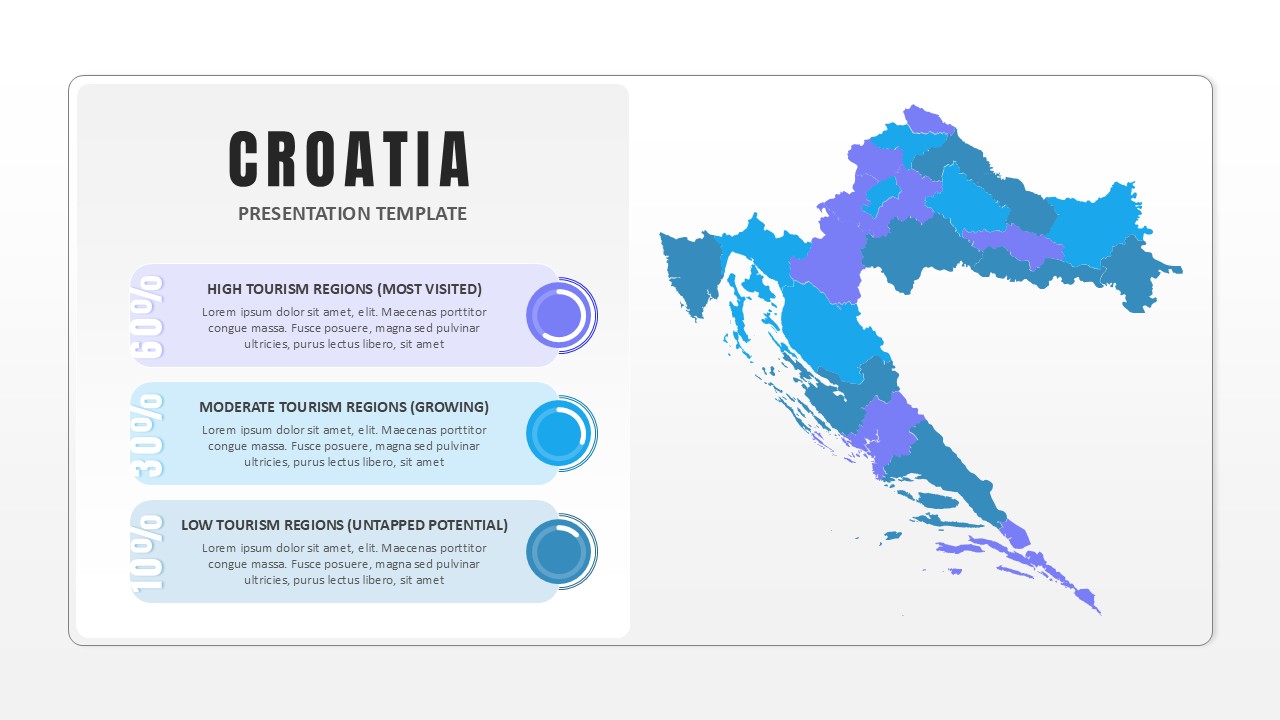
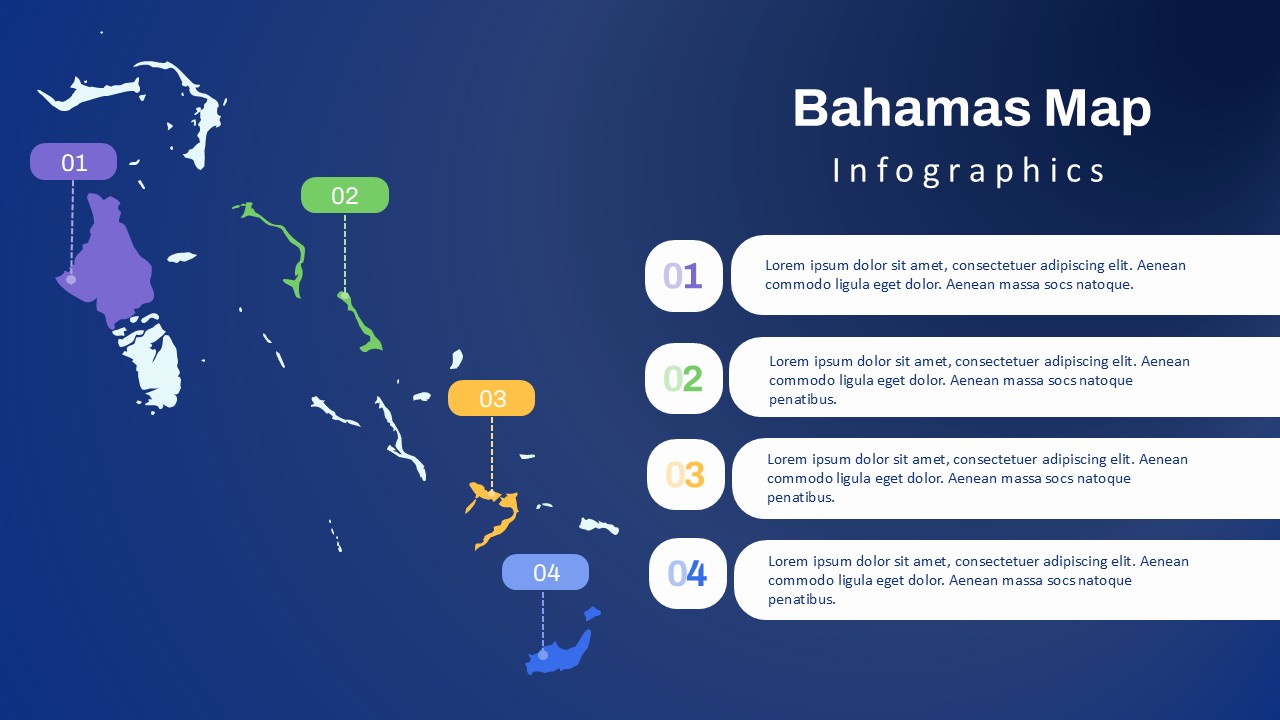
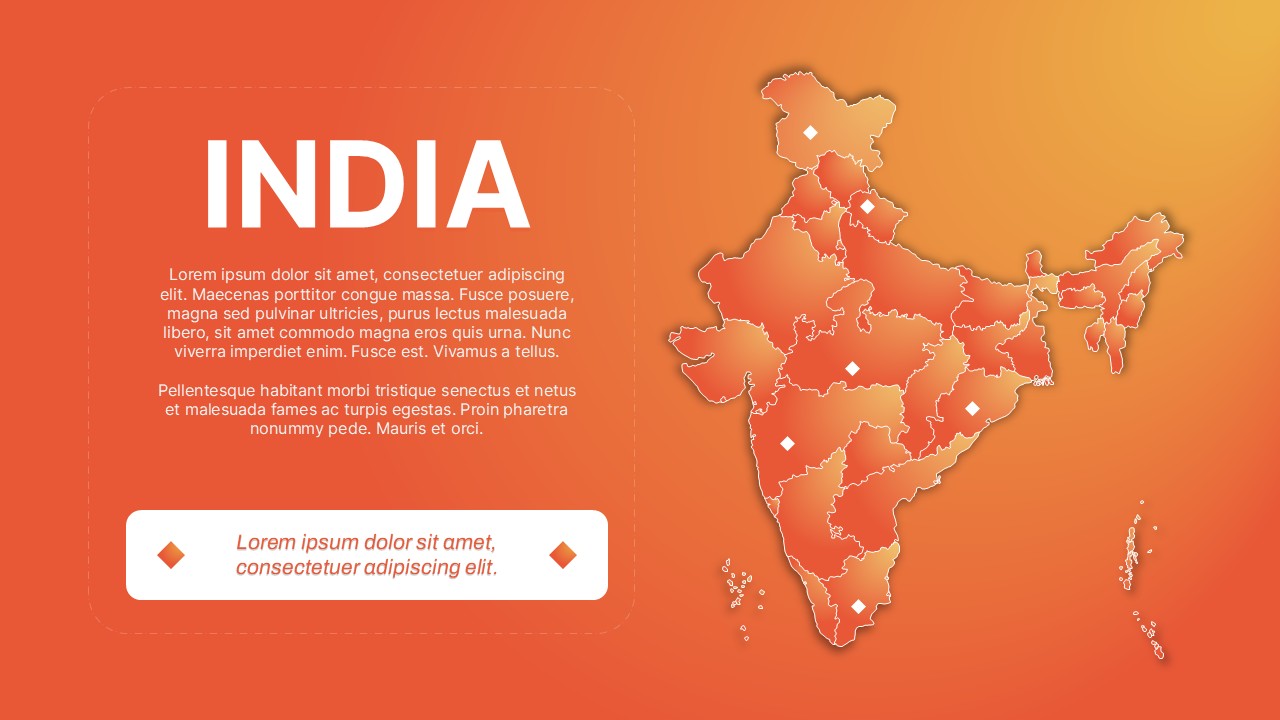
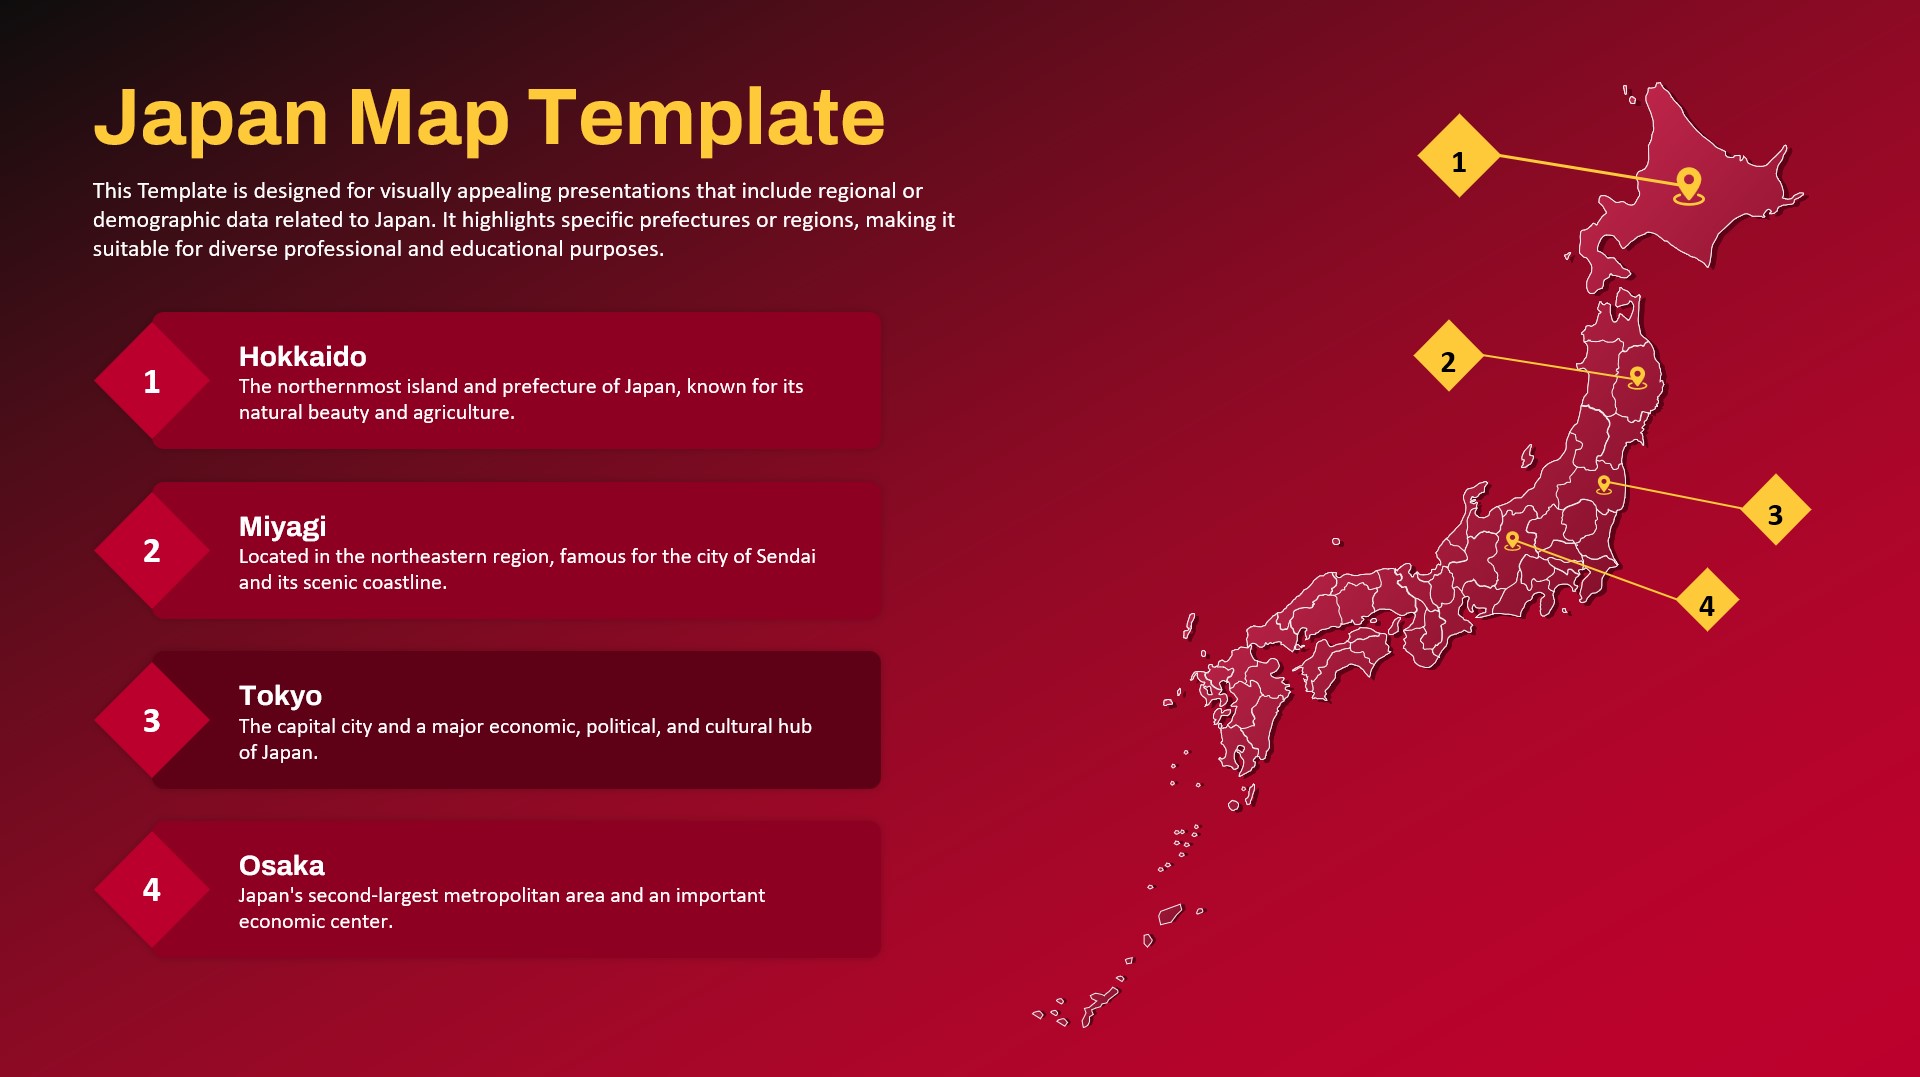
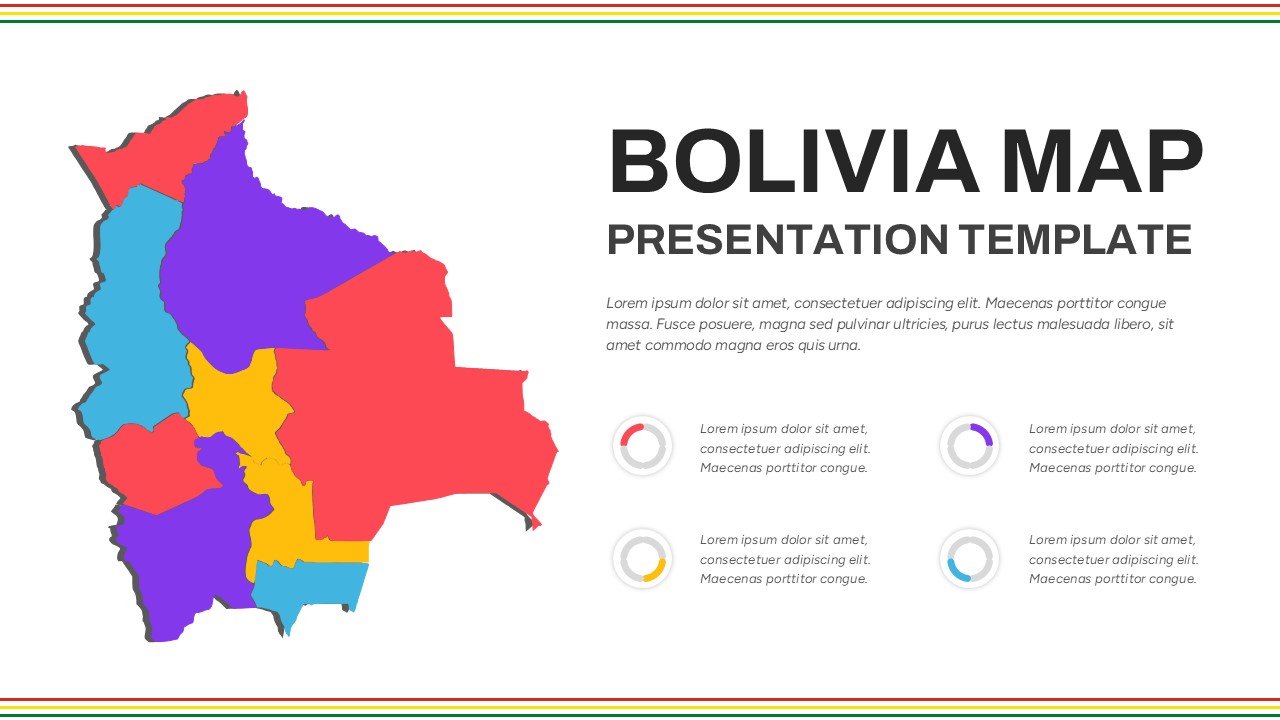
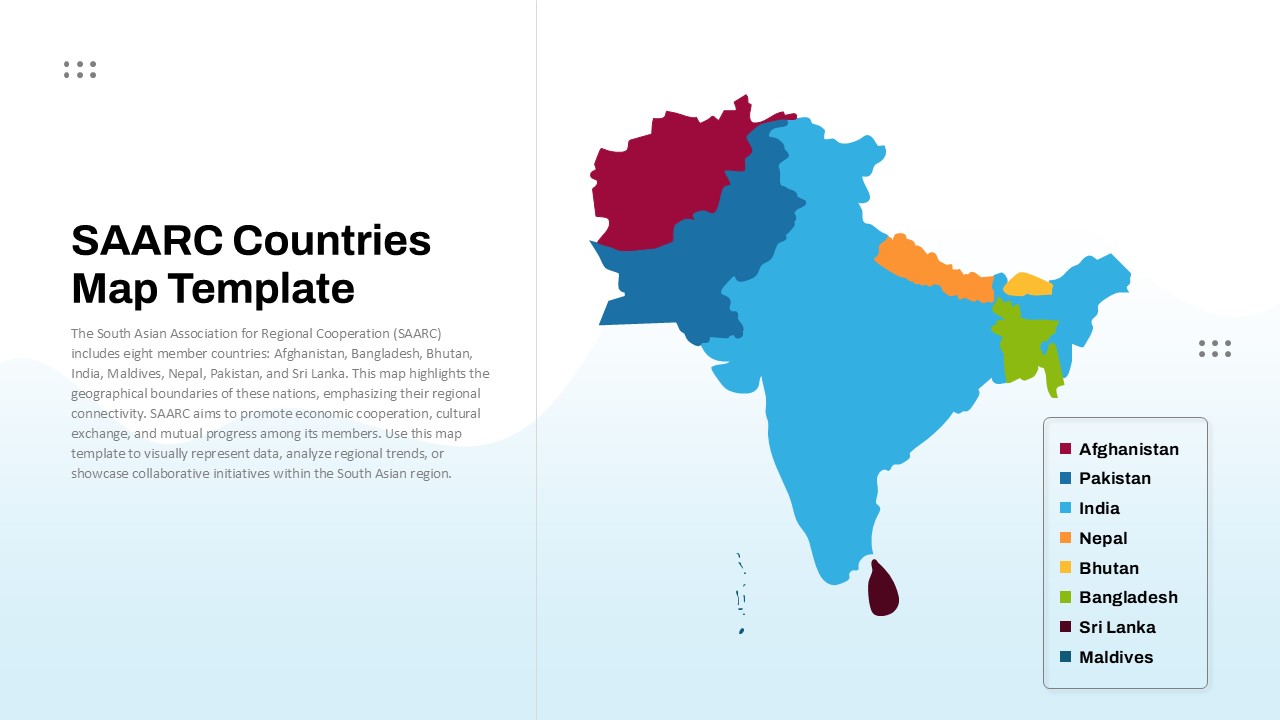
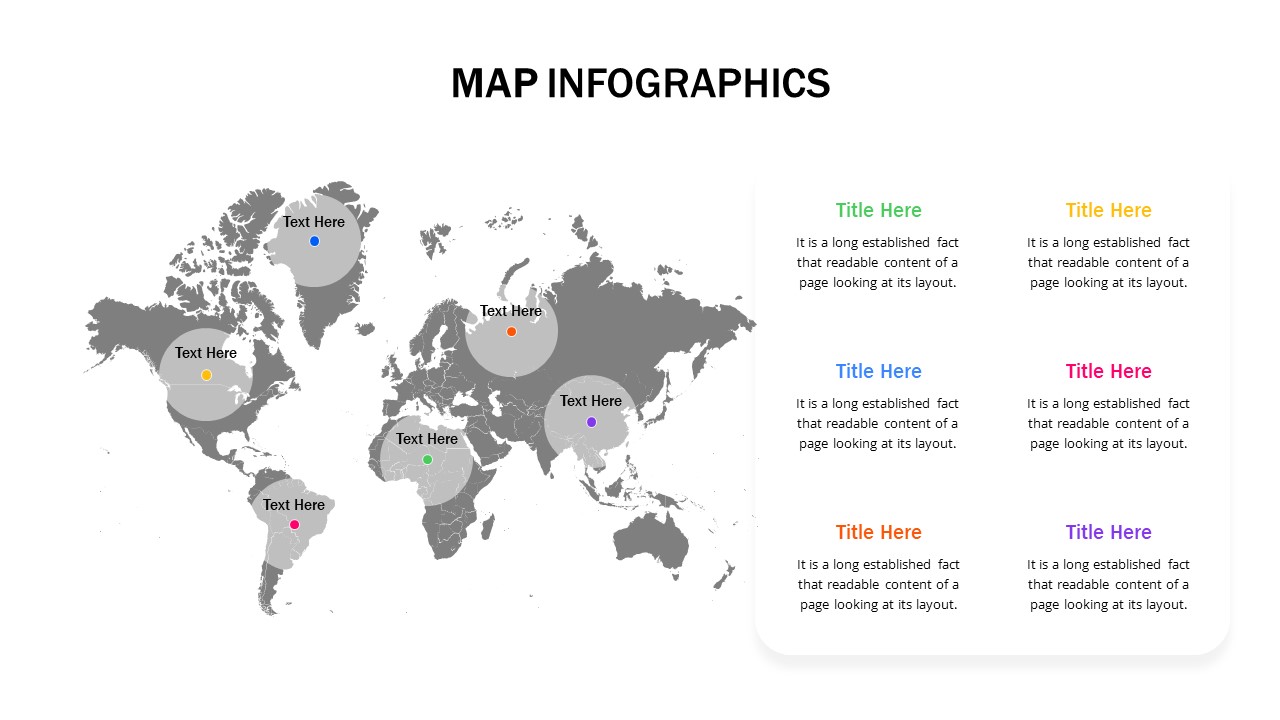
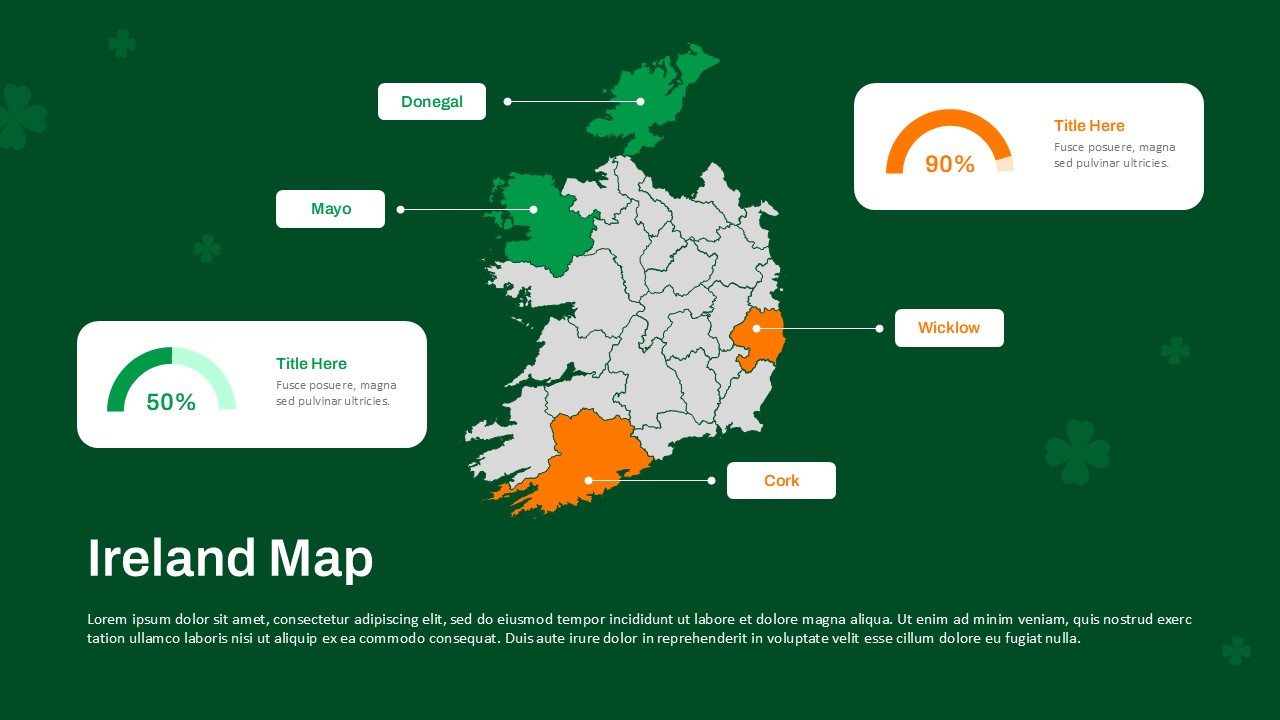
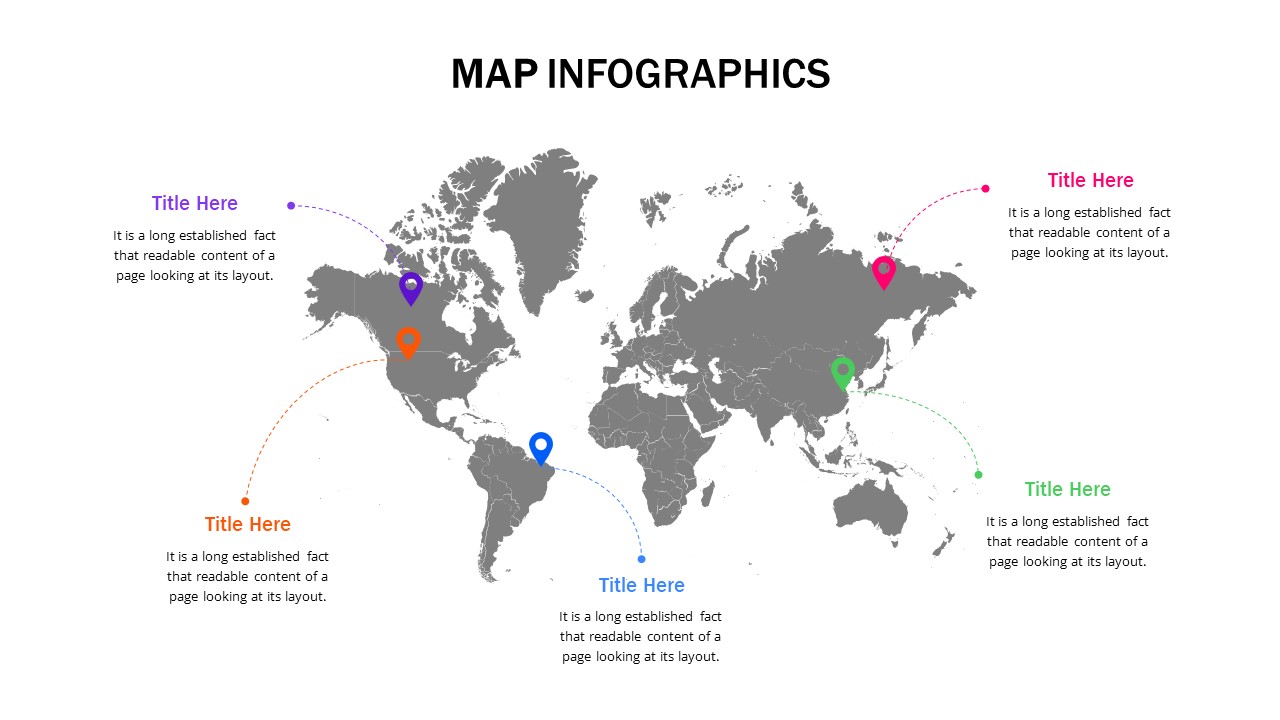
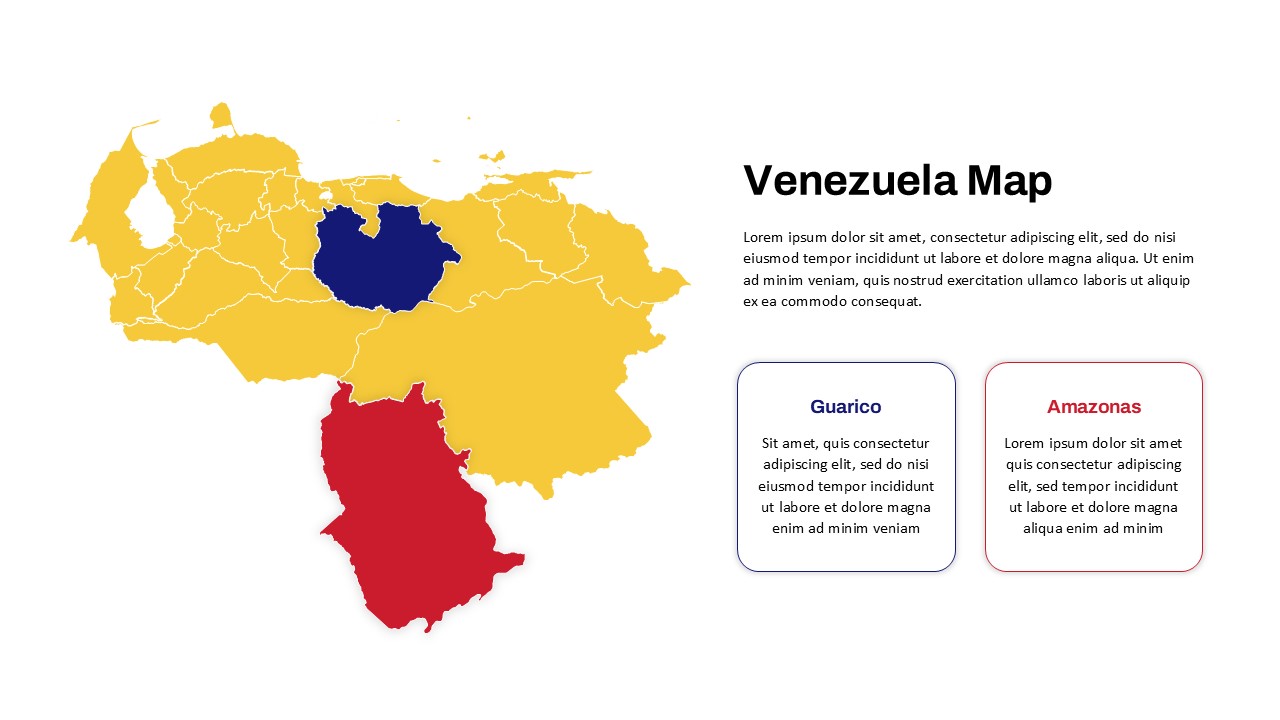
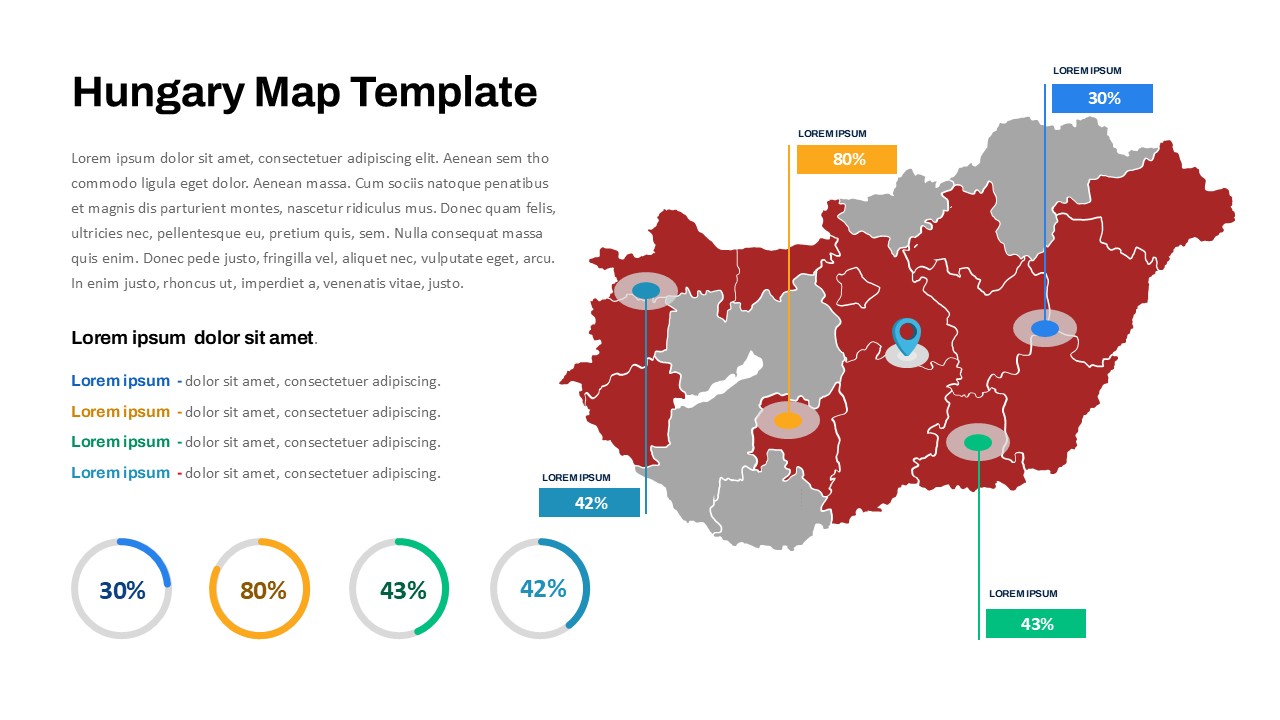
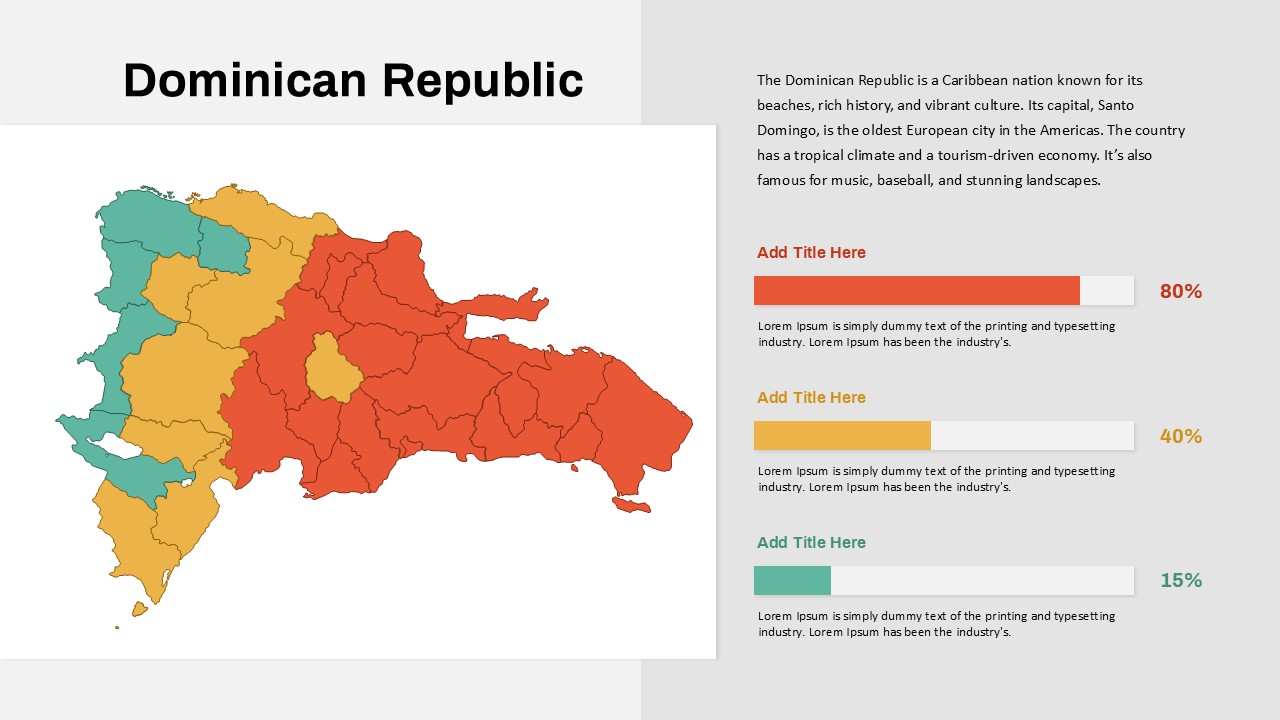
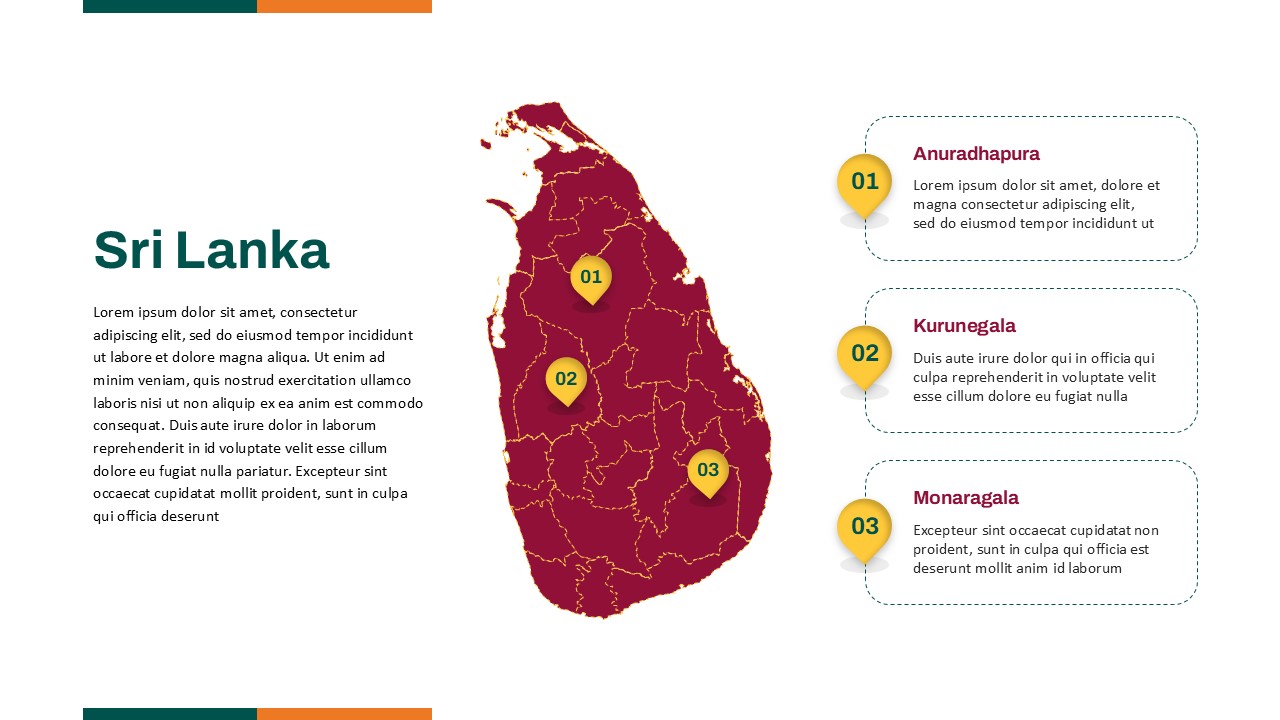
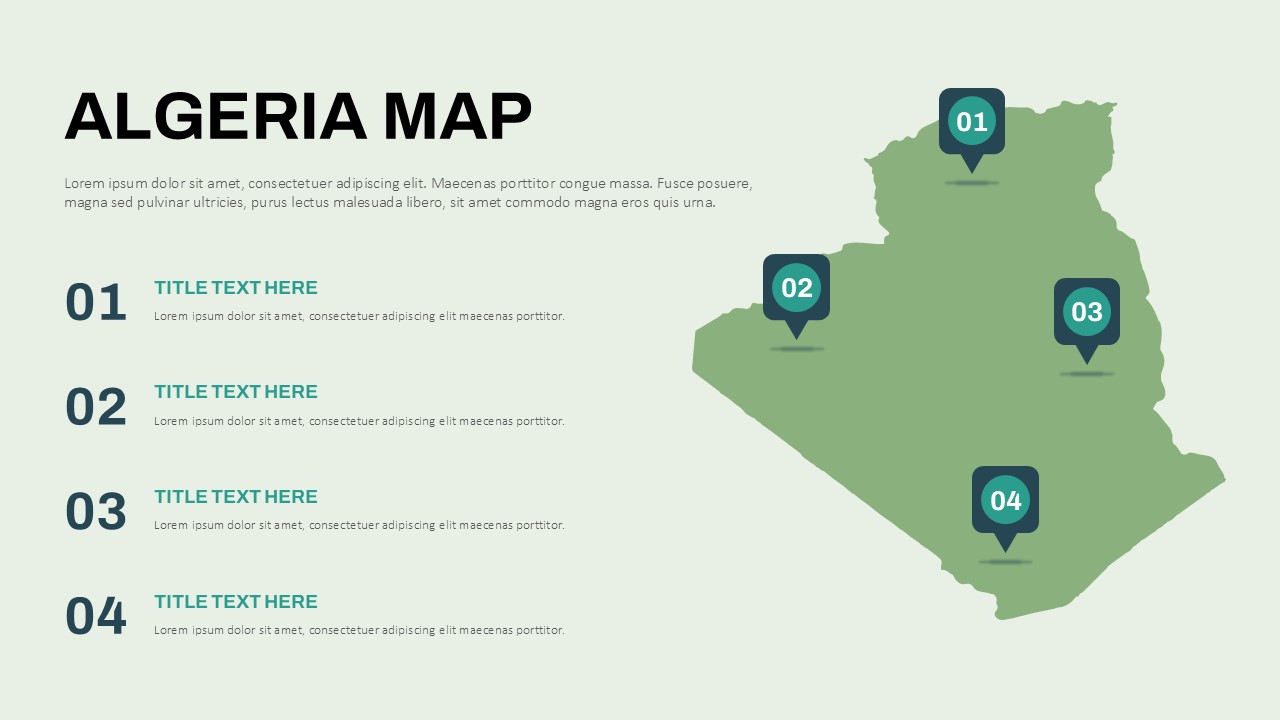
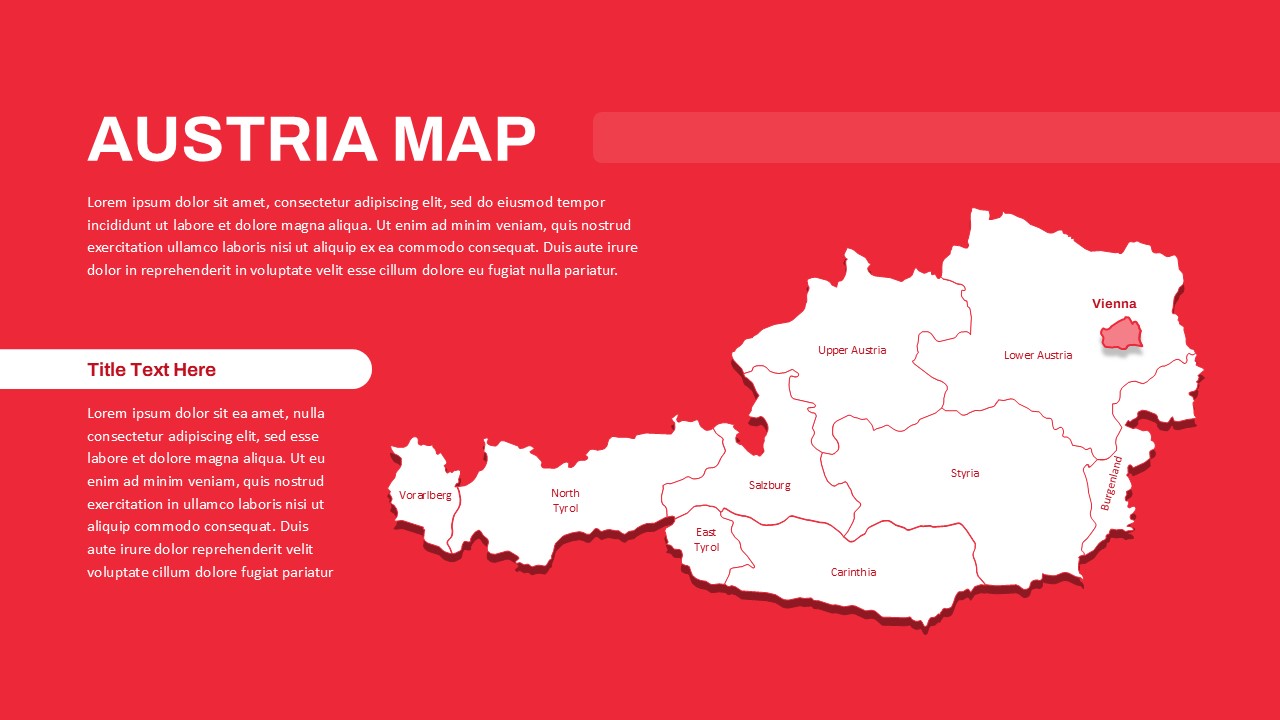
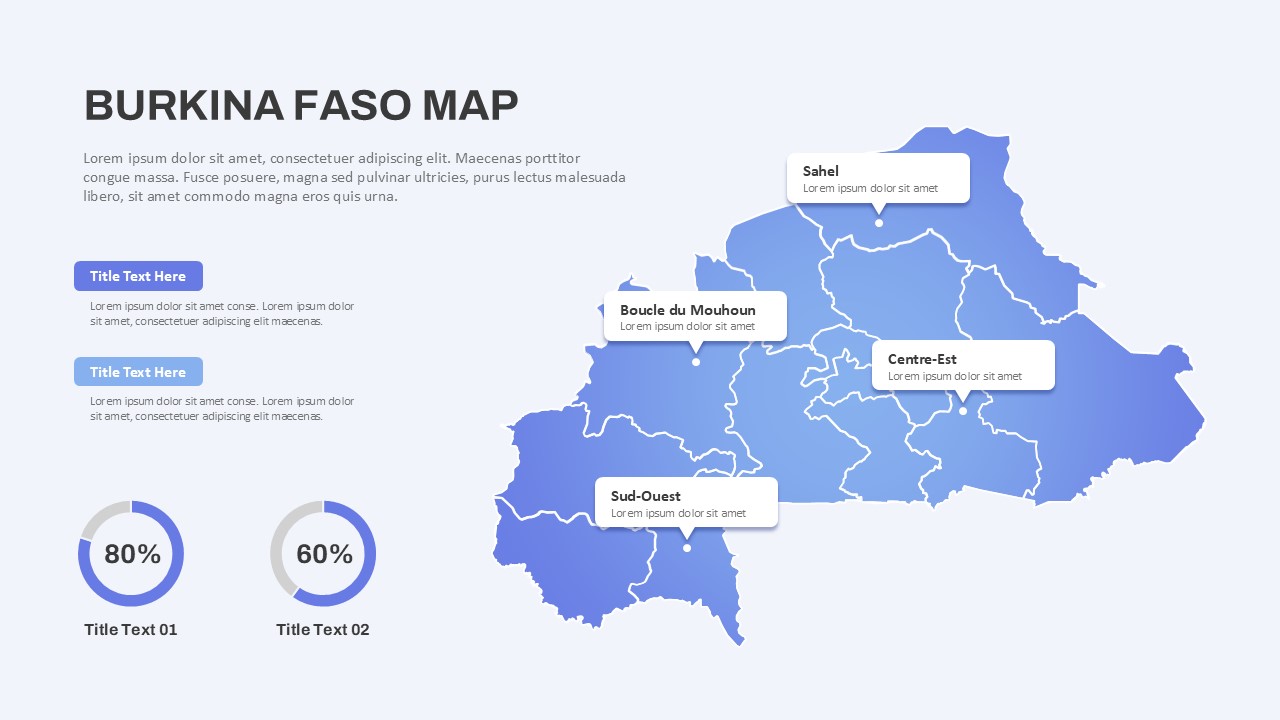
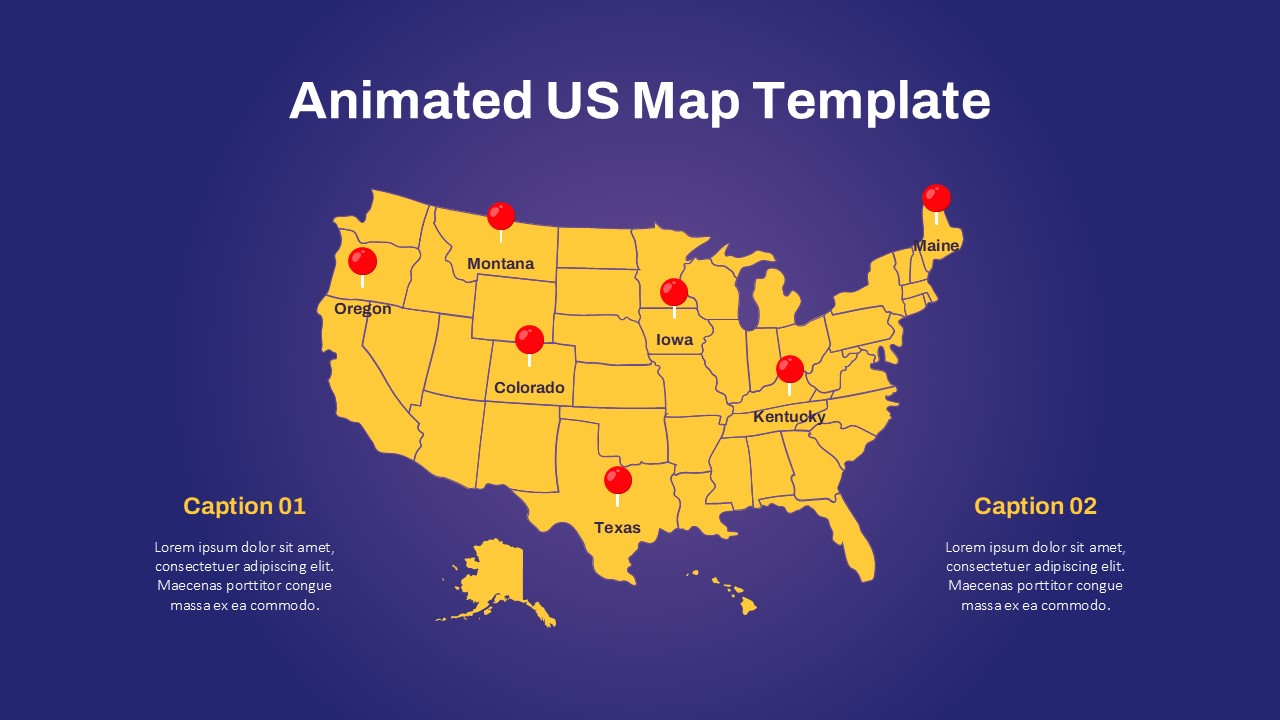
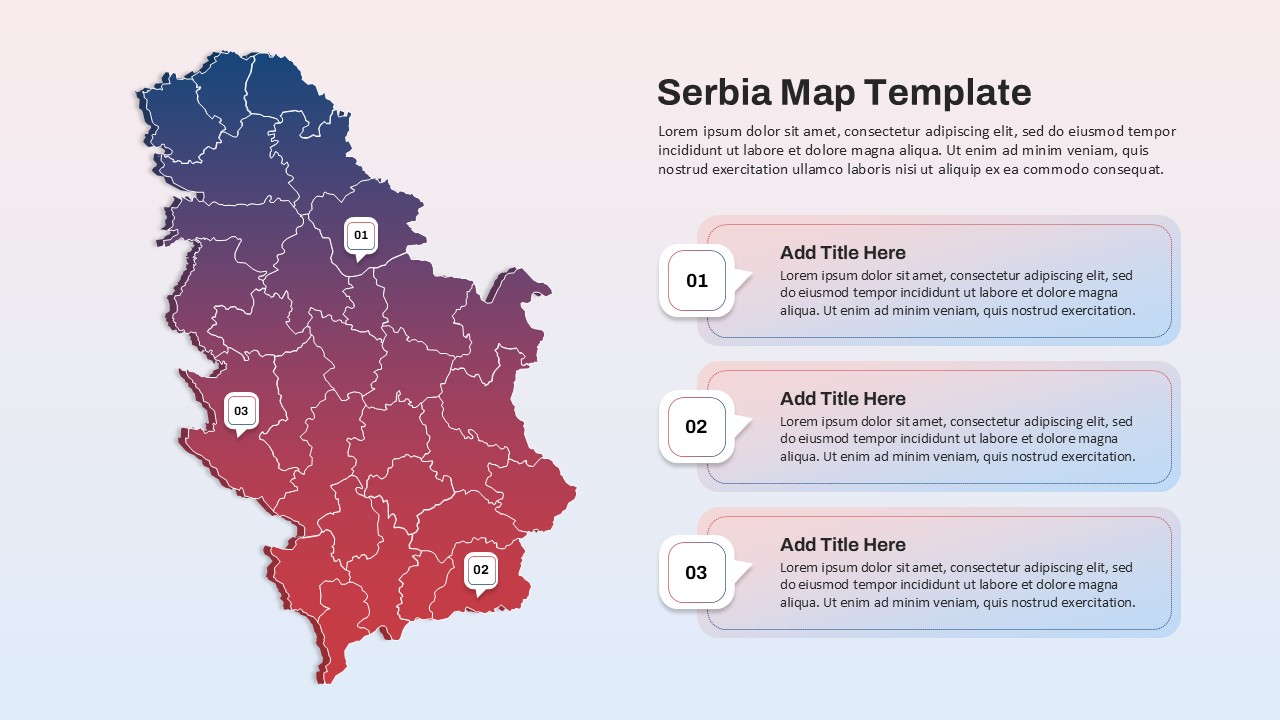
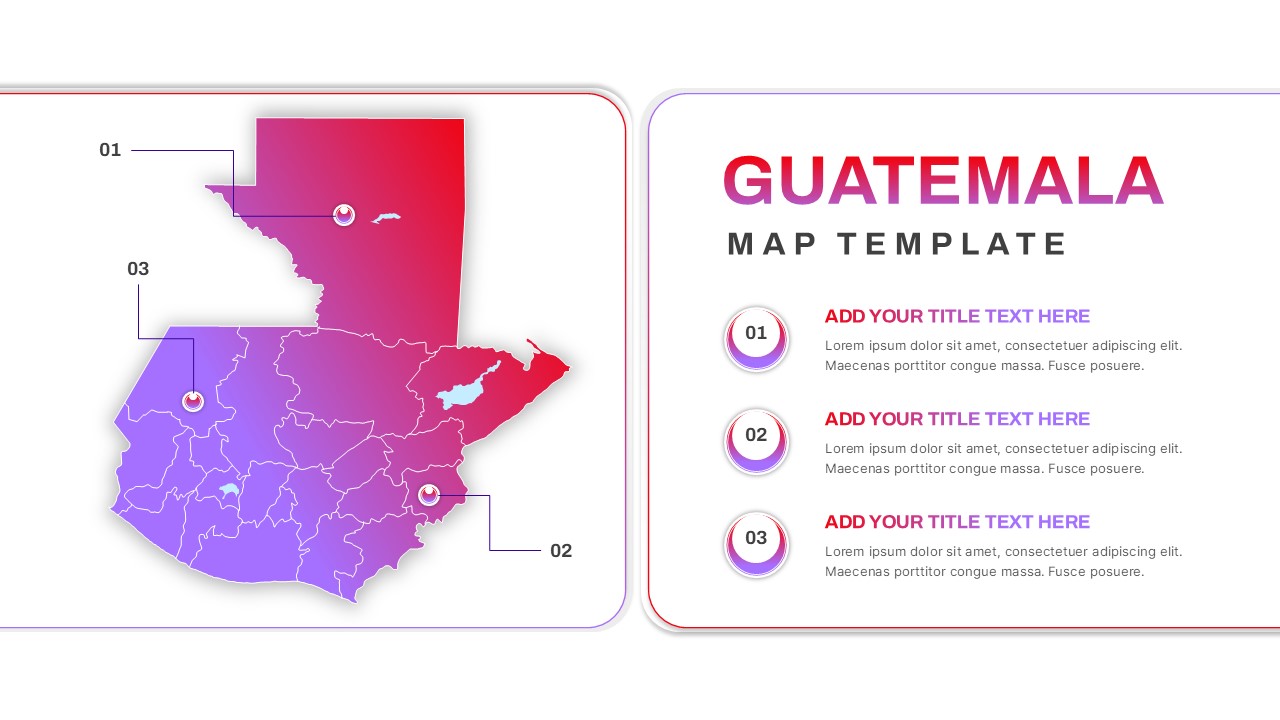
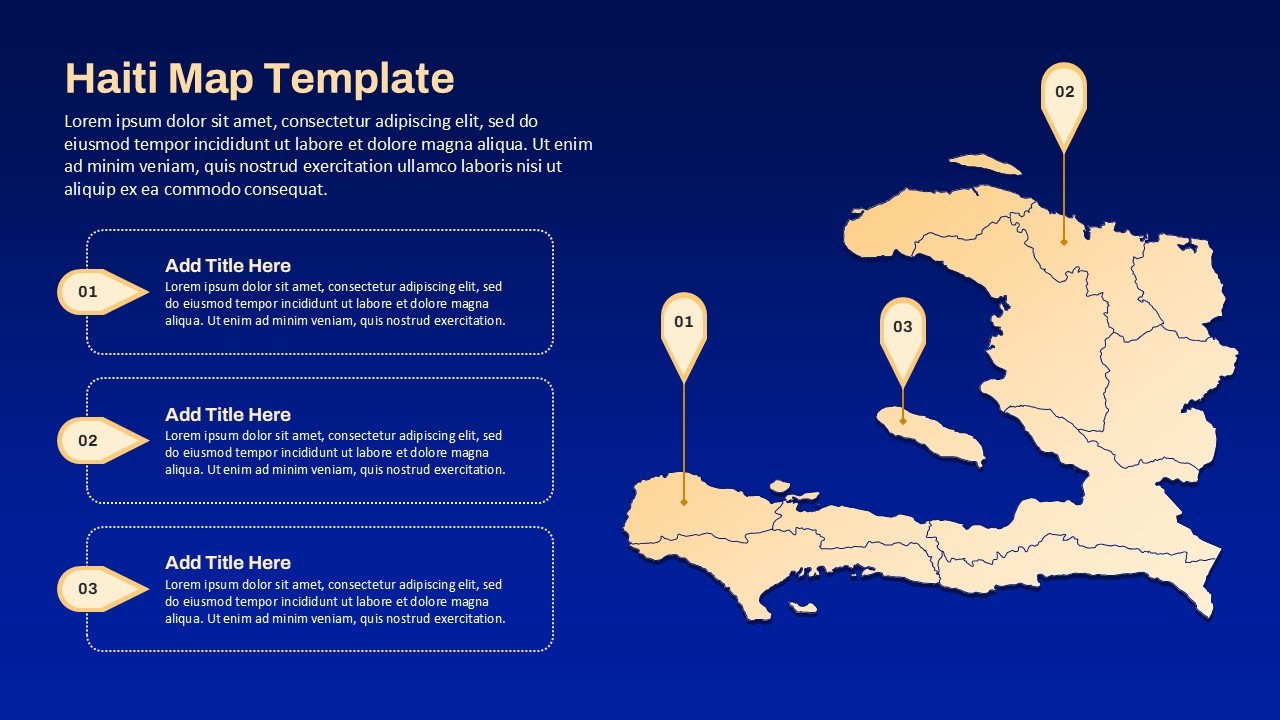
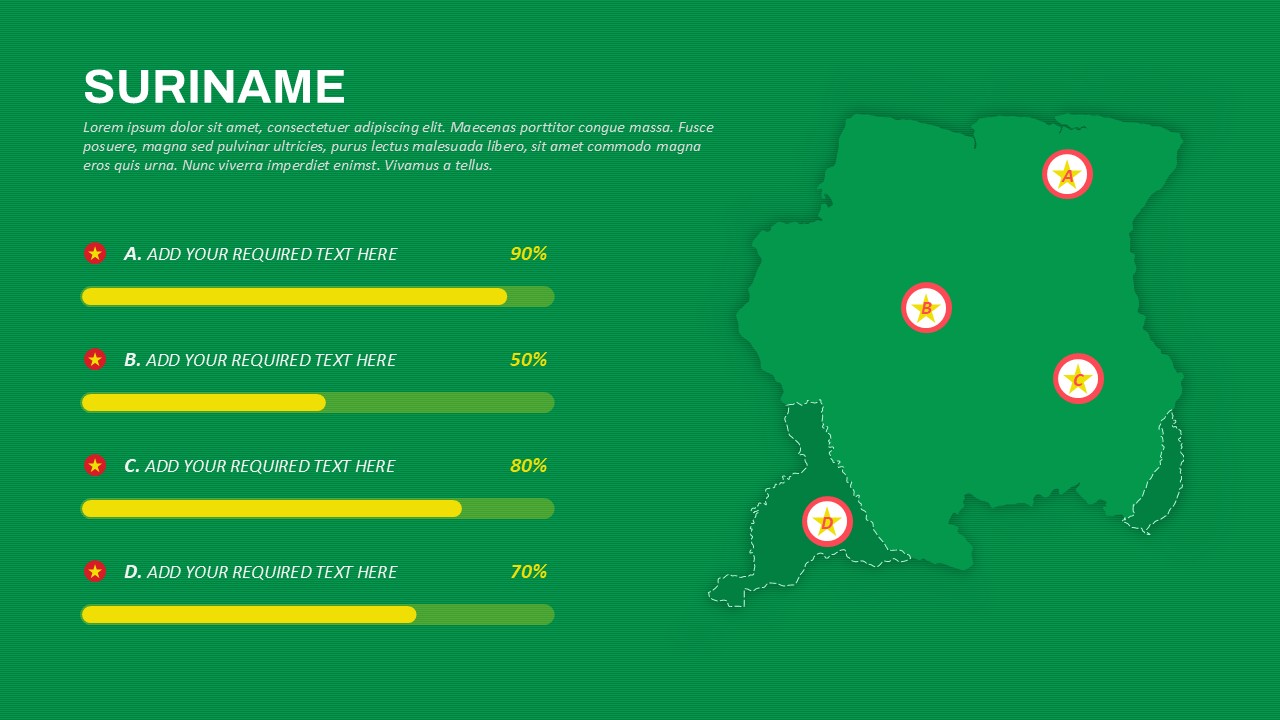
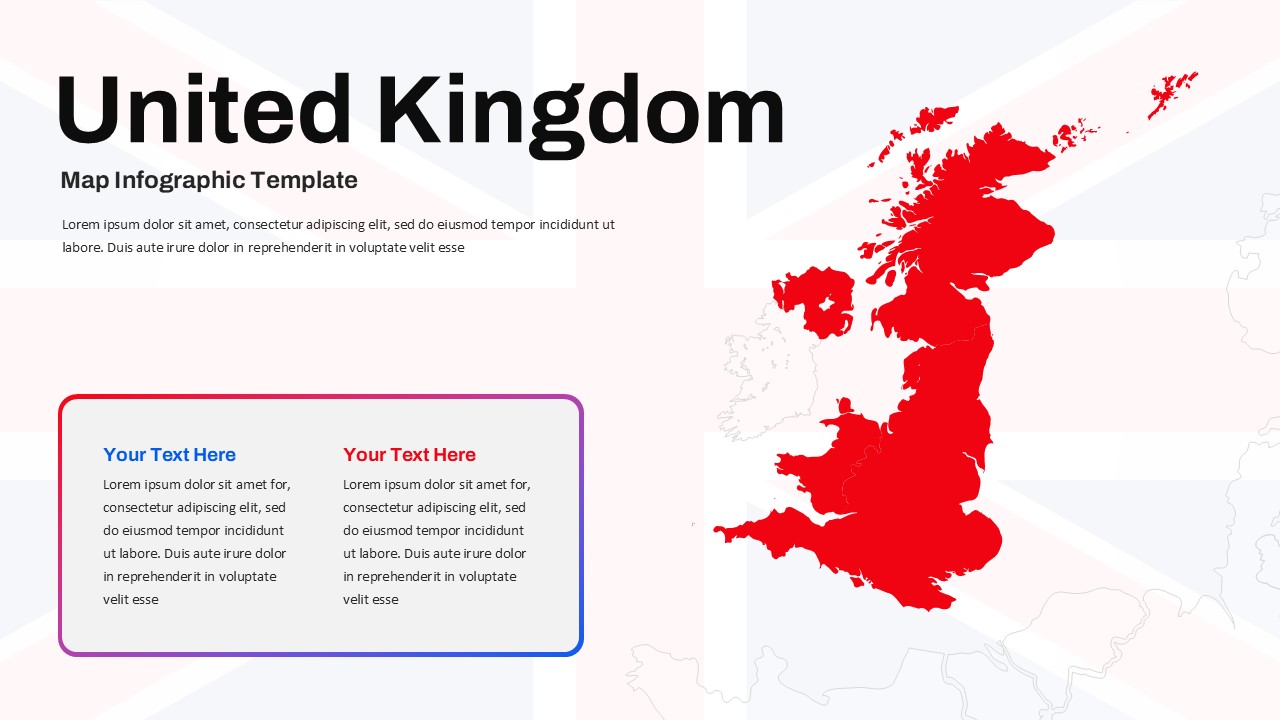
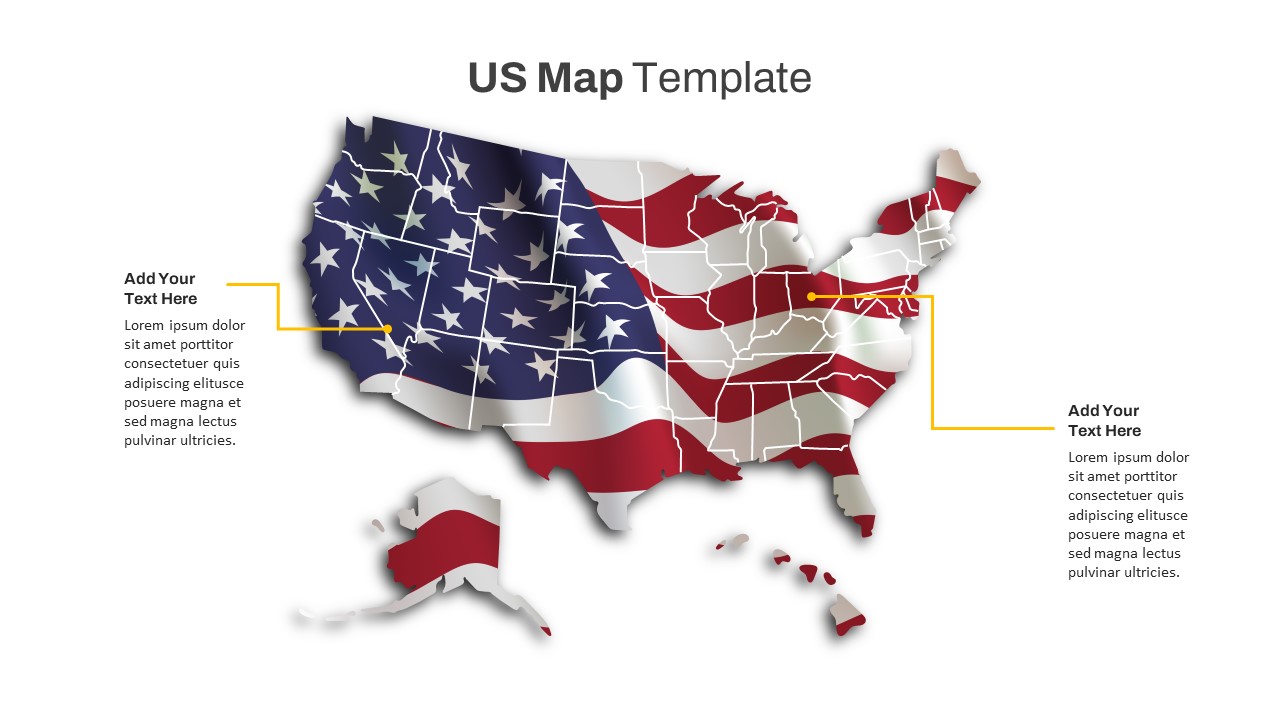
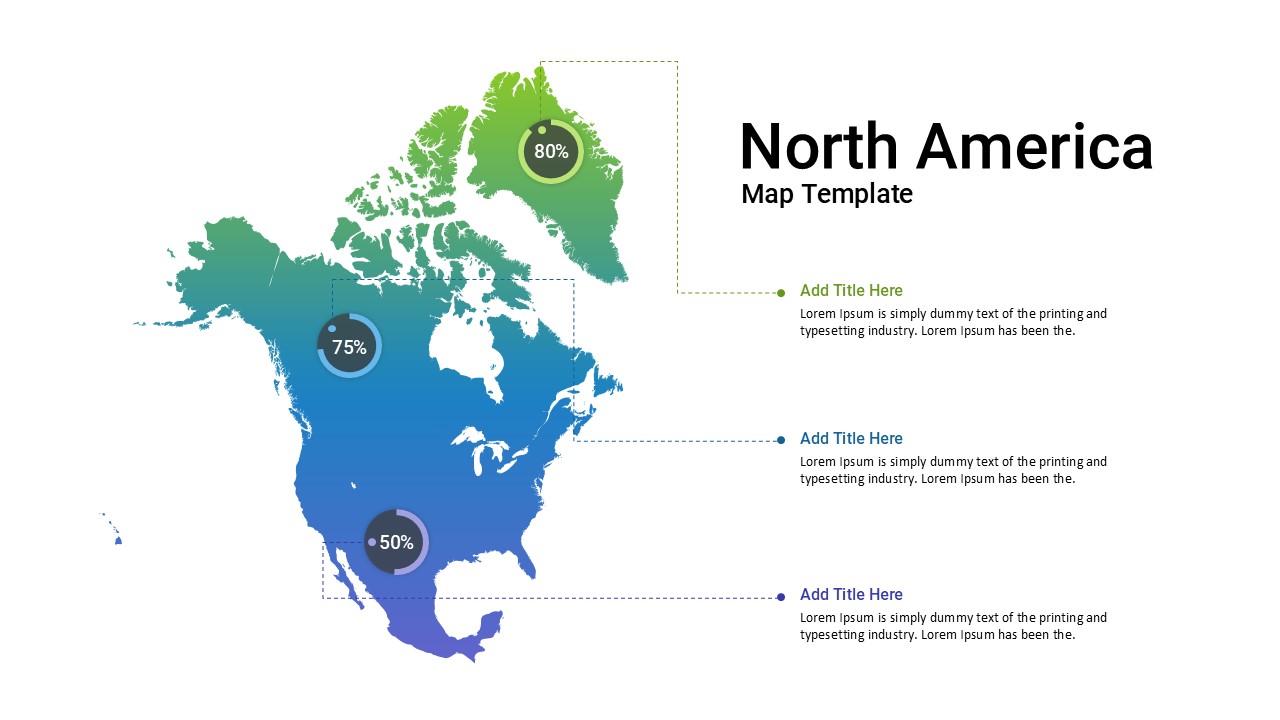
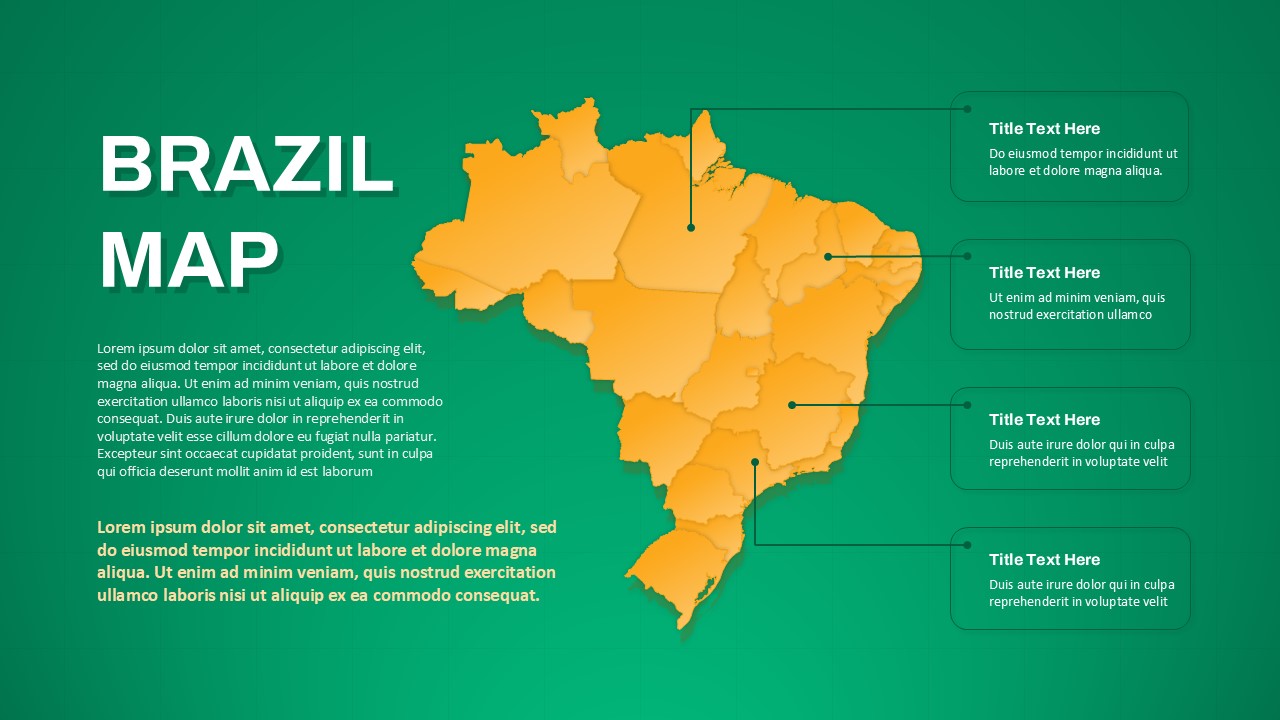
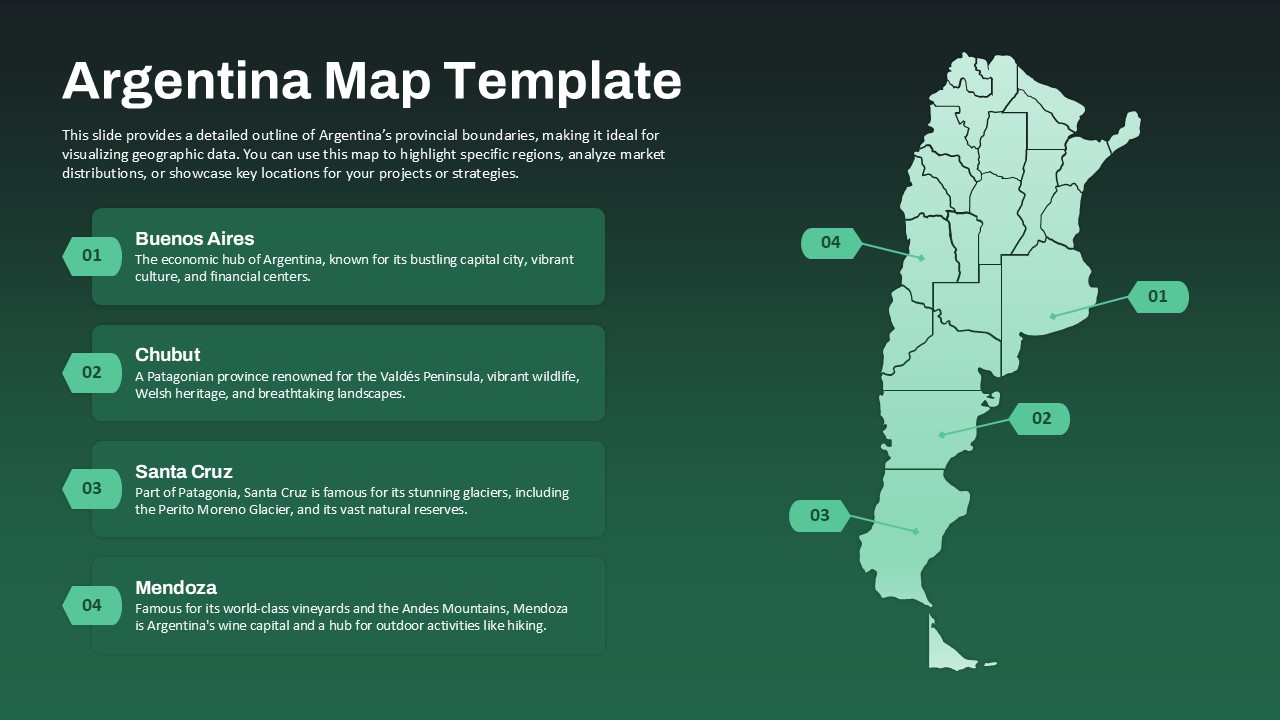
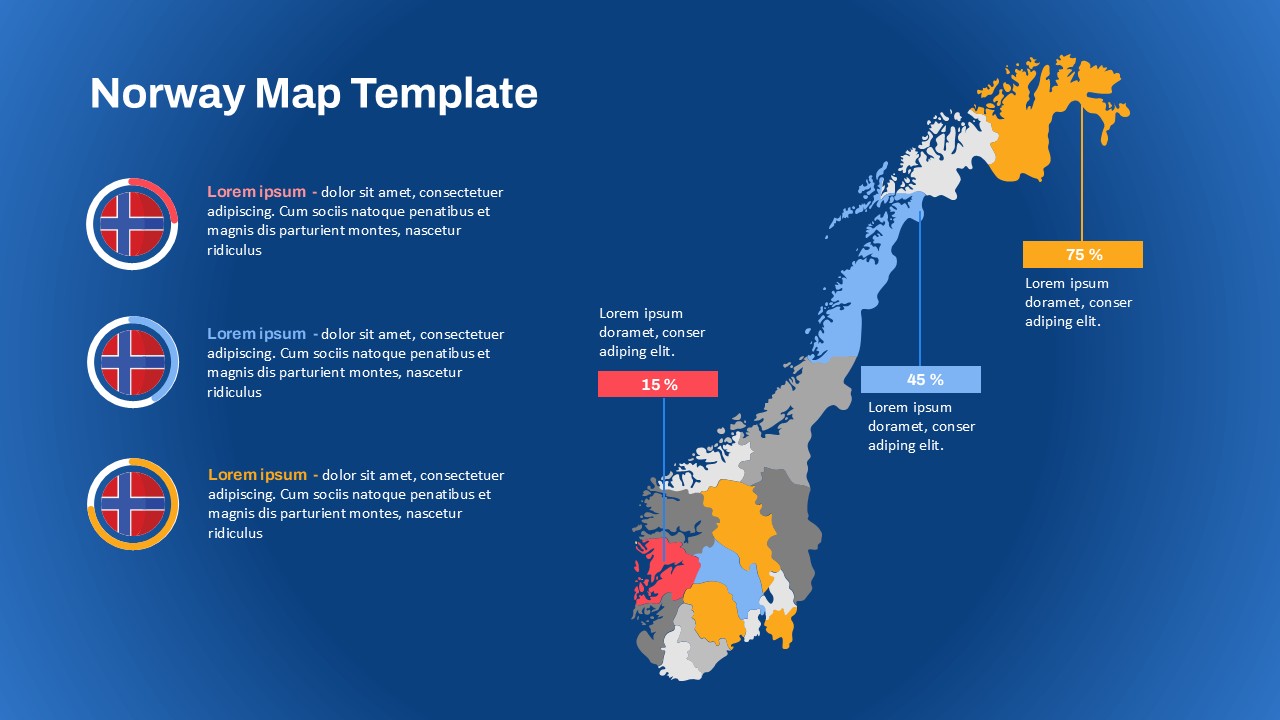
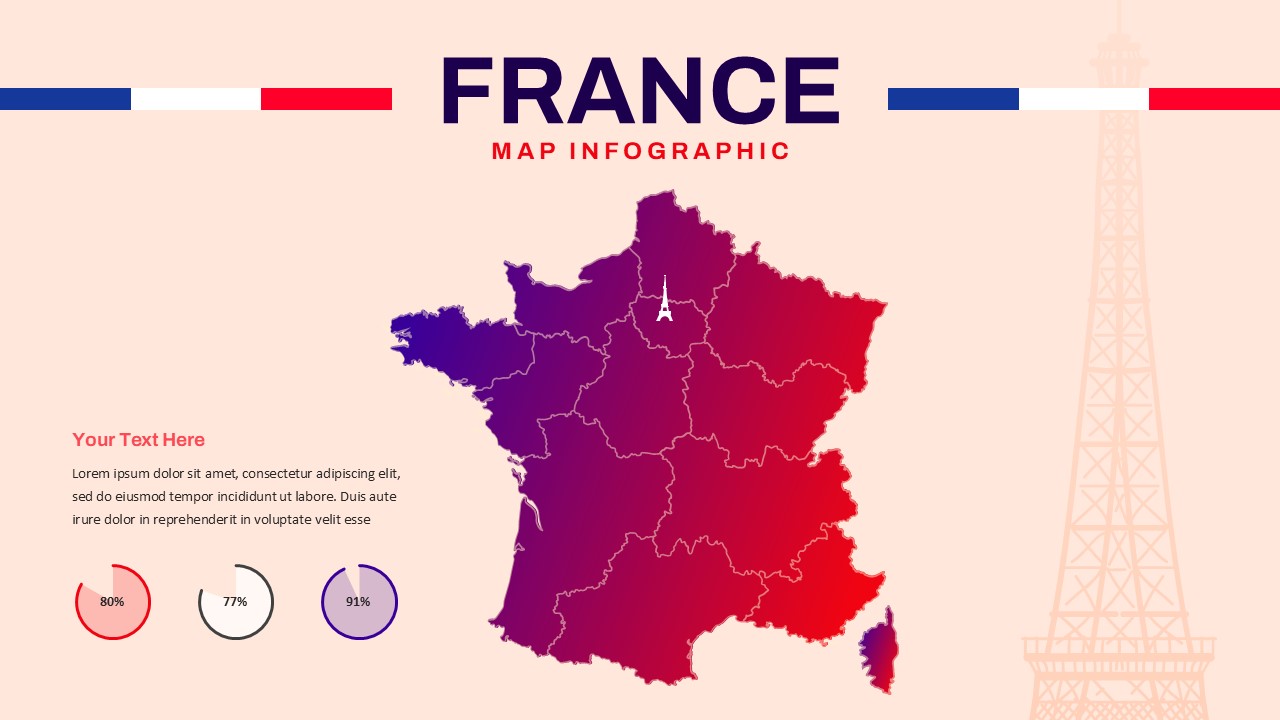
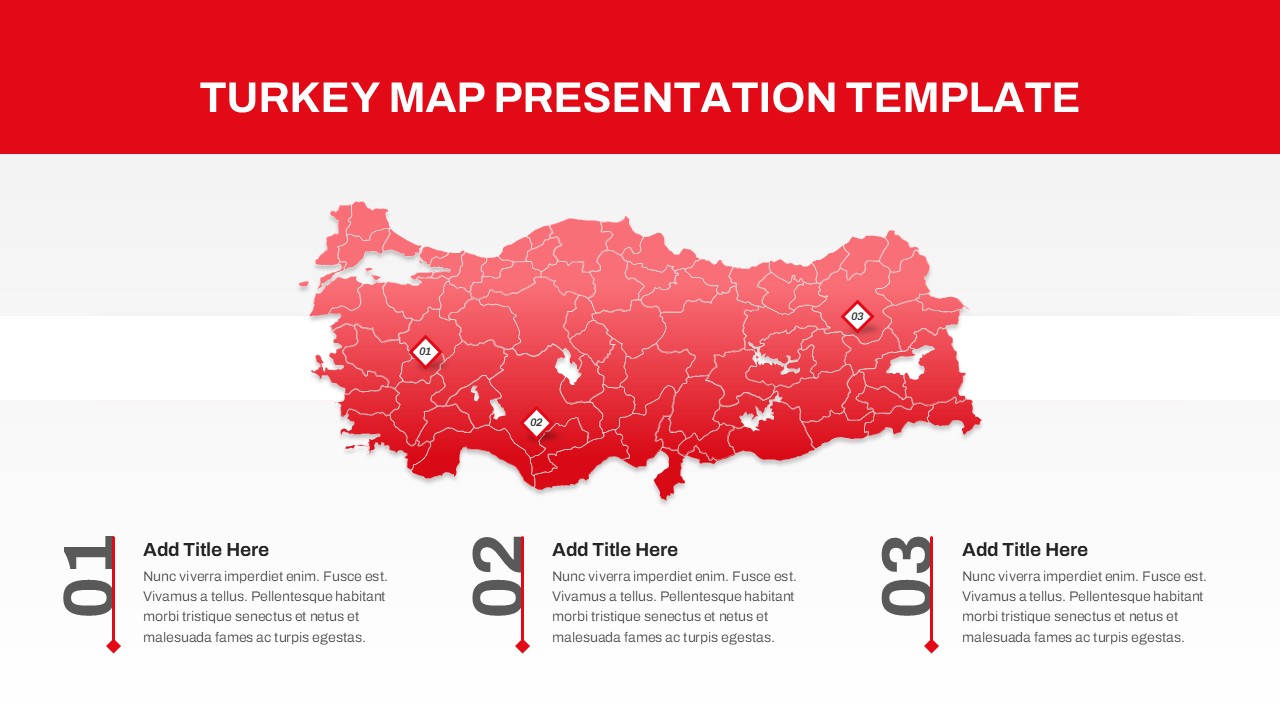
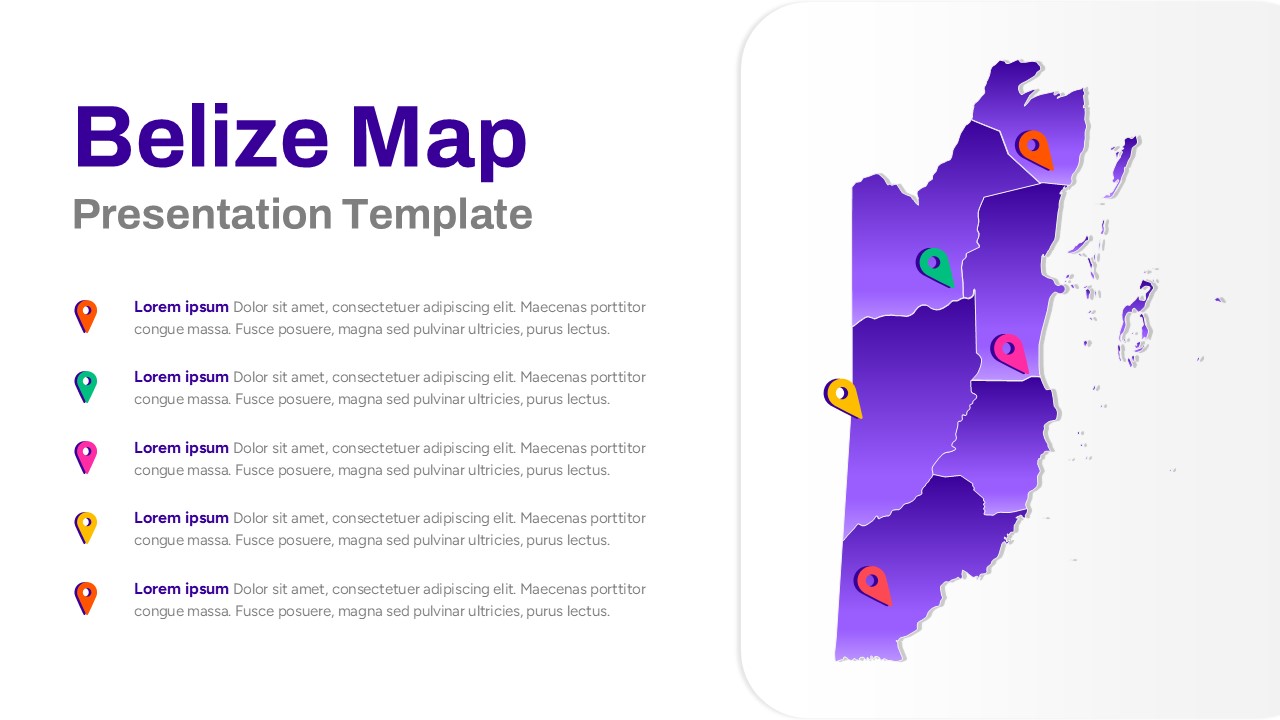
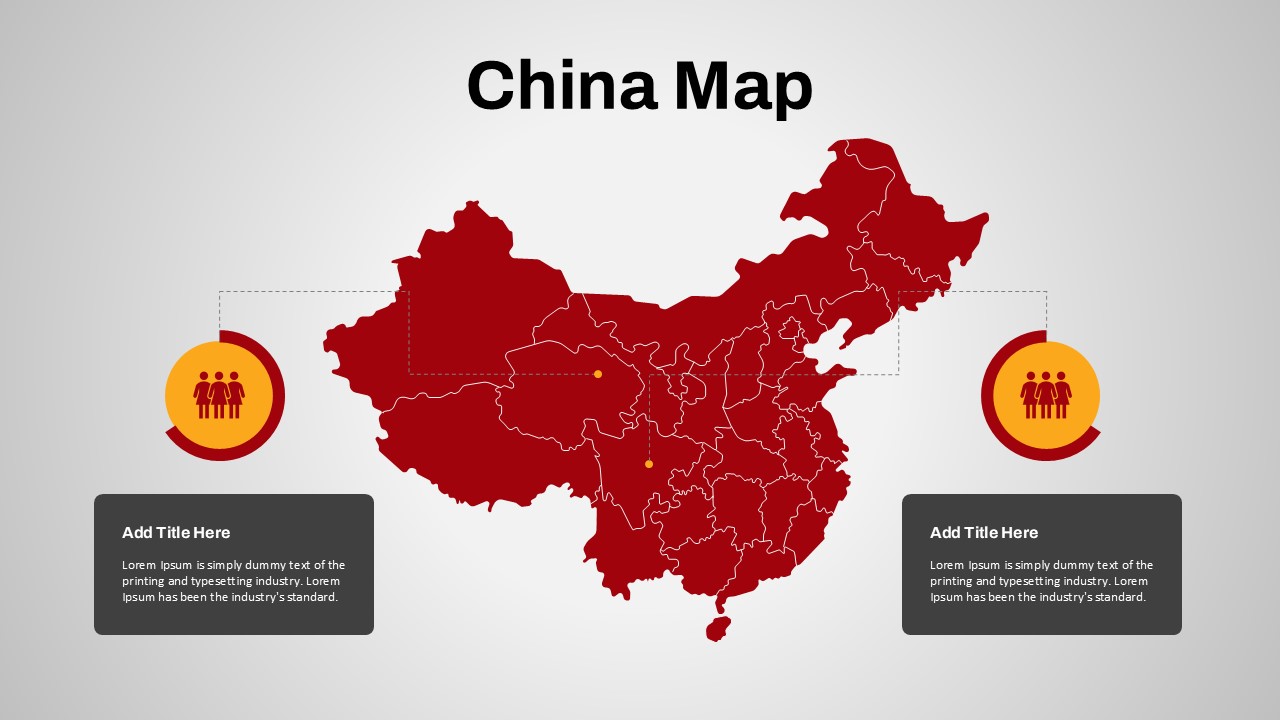
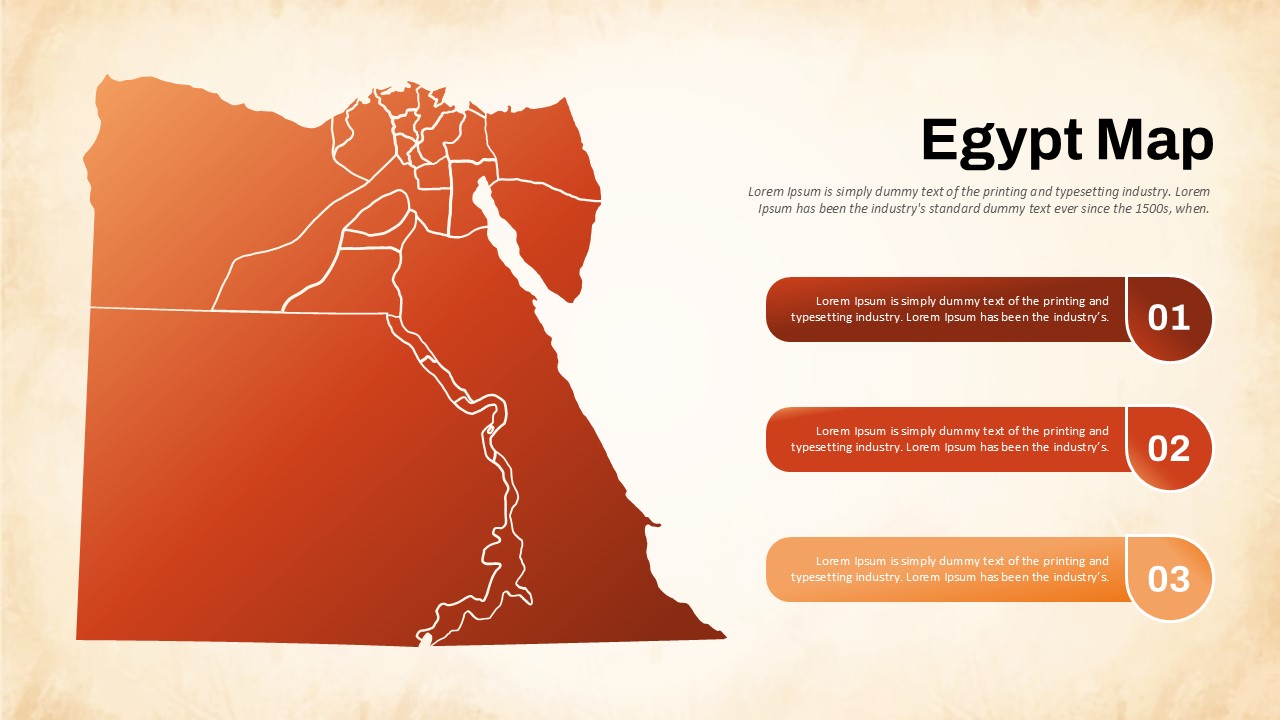
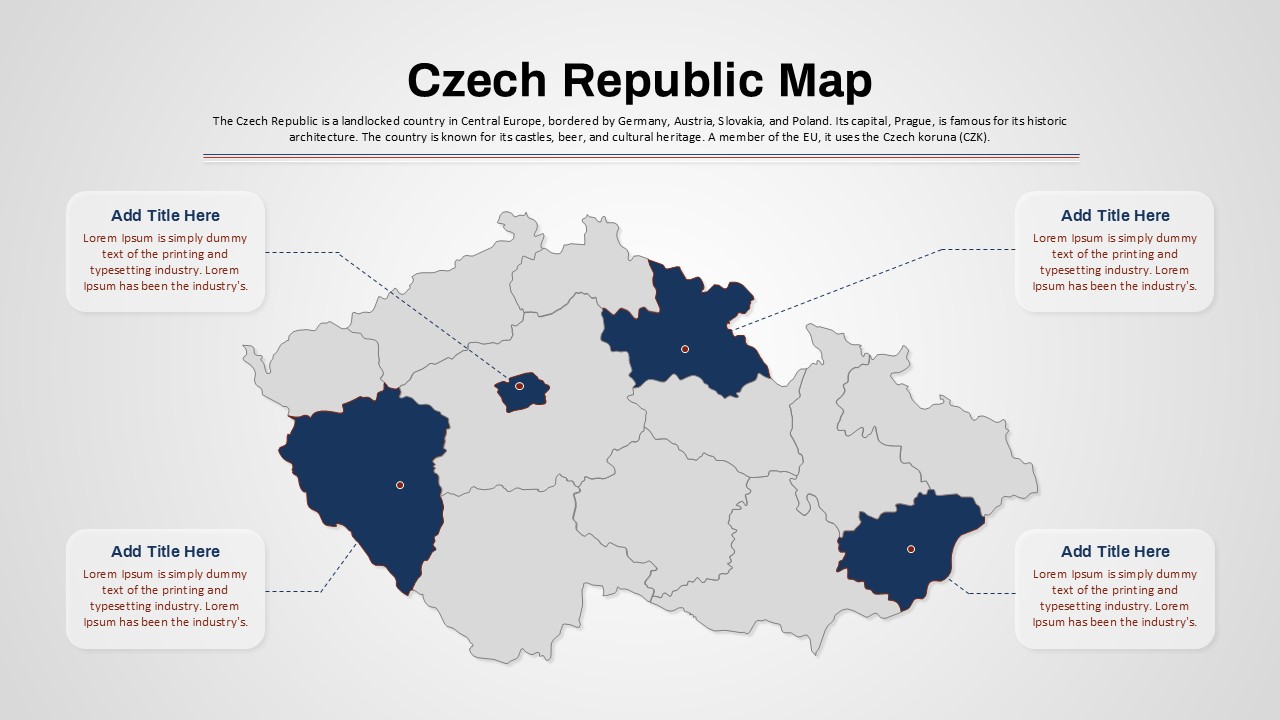
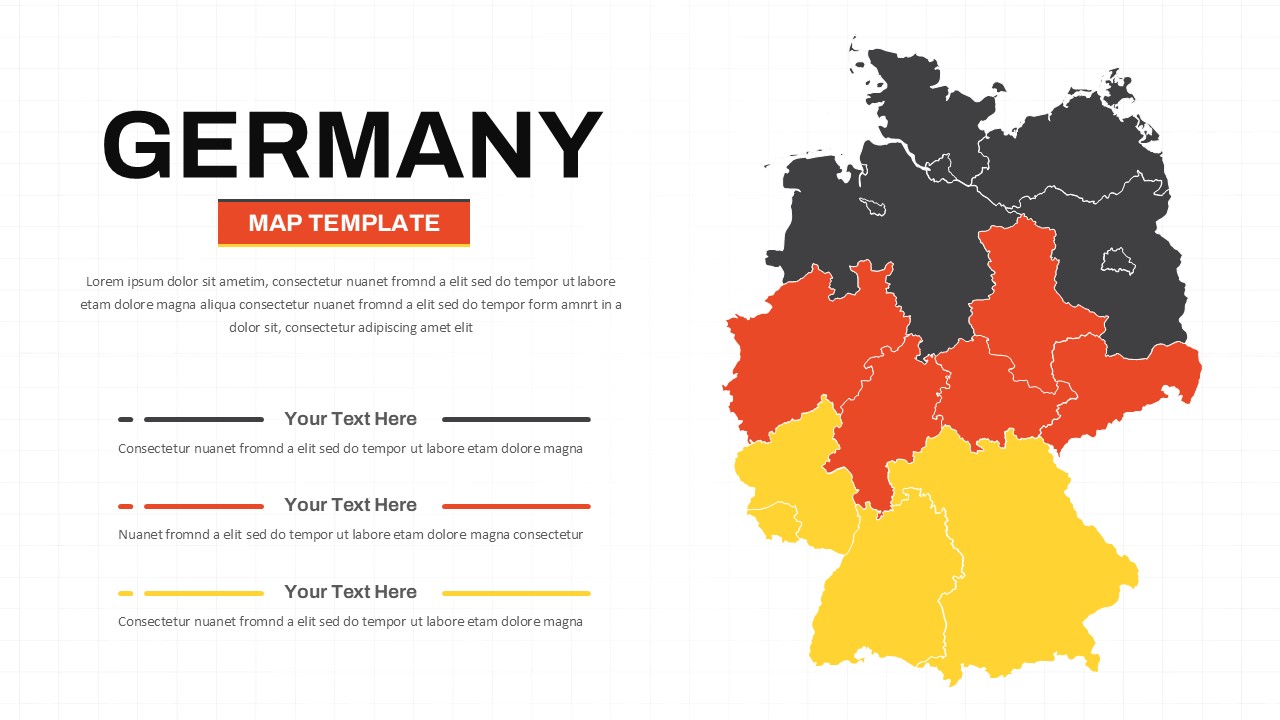
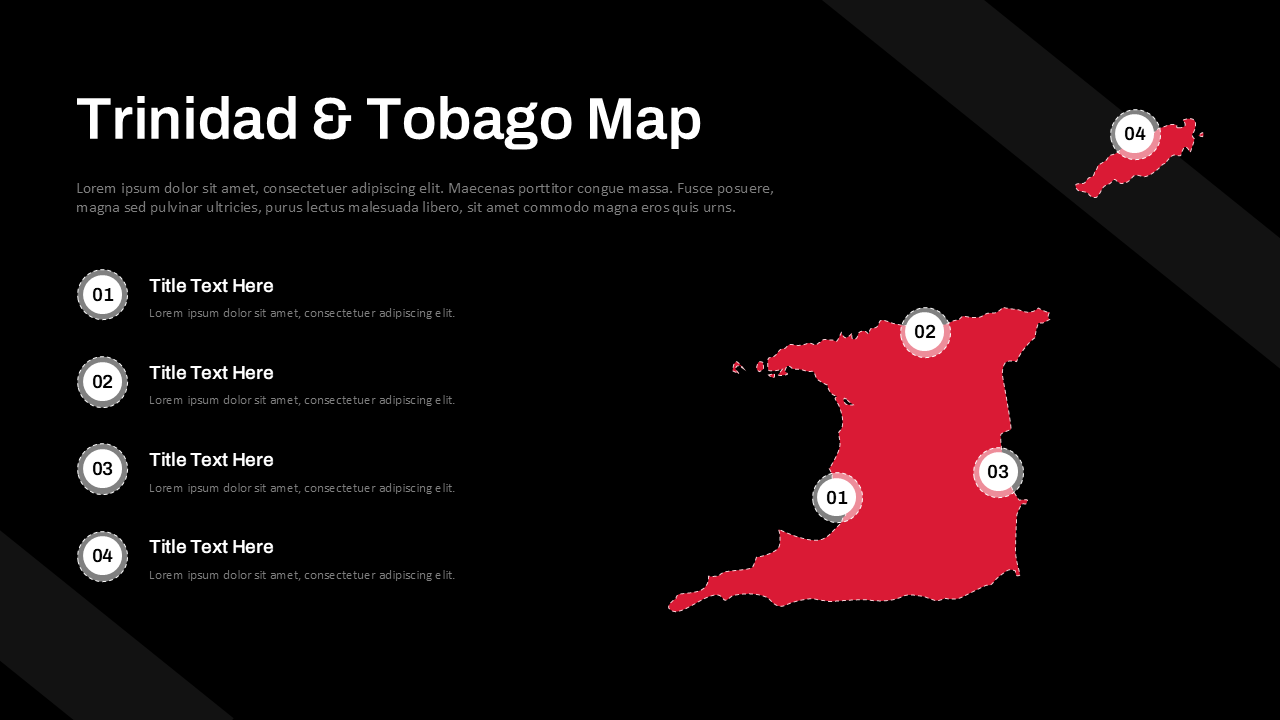
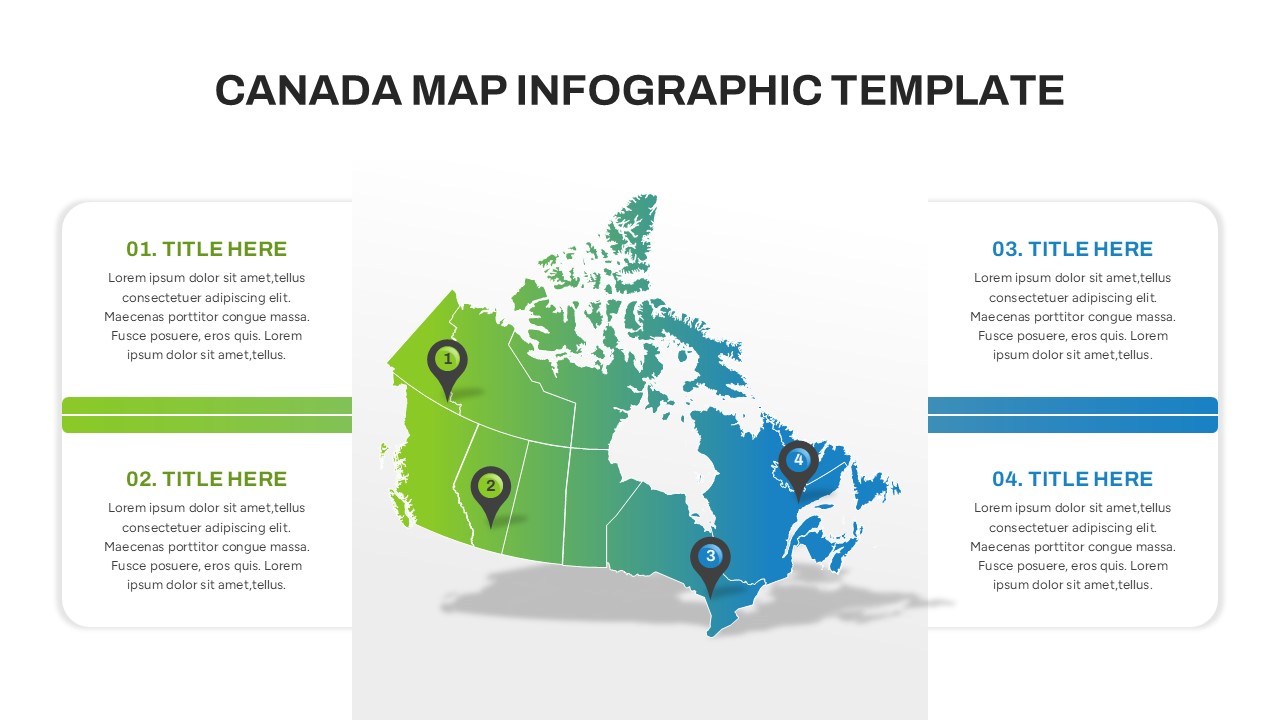
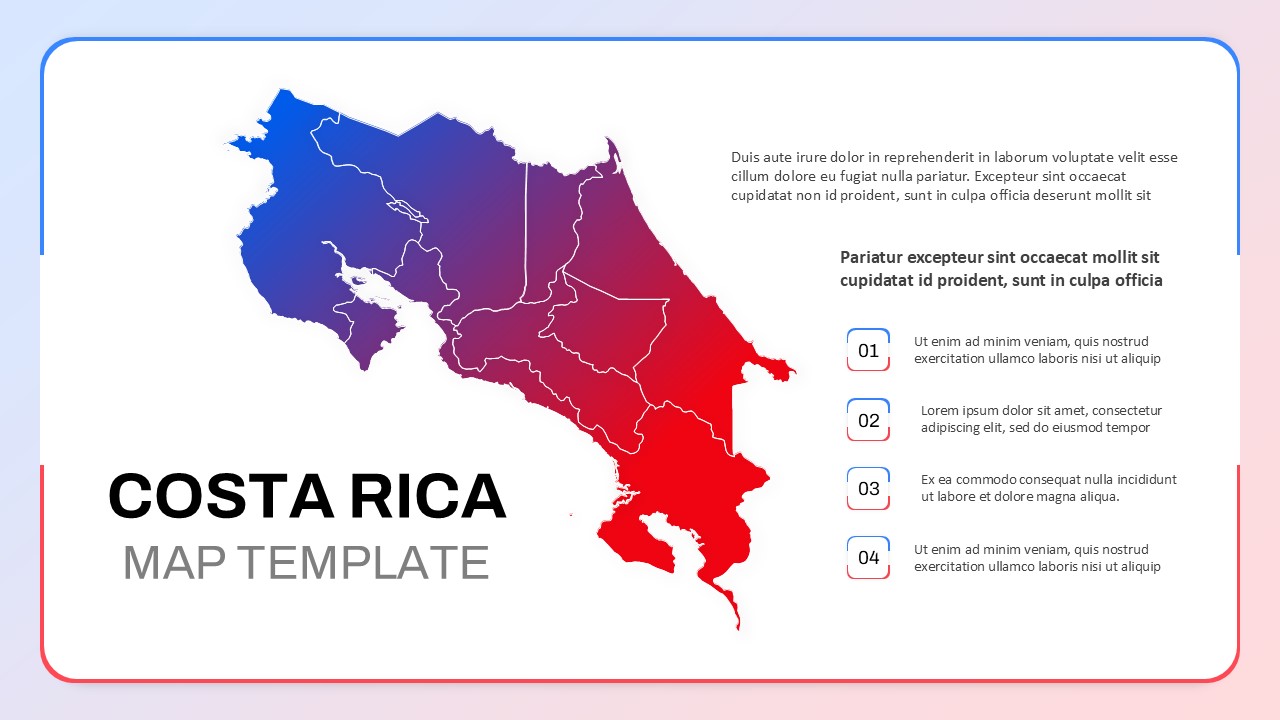
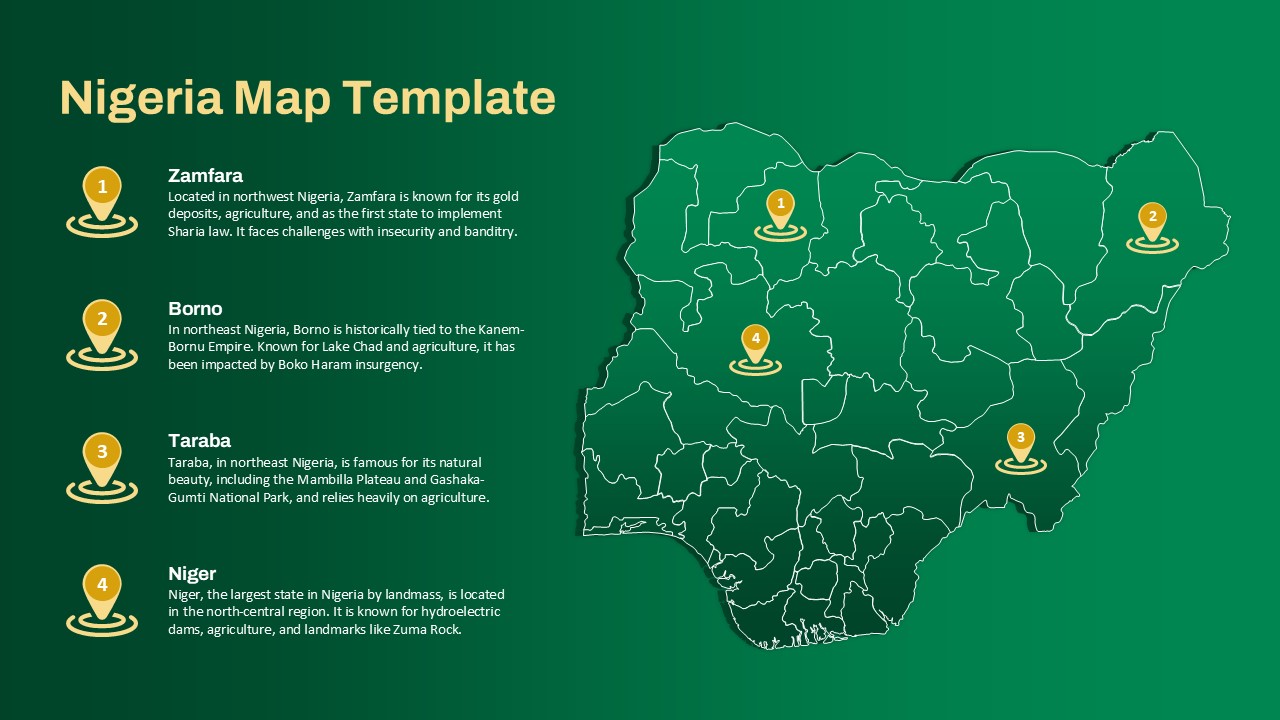
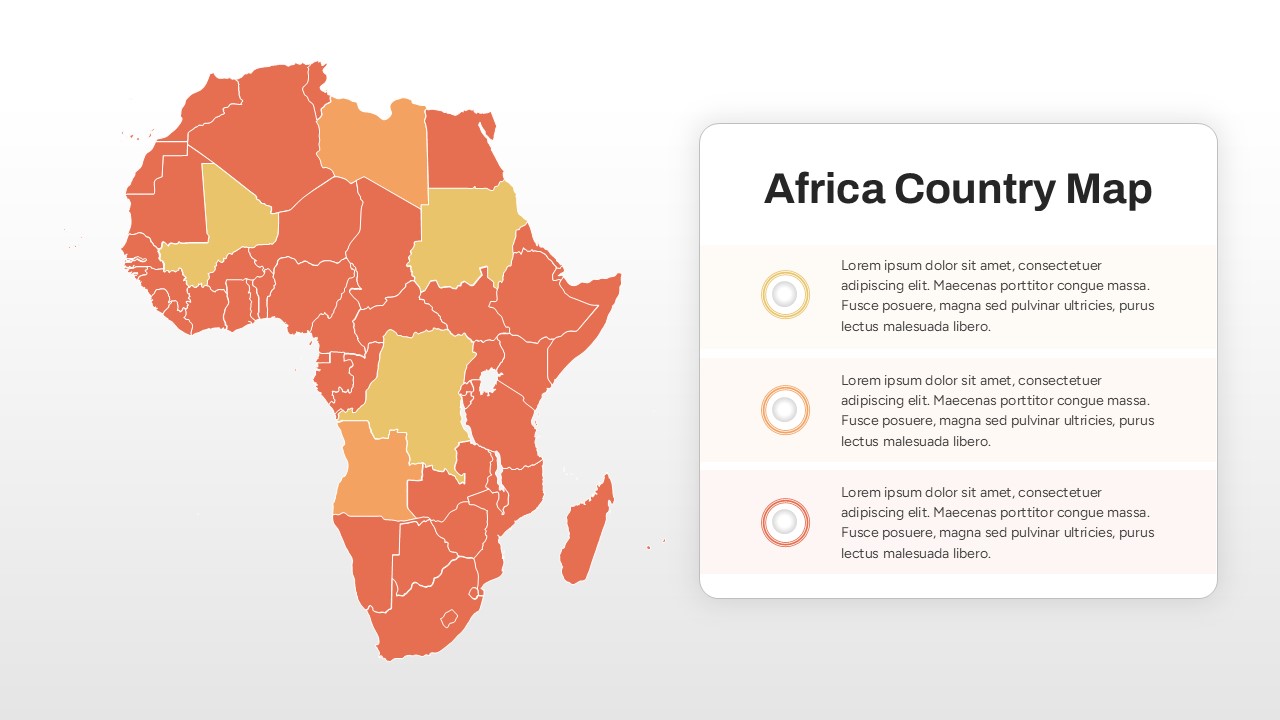
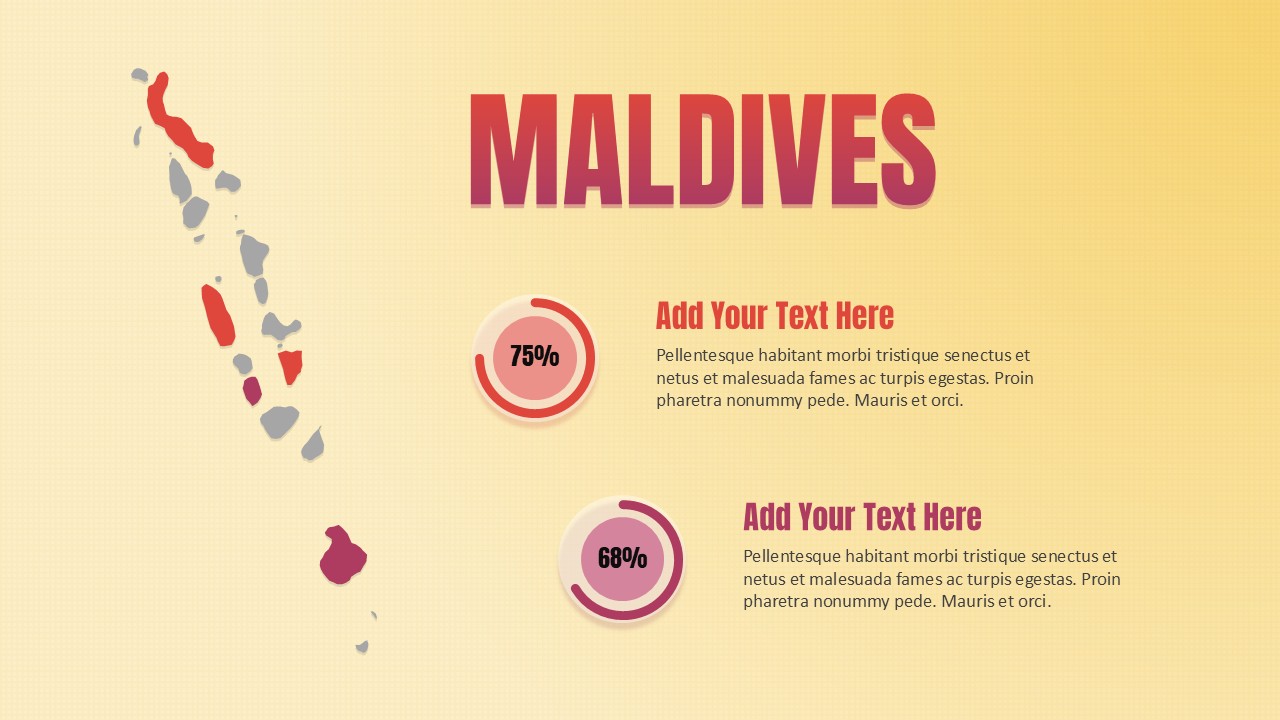
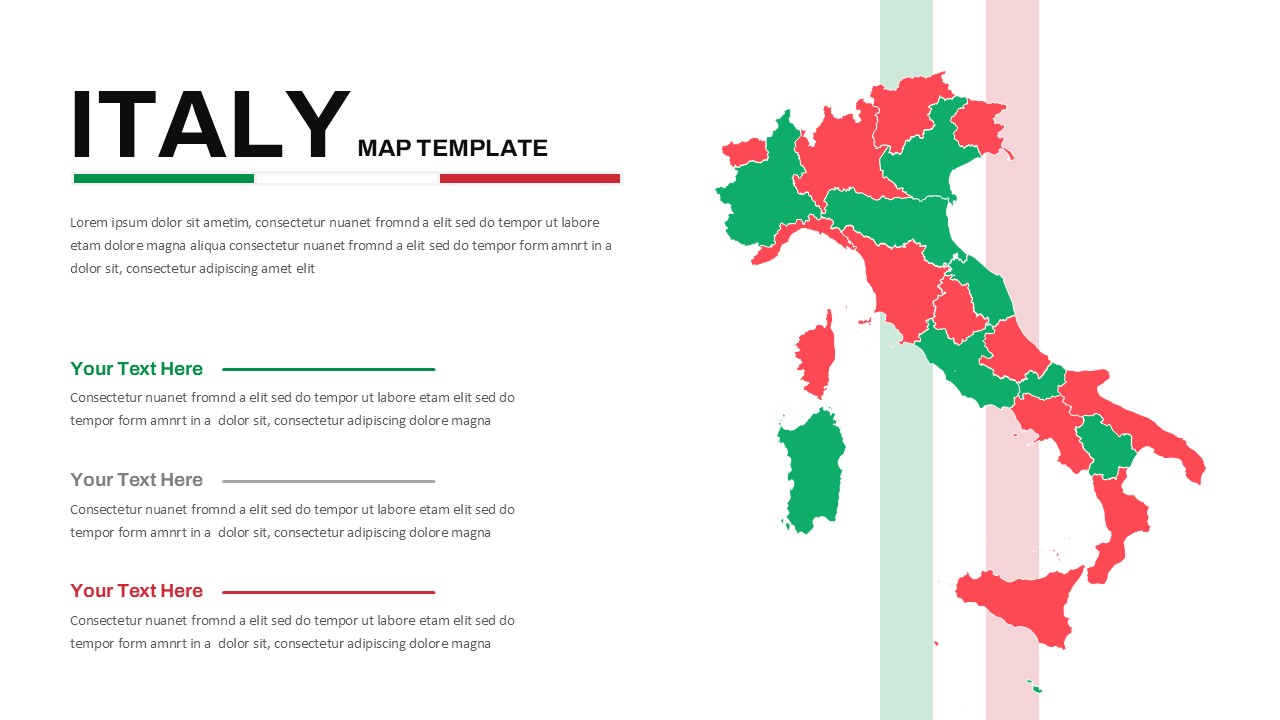
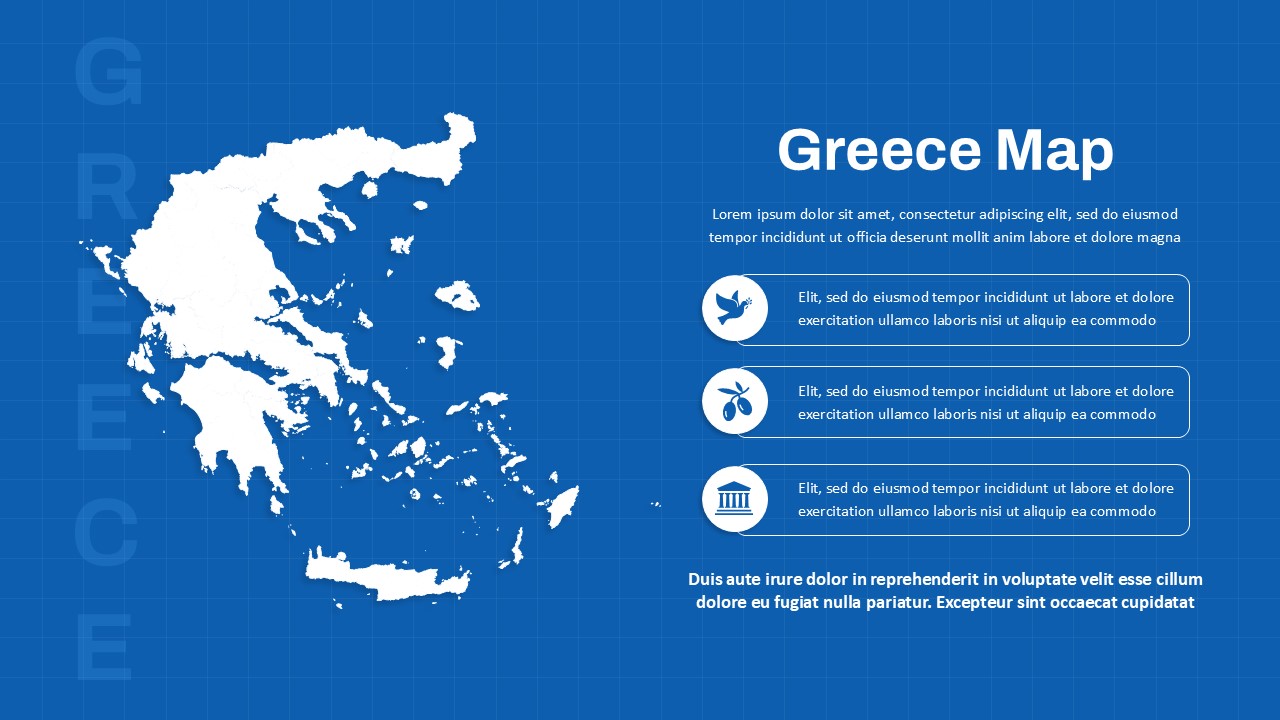
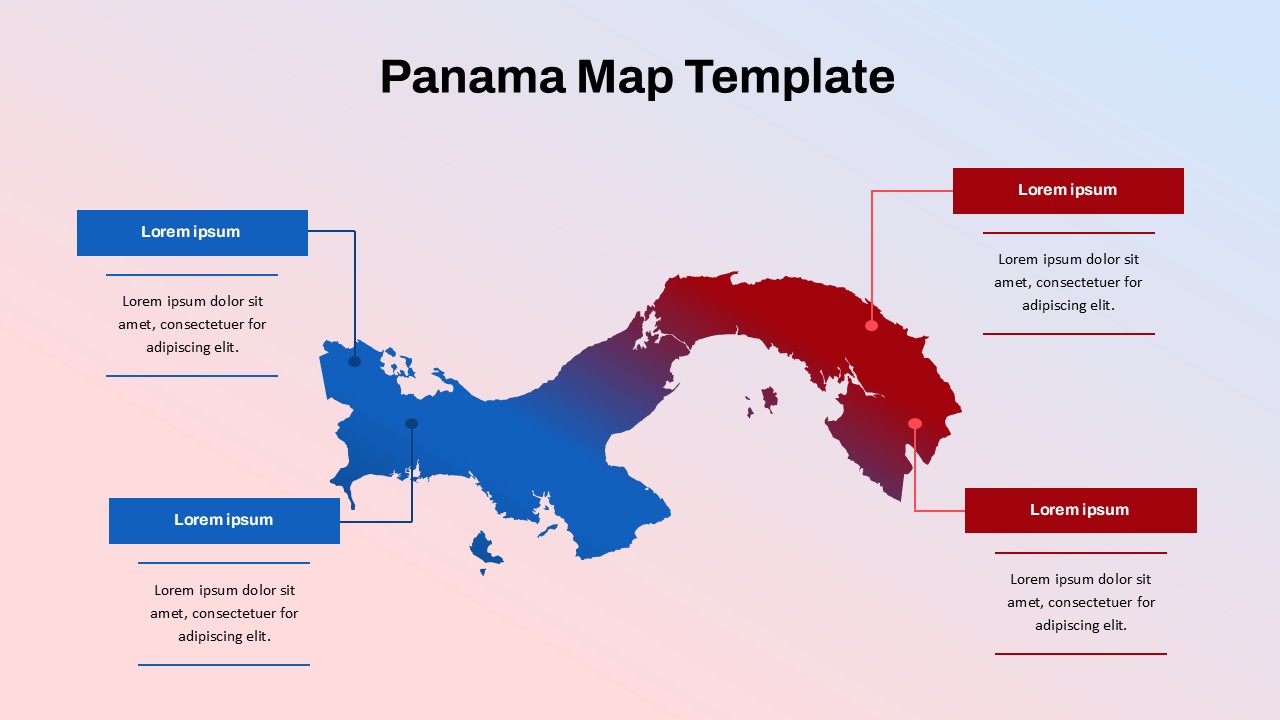
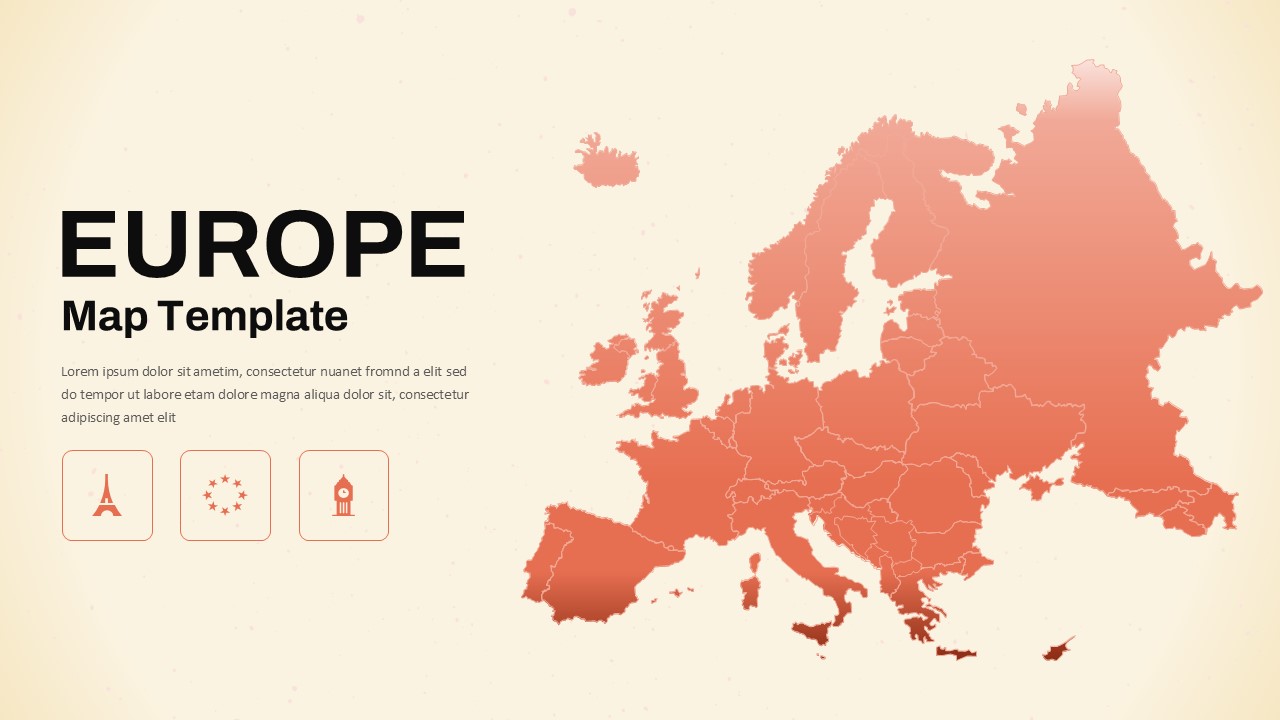
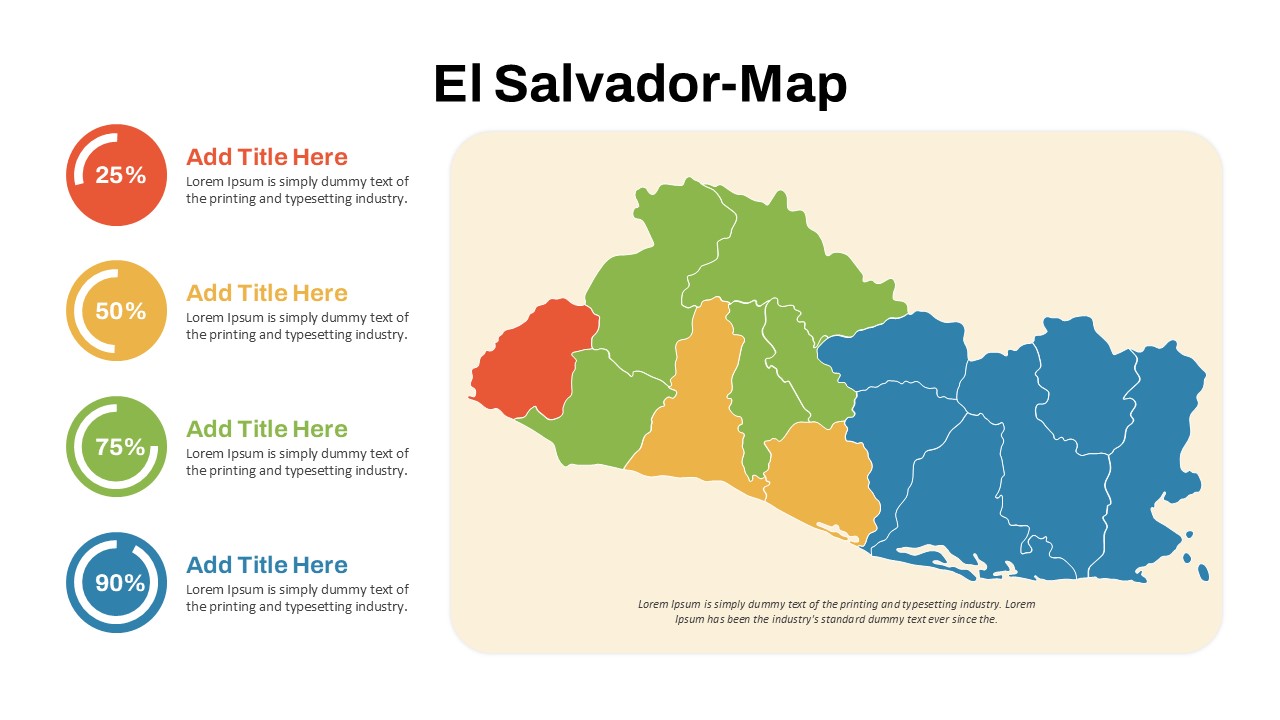
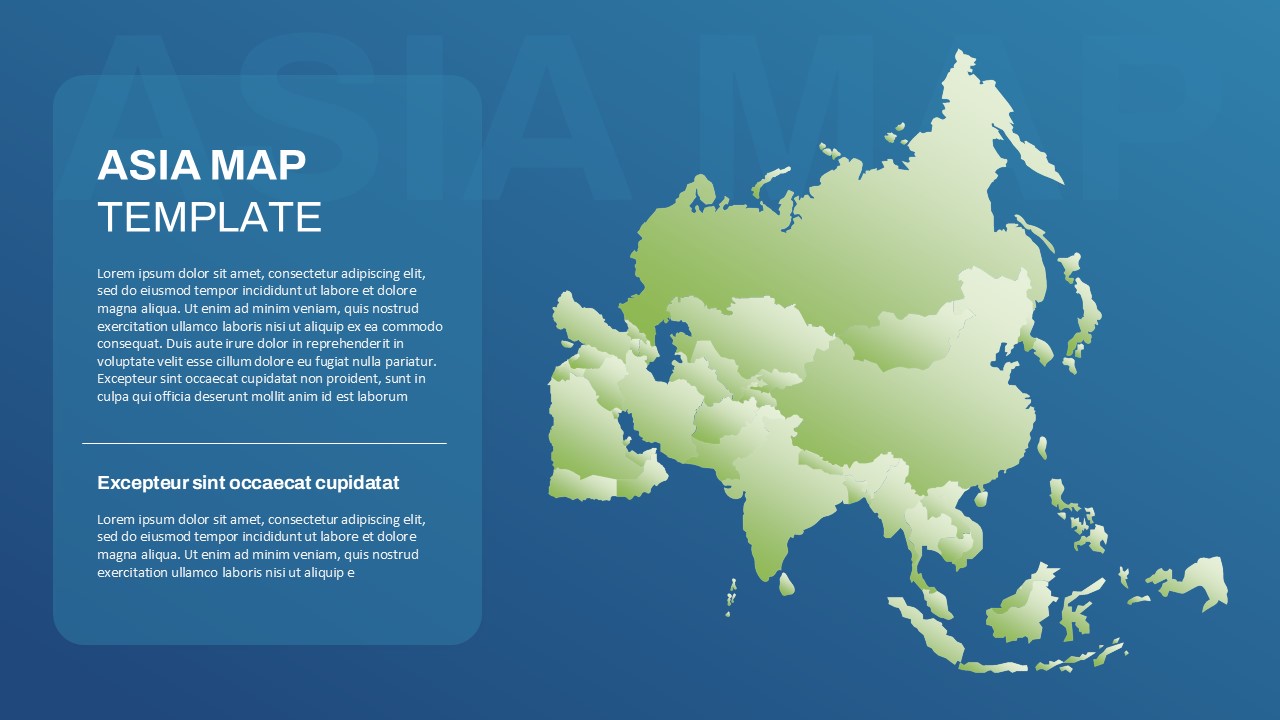
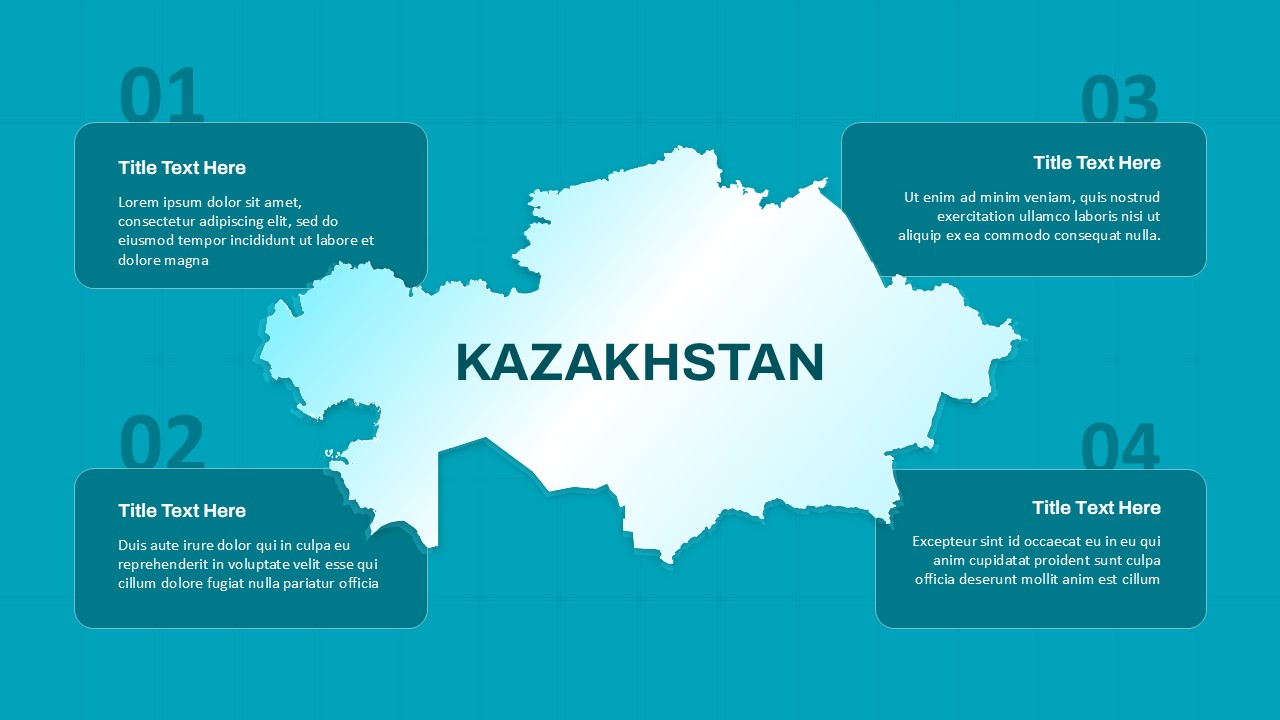
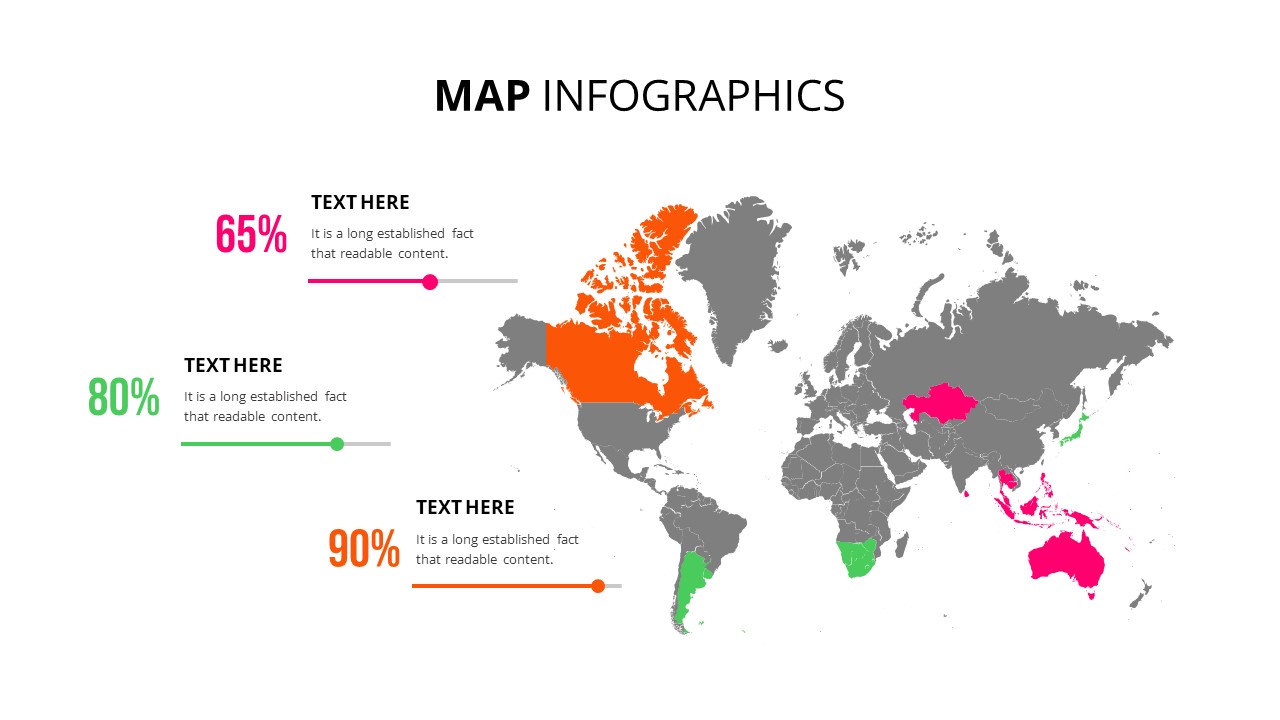
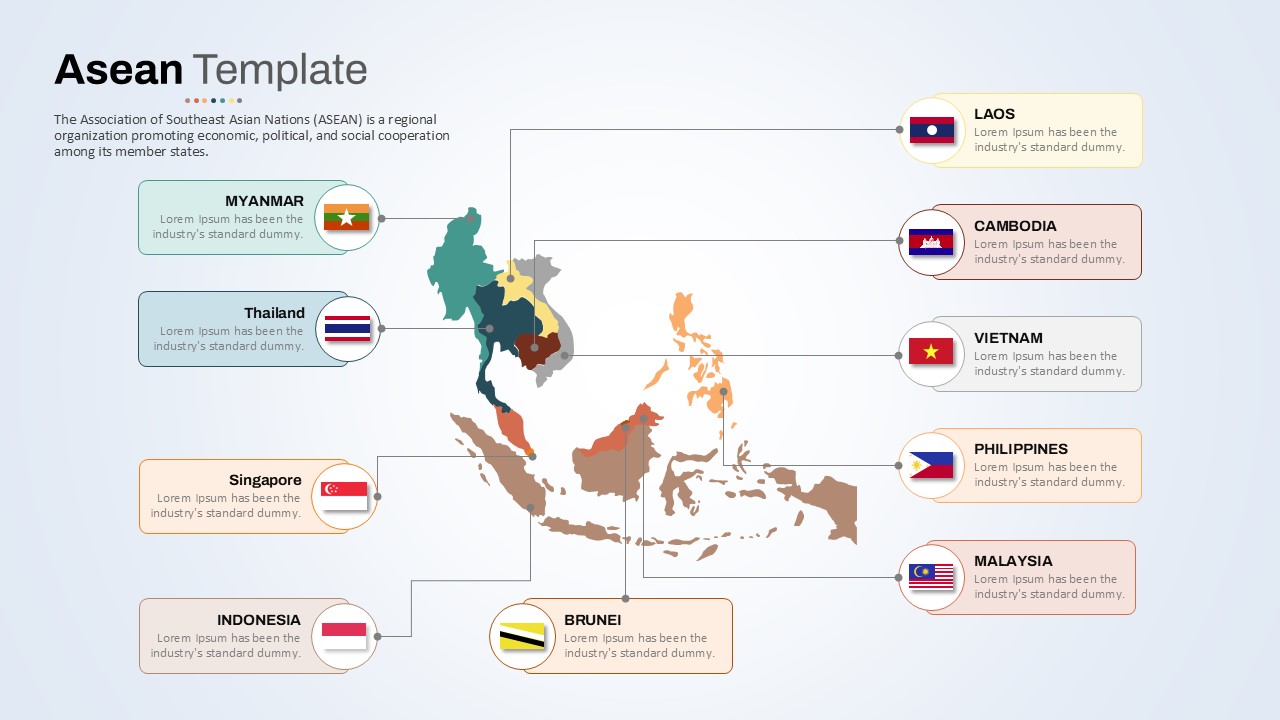
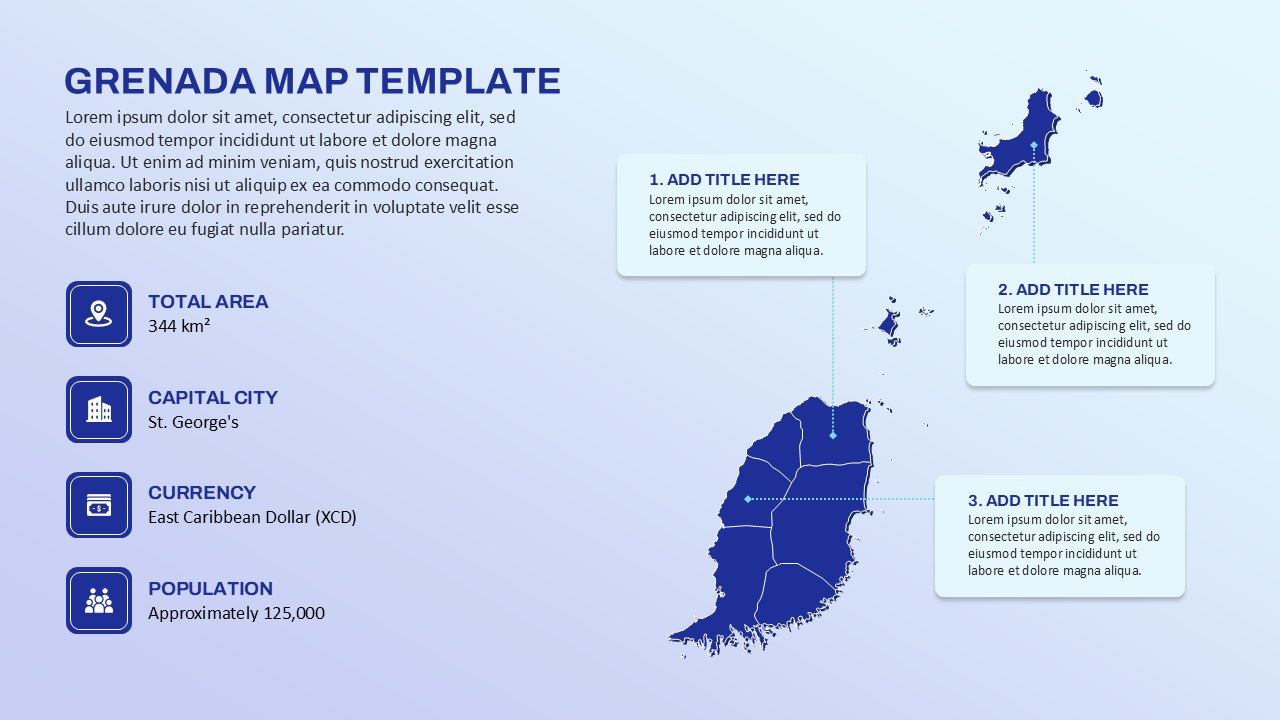
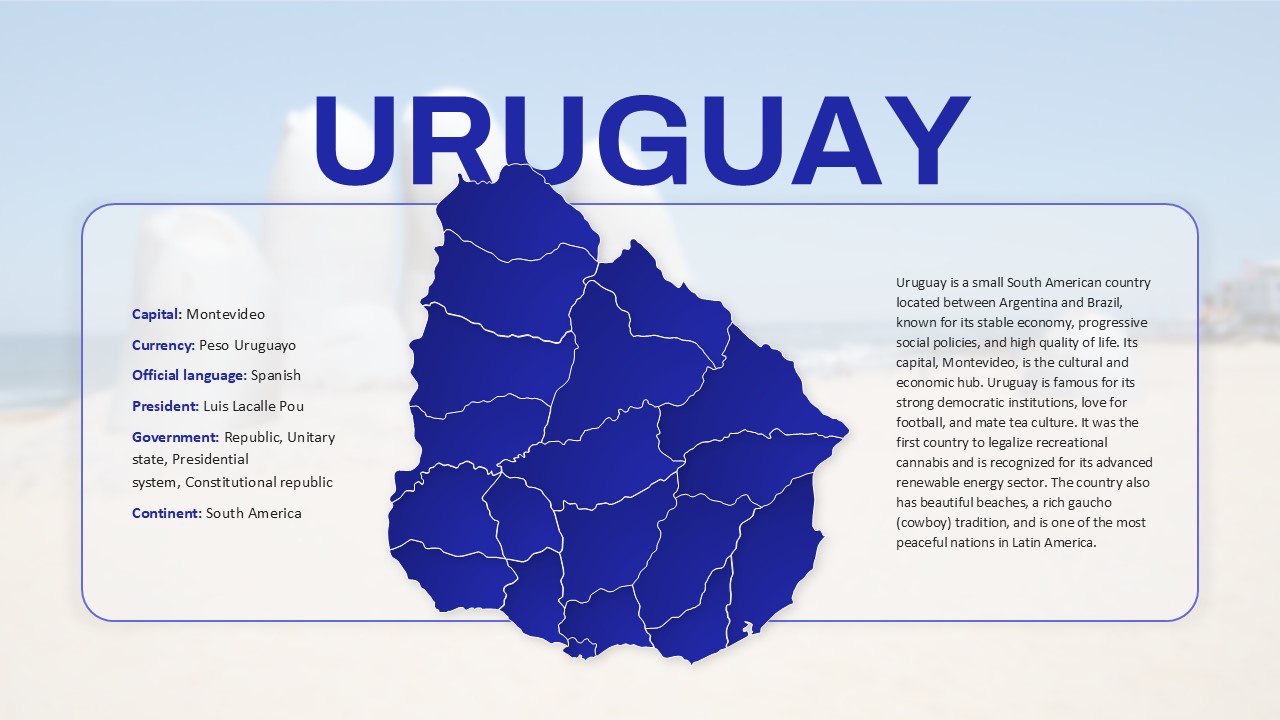
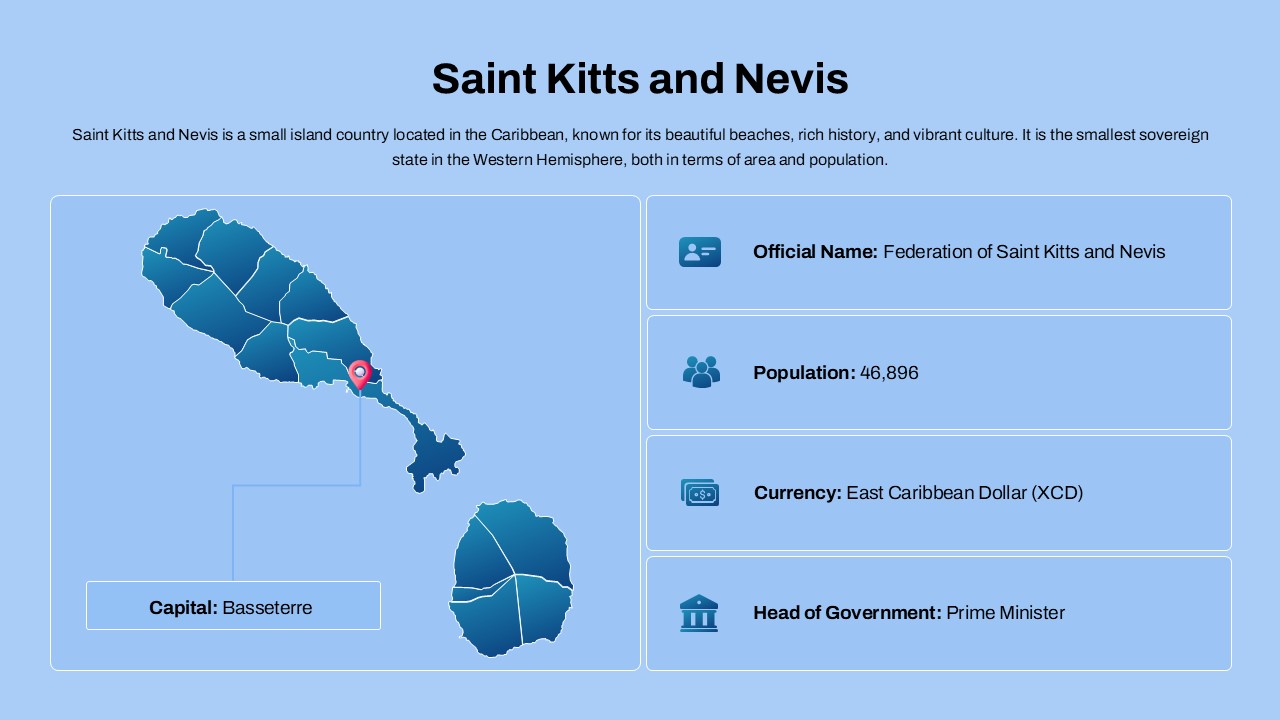
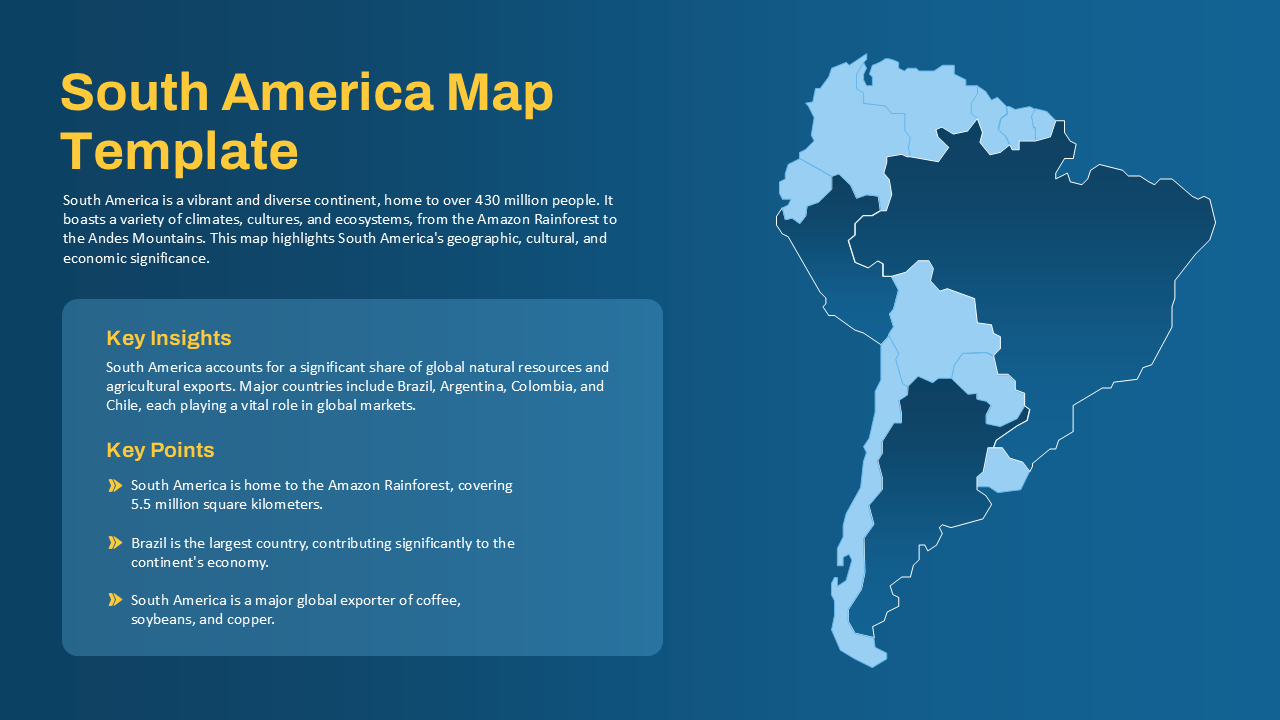
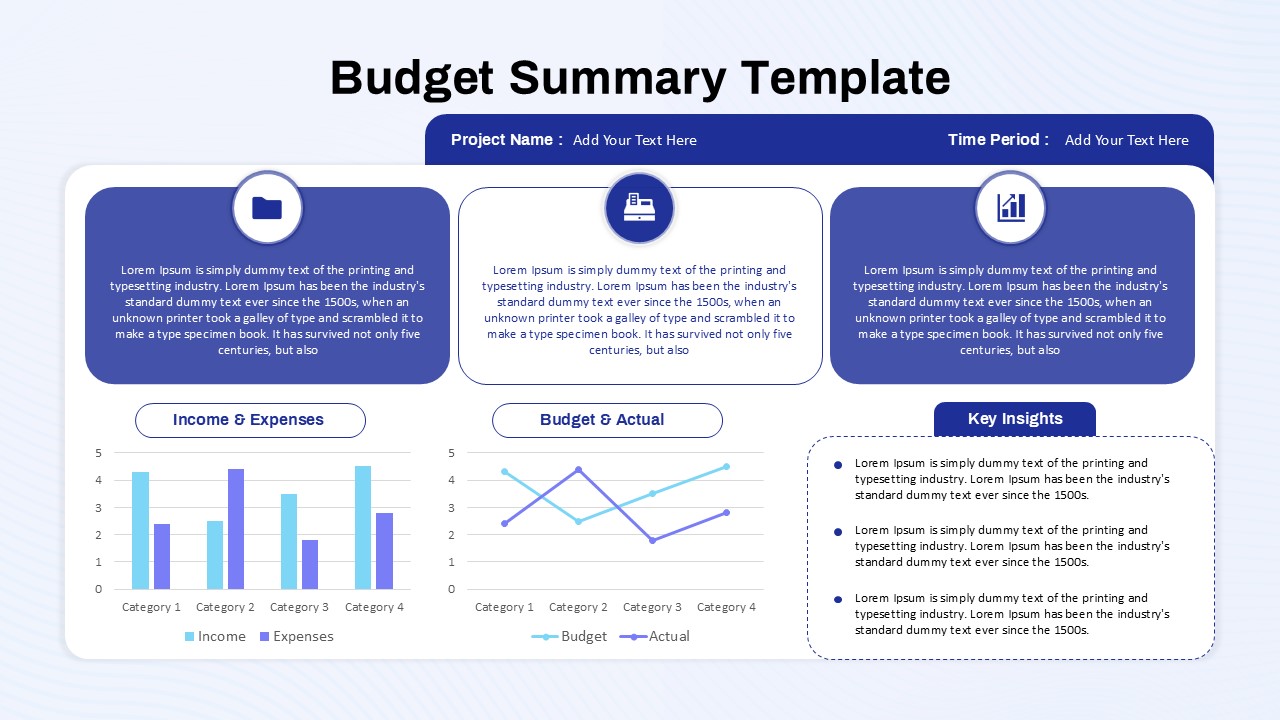
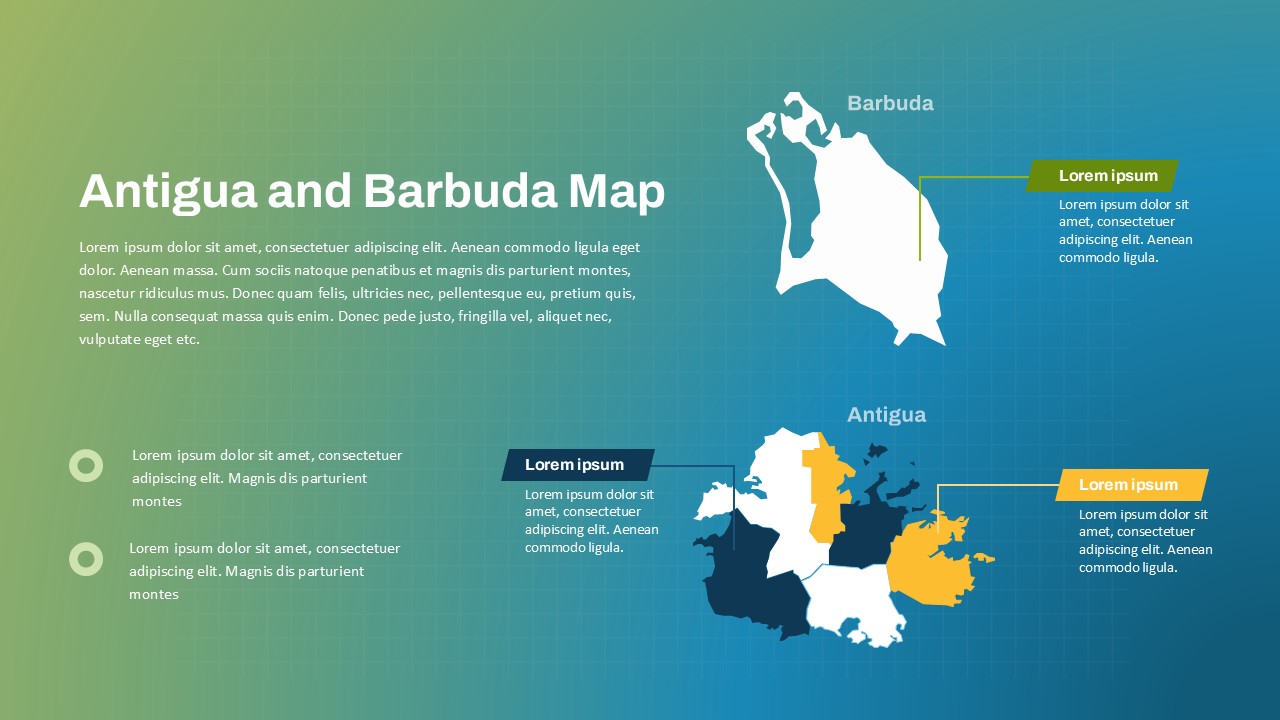
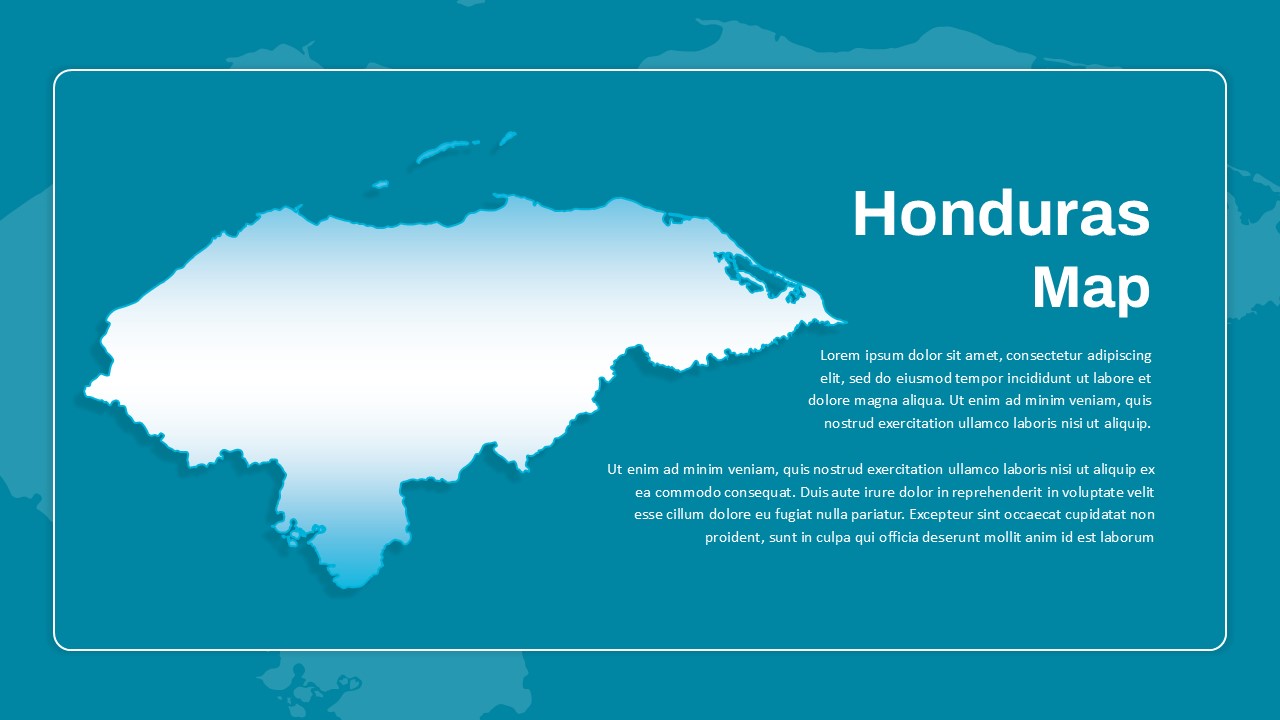
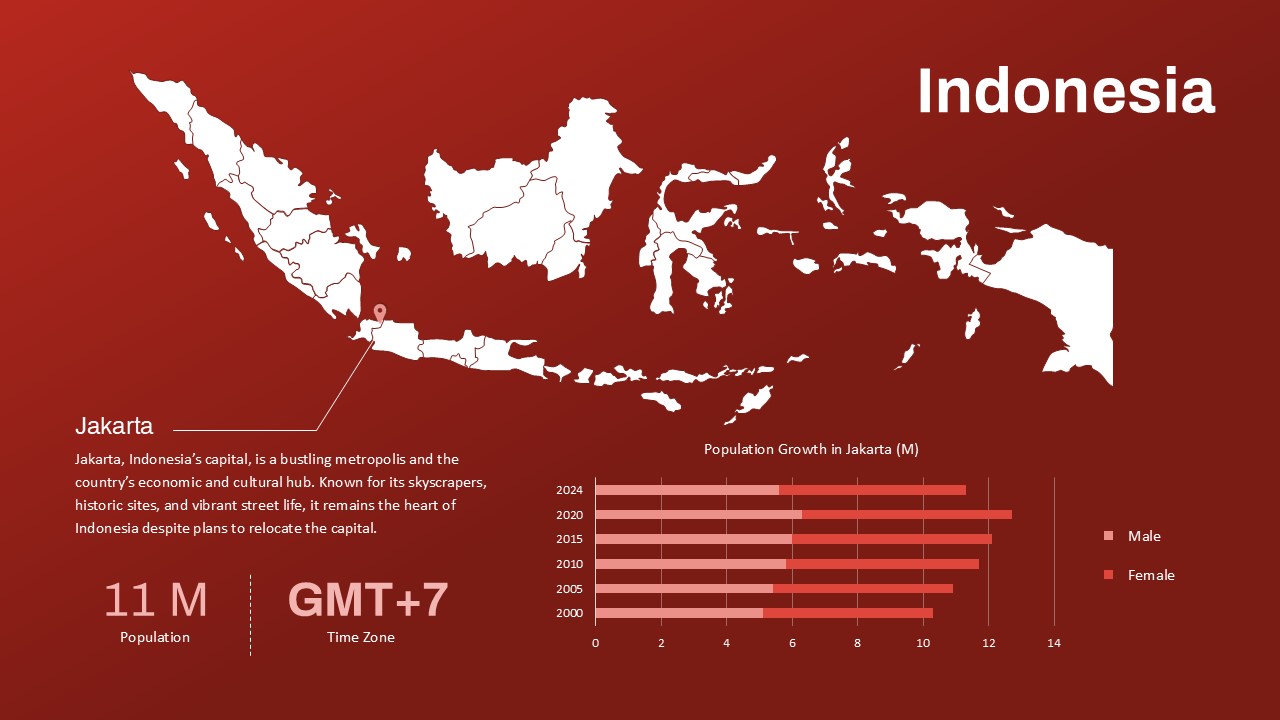
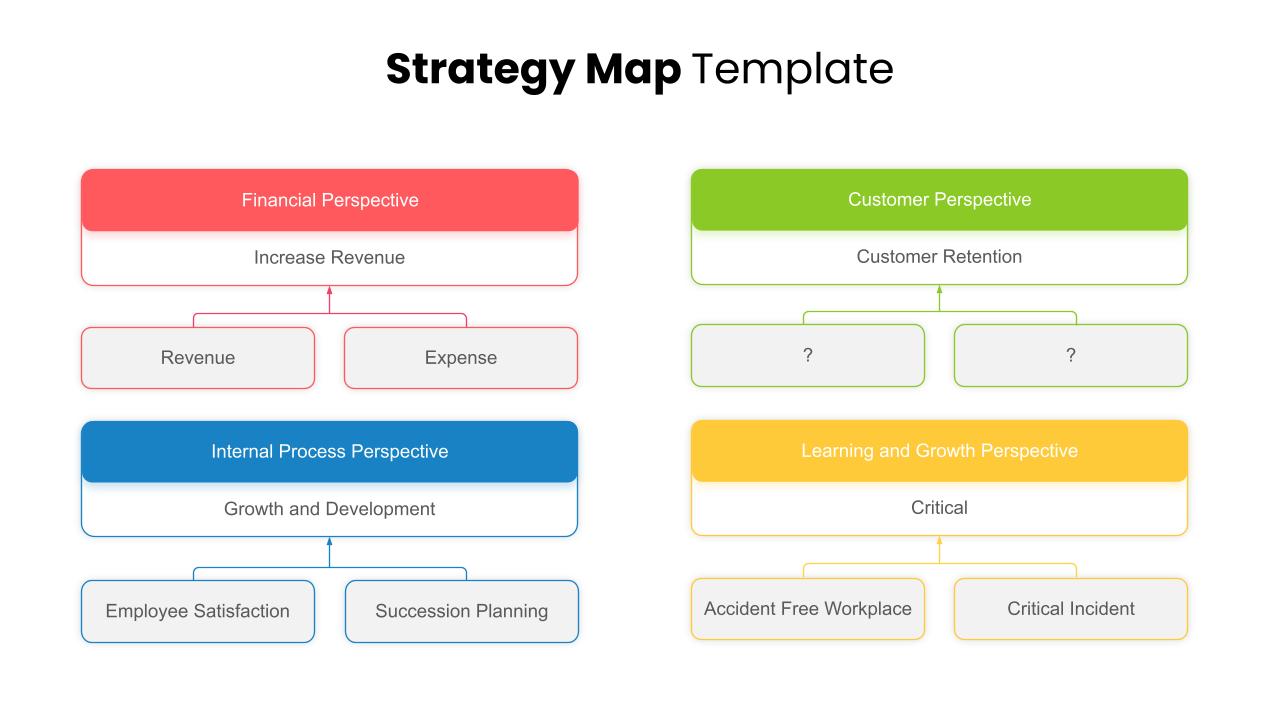
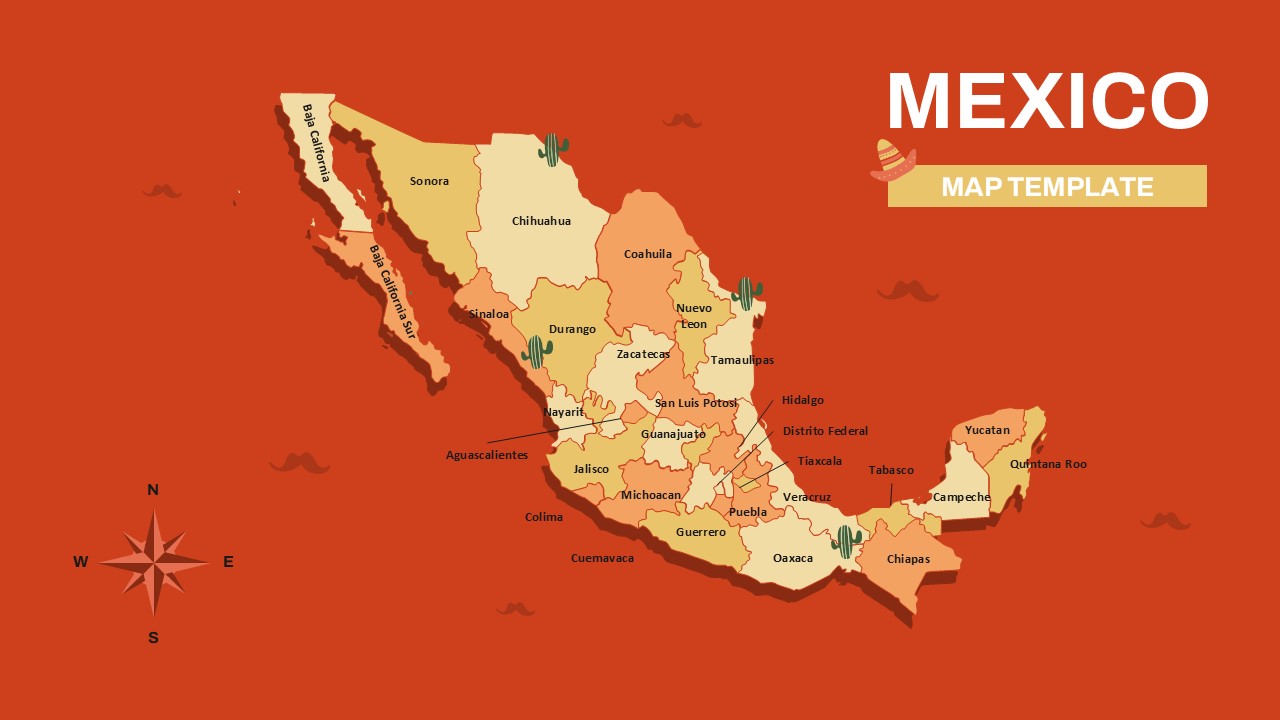
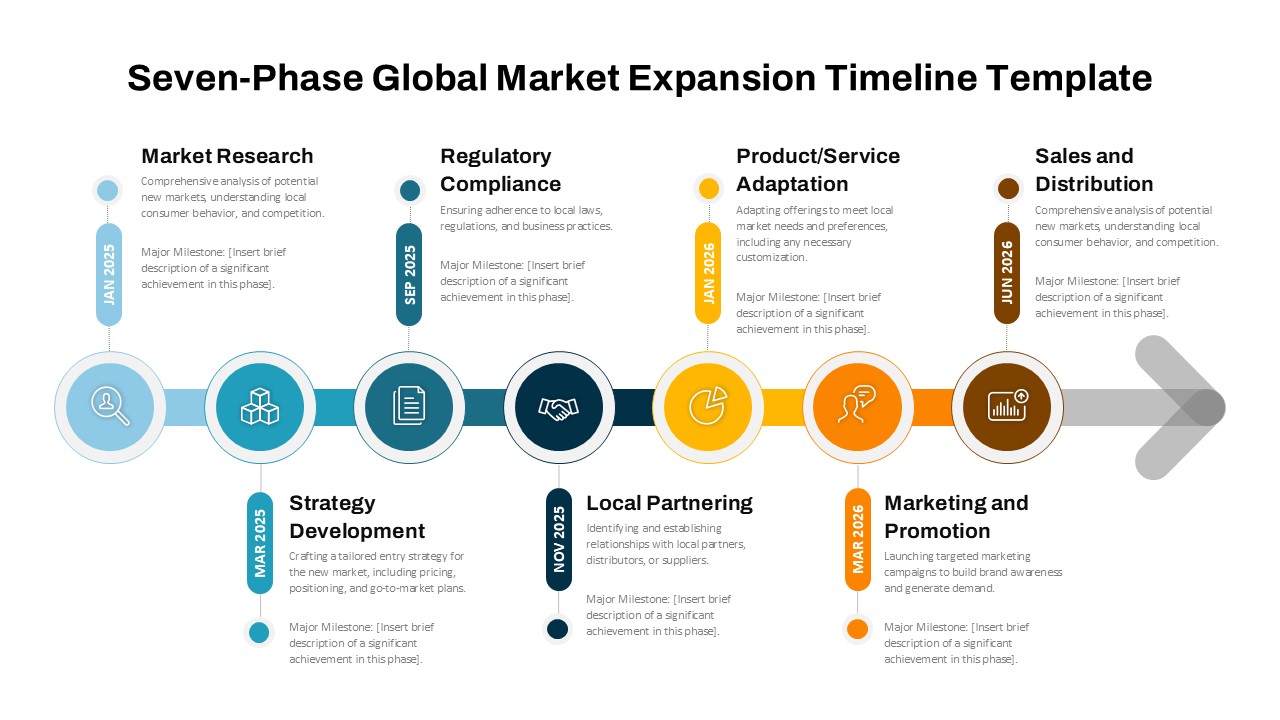
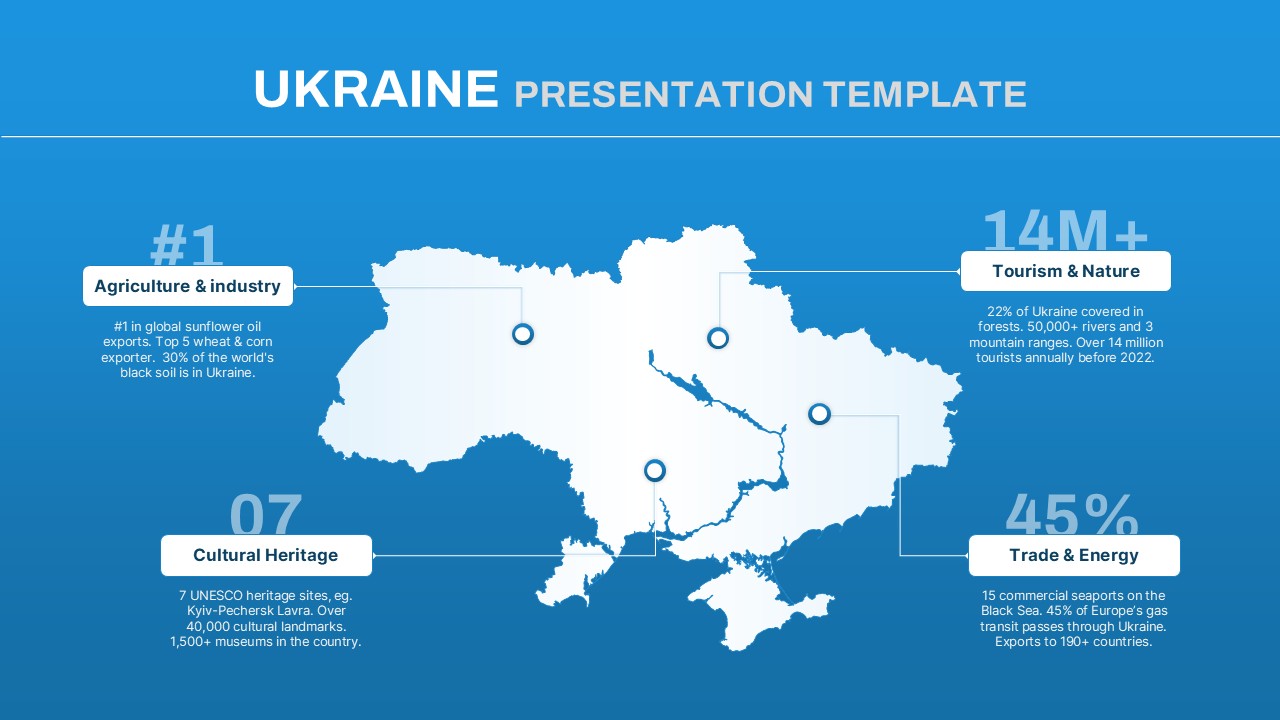
The template showcases Georgia divided into clearly defined administrative regions, each color-coded to reflect varying data points. Annotations are placed to illustrate key metrics, such as average household income, the number of active businesses, and sector-specific growth—ideal for visual storytelling in economic, business, or demographic presentations. The clean layout, enhanced by subtle gradients and callout boxes, allows for an engaging narrative without overwhelming the audience.
This template is particularly useful for presenting regional development plans, business expansion strategies, government policy outcomes, or tourism insights. It supports data-driven storytelling, enabling professionals to replace dummy text and figures with real data to inform and persuade stakeholders. Whether you’re a policymaker, educator, consultant, or market analyst, this map infographic empowers you to communicate geographically relevant content with clarity and impact.
Fully editable and scalable, the template allows for quick modifications in both color and content, making it suitable for print or digital presentations.
See more

Aspect Ratio
16:9Item ID
SKT03444
Features of this template
Other User Cases of the Template
Business expansion analysis, regional economic reports, tourism sector presentations, academic research, government policy briefings, sales territory planning, market entry strategies, demographic studies, investor pitches, NGO impact mapping
FAQs
You May Also Like These Presentation Templates


- Free

- Free

- Free


- Free

- Free
- Free
- Free
- Free
- Free
- Free