Graphical Dashboard Templates For Powerpoint
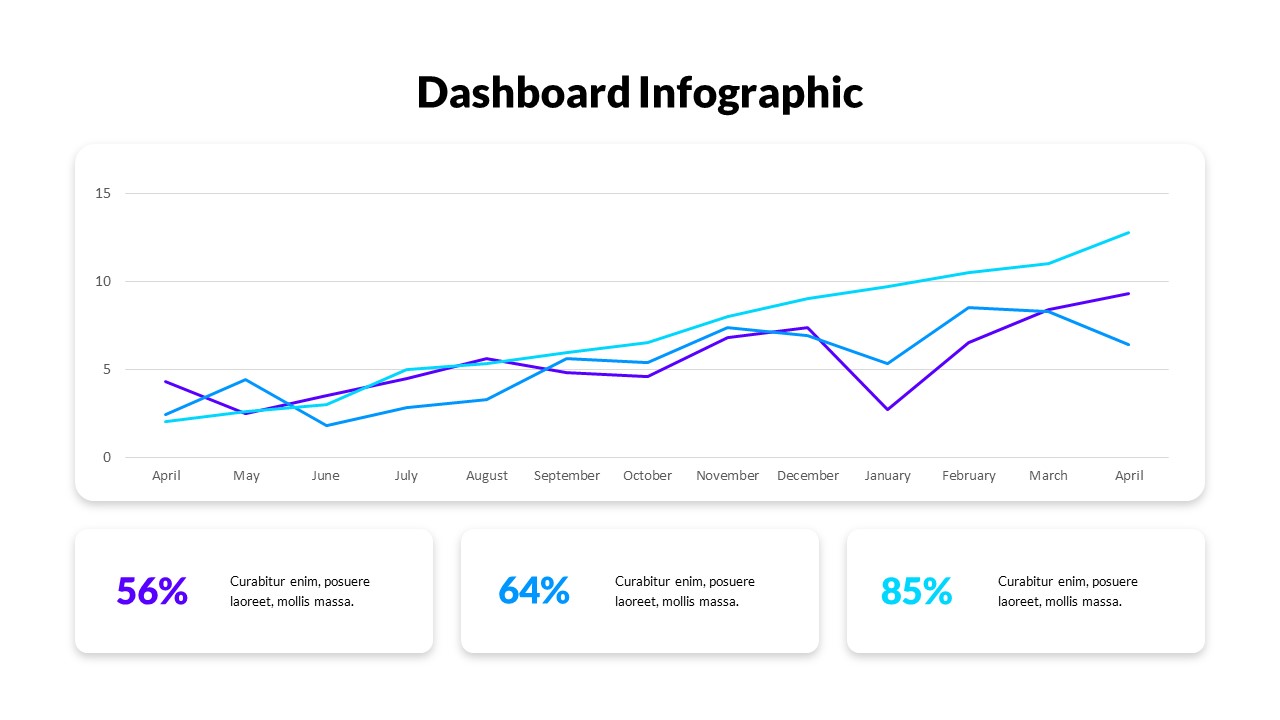
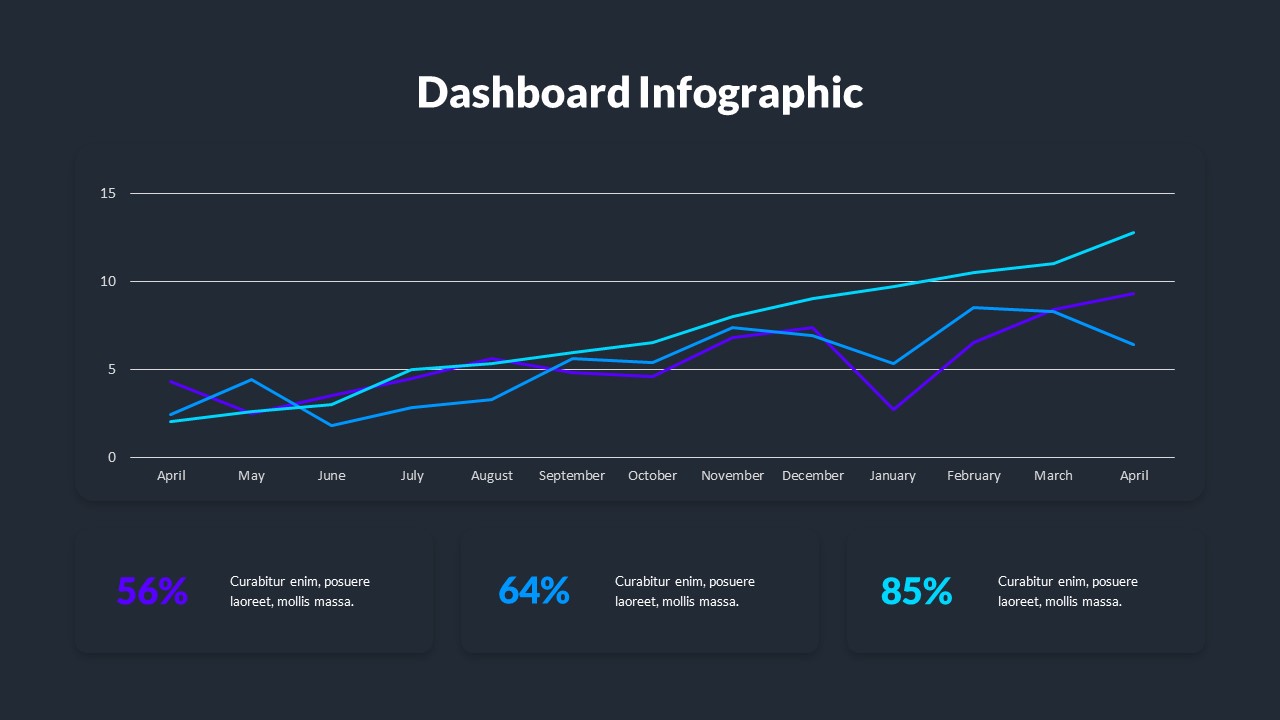
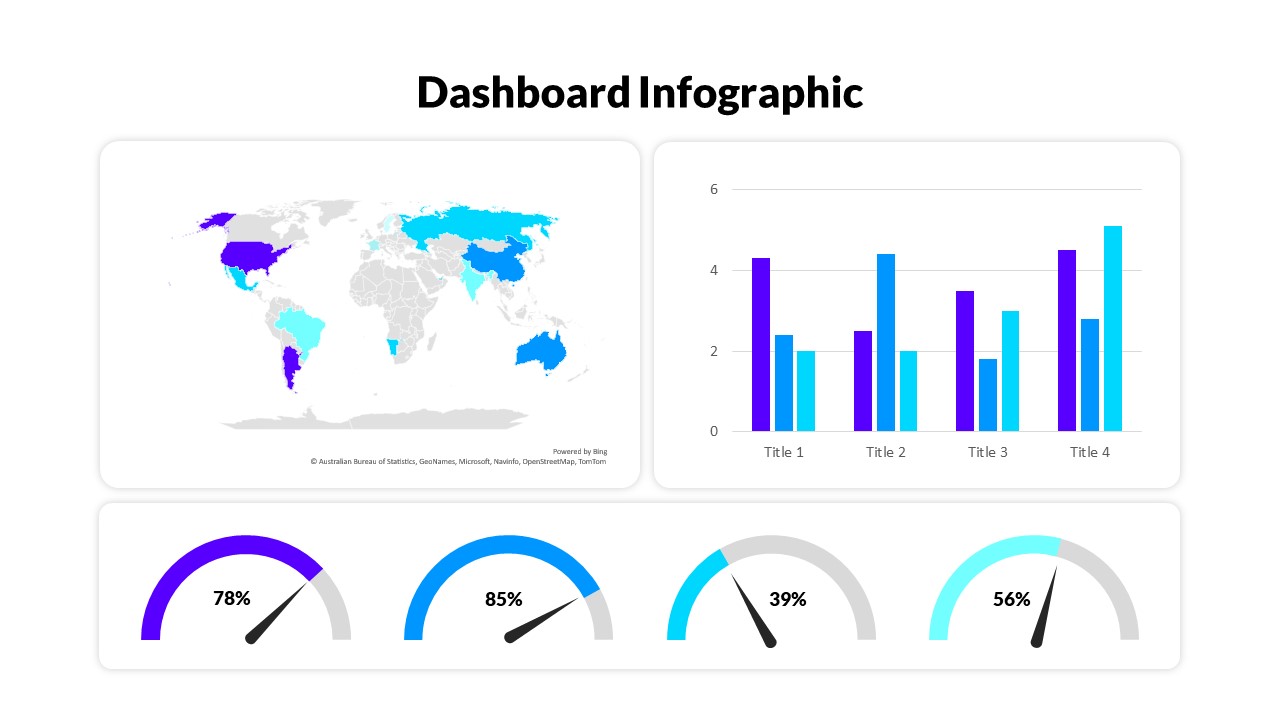
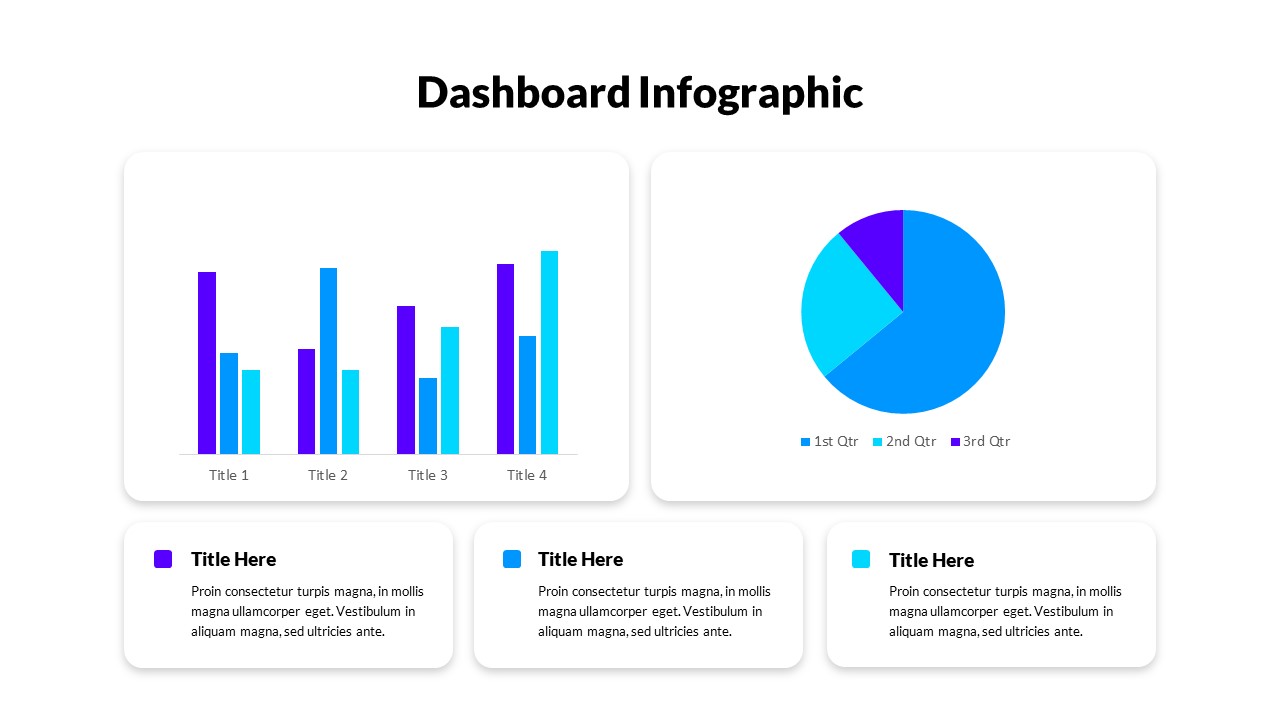
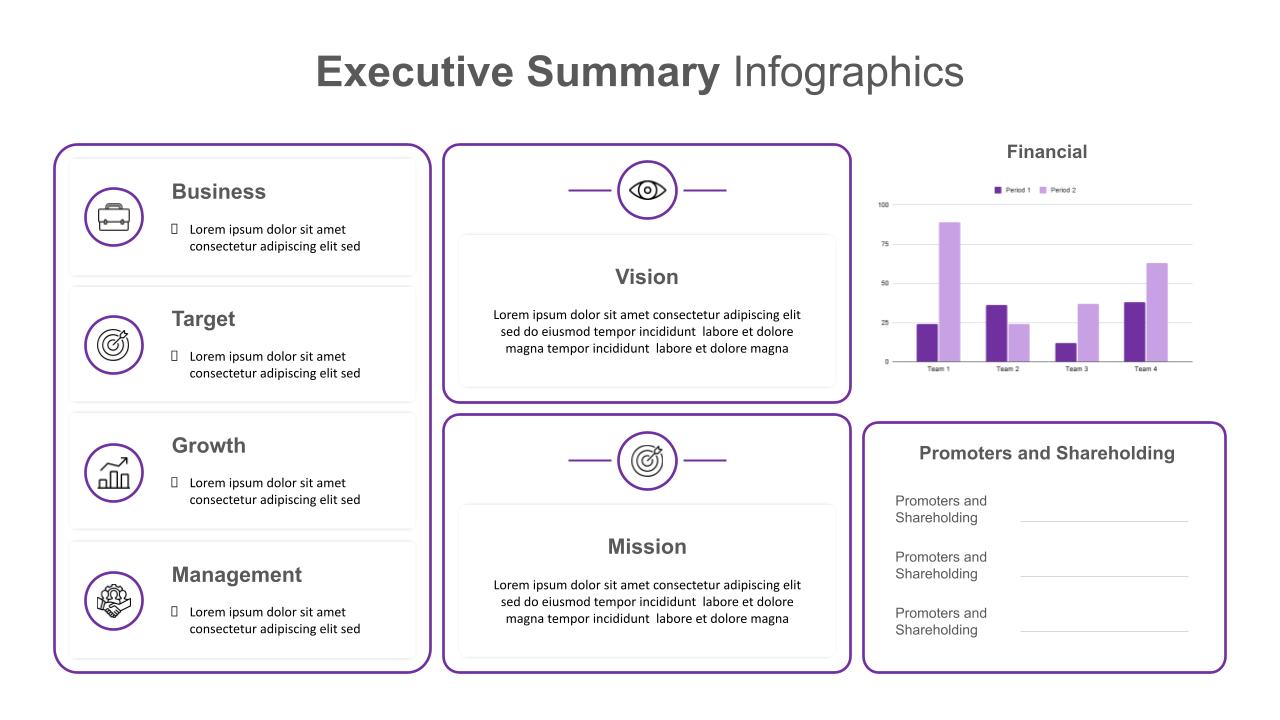
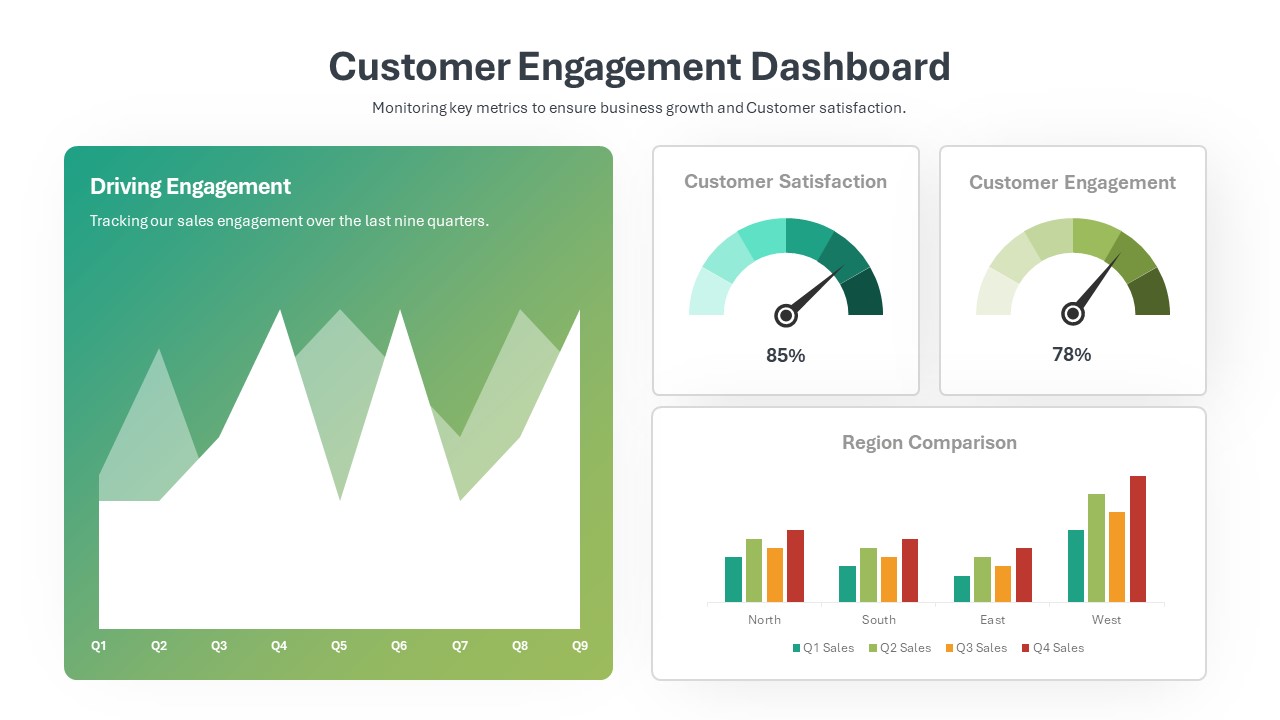
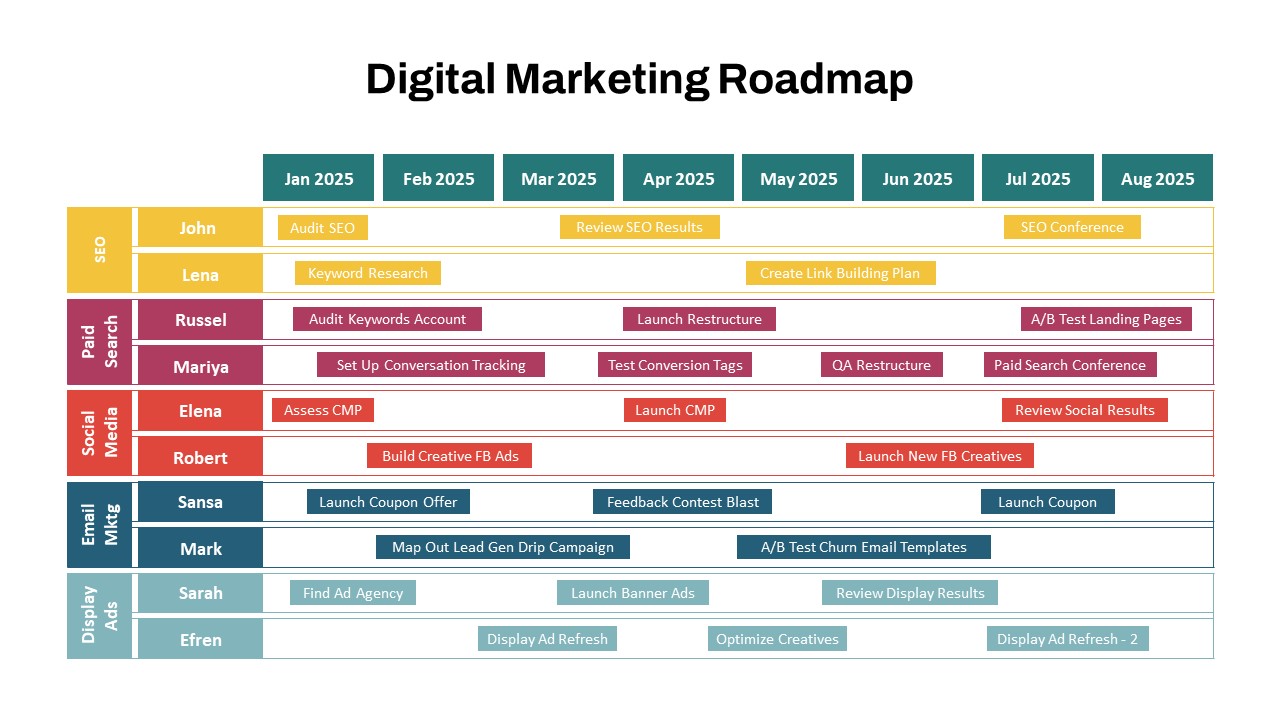
The dashboard infographic presentation lets you show numerical data in a line graph. This statistical powerpoint data-driven chart combines three graphs to display financial, sales, and marketing up and downs or the future estimations of company growth. You can impart color fills in the graph to distinguish three data sets. Besides, the details can be highlighted in the three sections below.
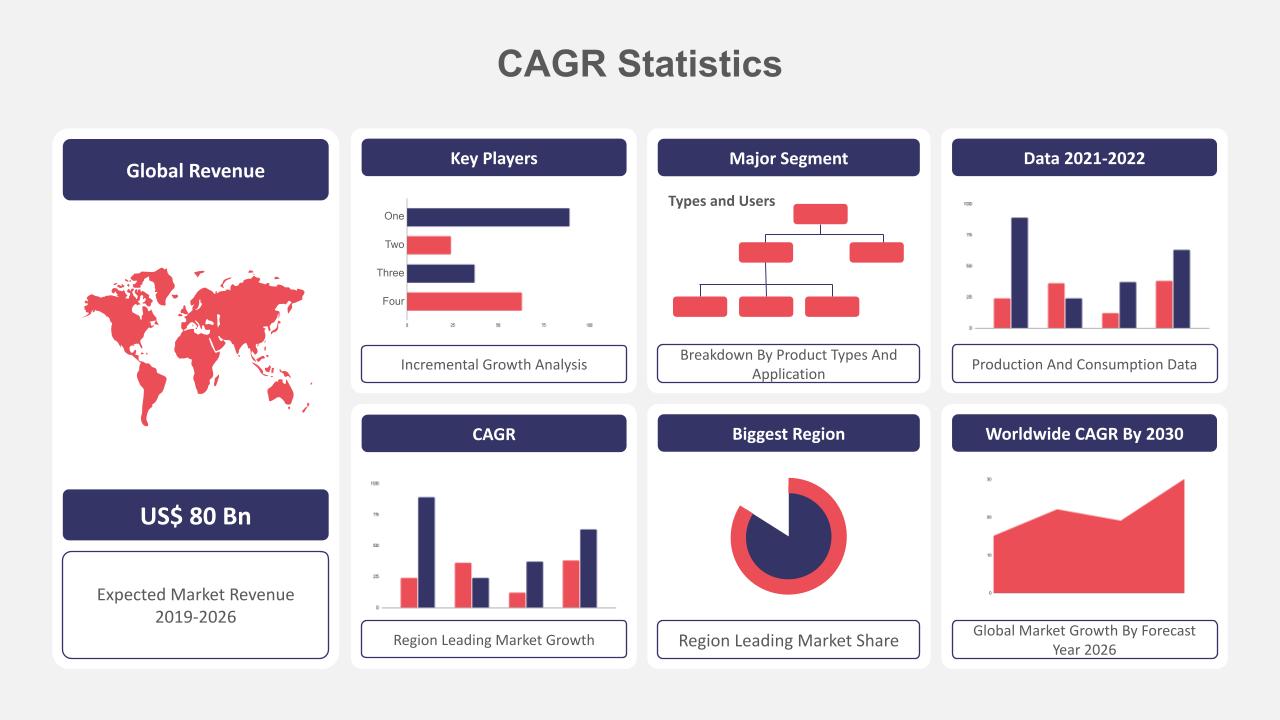
The dashboard template is ideal for research, business, and academic purposes. In addition, the multi-purpose chart is a positive supplement to your presentation and will surely gain maximum audience attention. Download these charts, graphs, and all-in-one infographic dashboards now!
See more

Aspect Ratio
16:9Item ID
SKT00244
FAQs
You May Also Like These Presentation Templates


- Free
- Free
- Free


- Free
- Free

- Free
- Free
- Free
- Free
- Free