Hungary Map PowerPoint and Google Slides Template
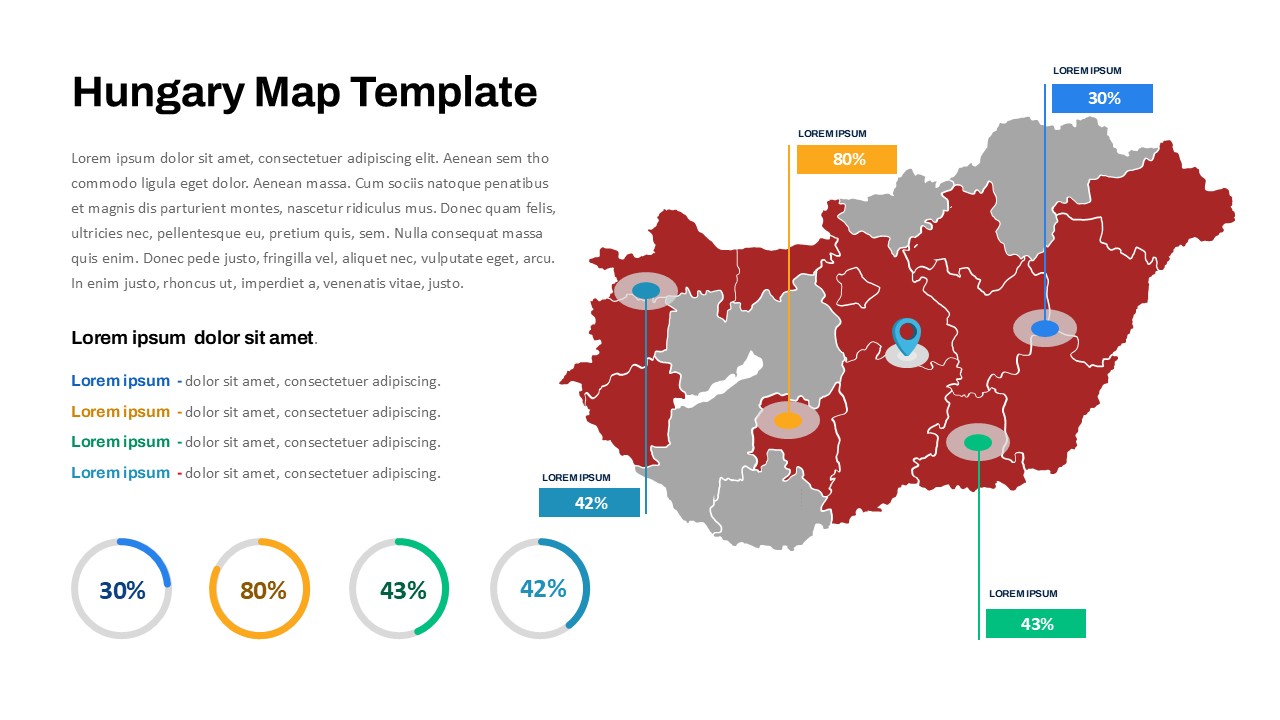
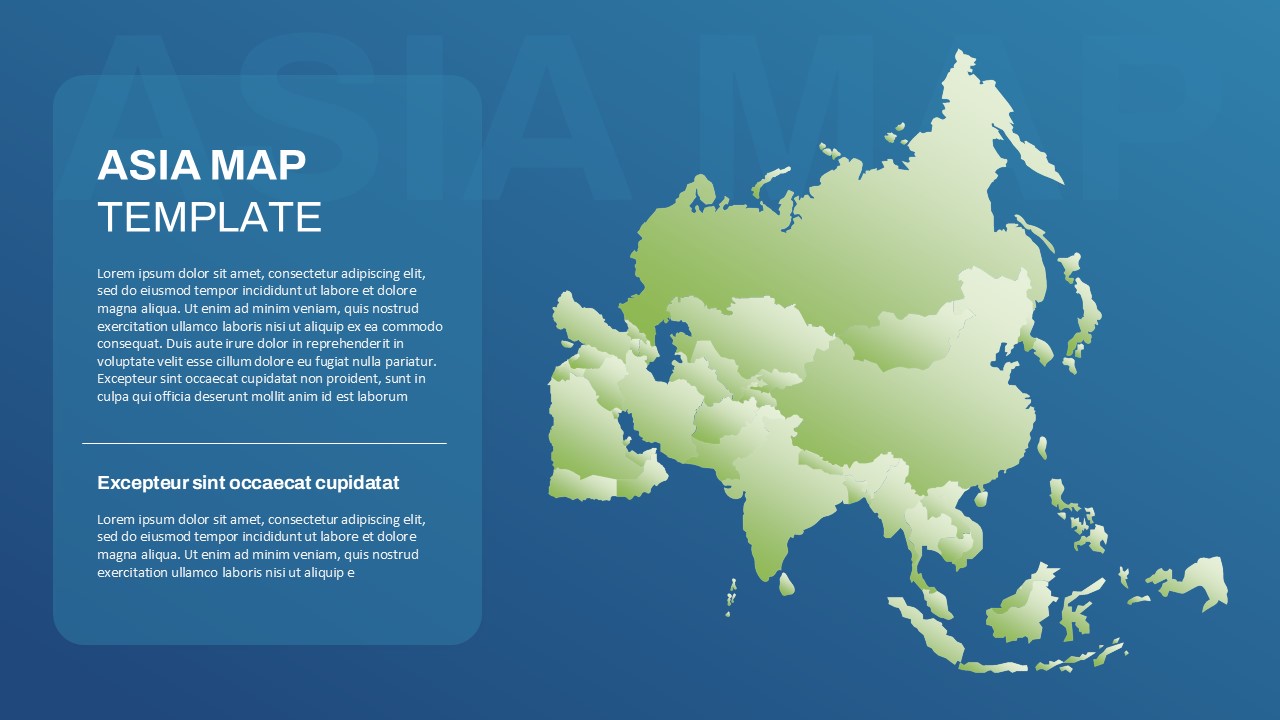
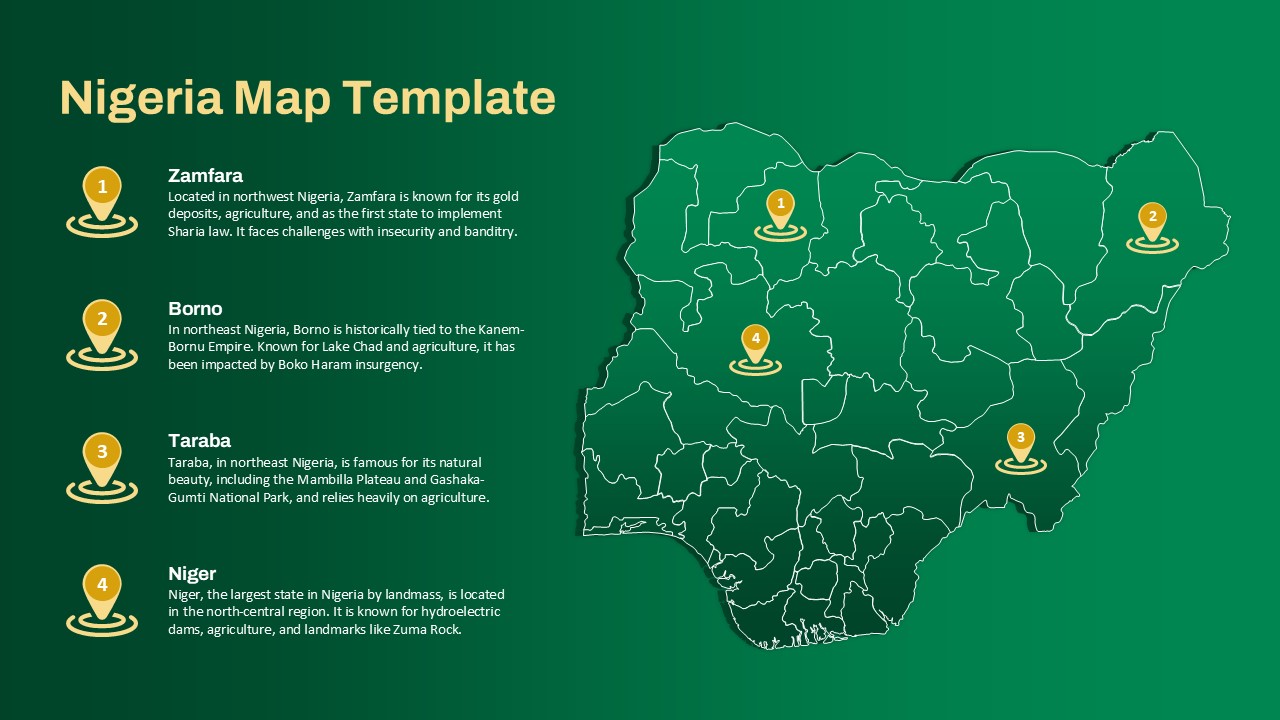
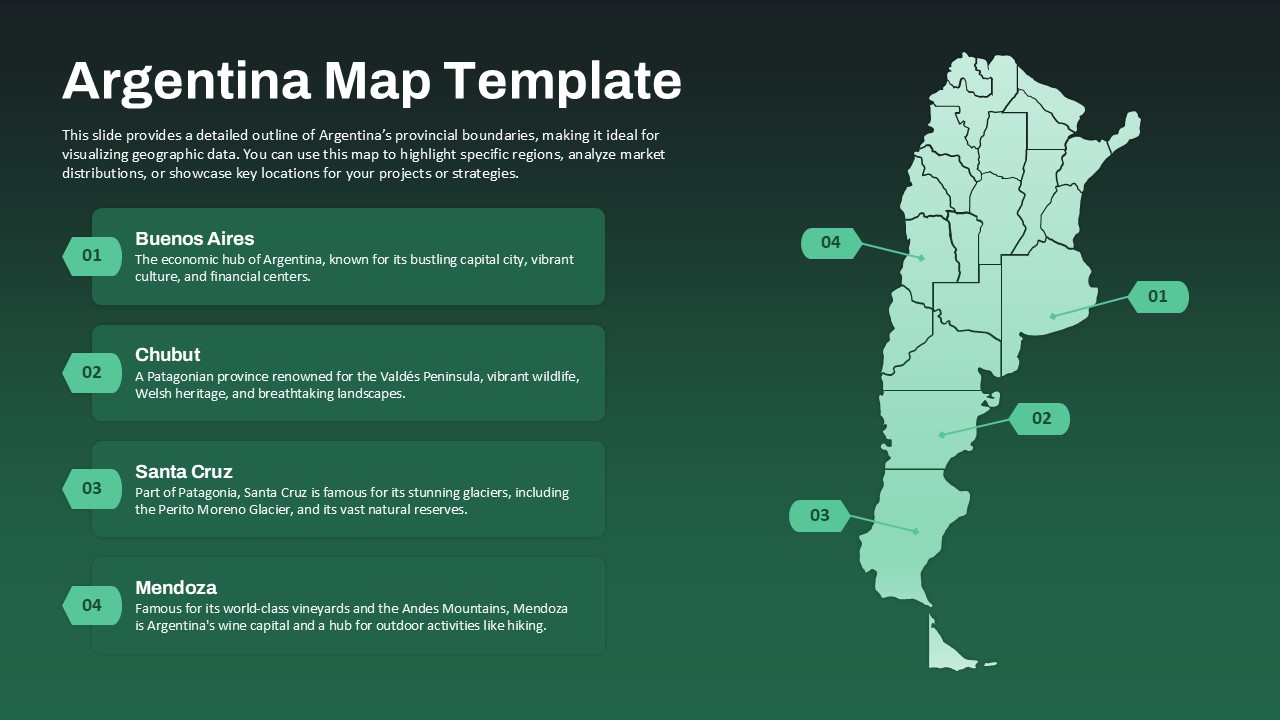
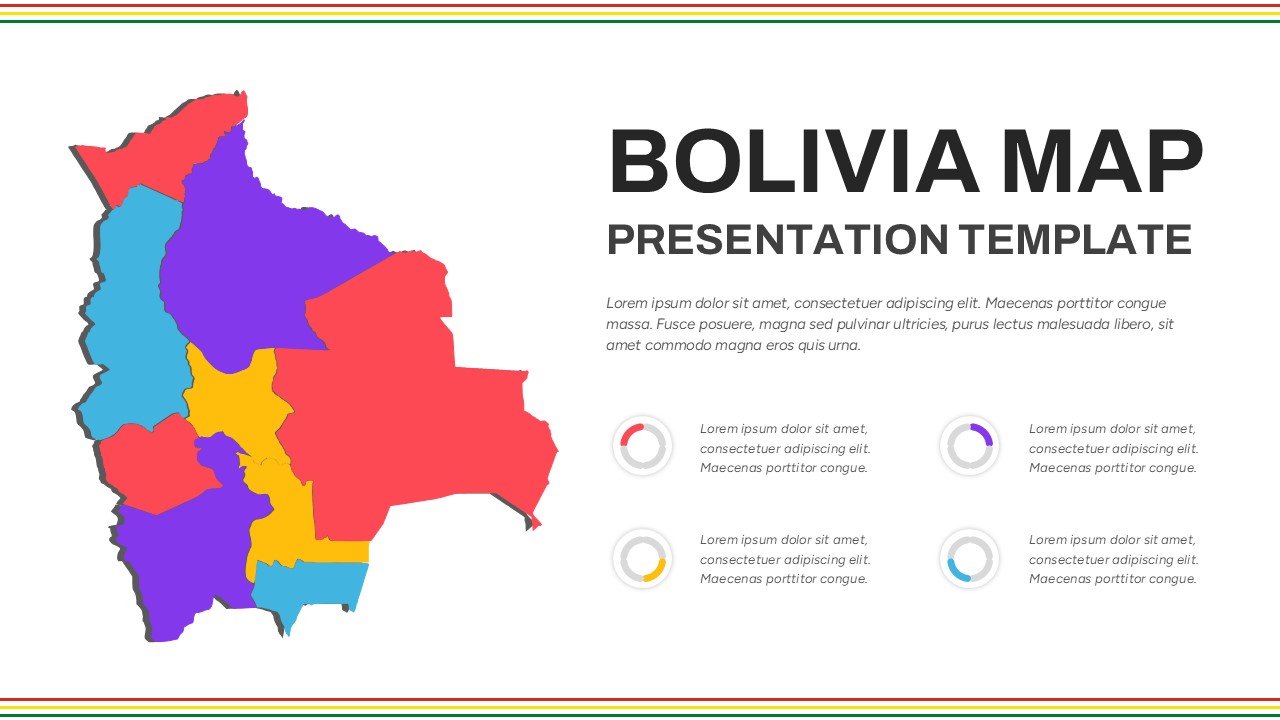
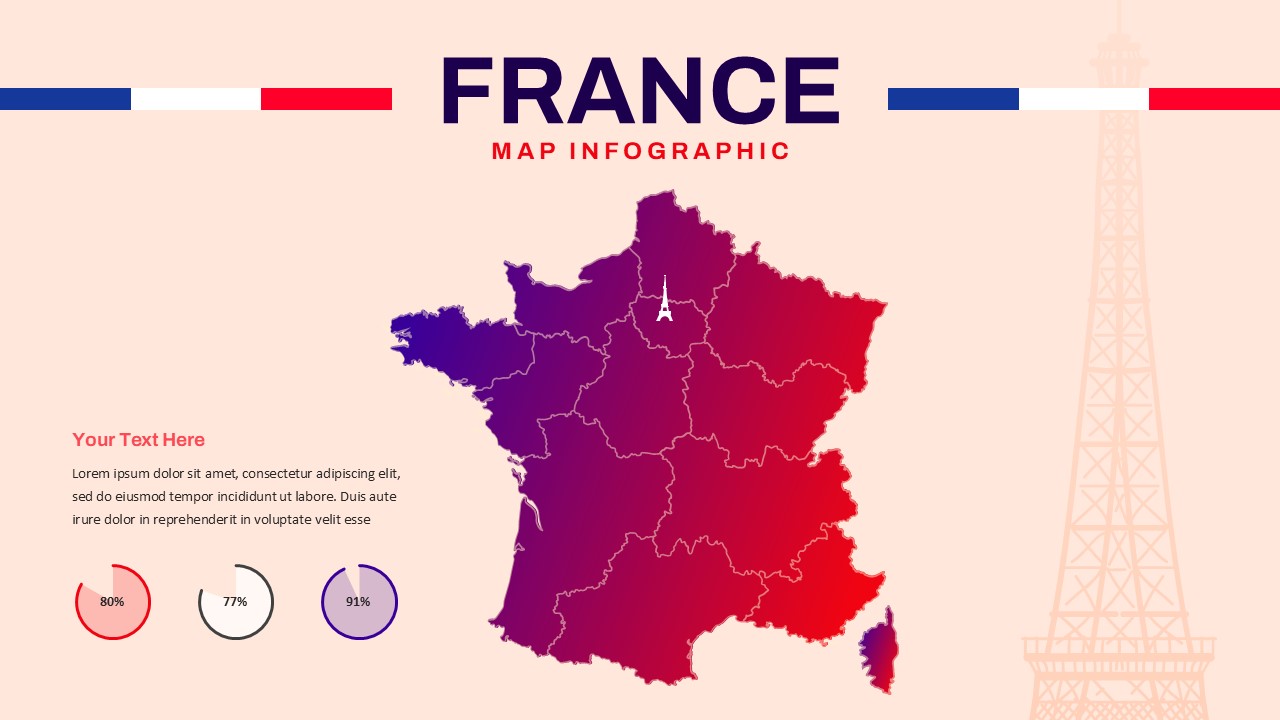
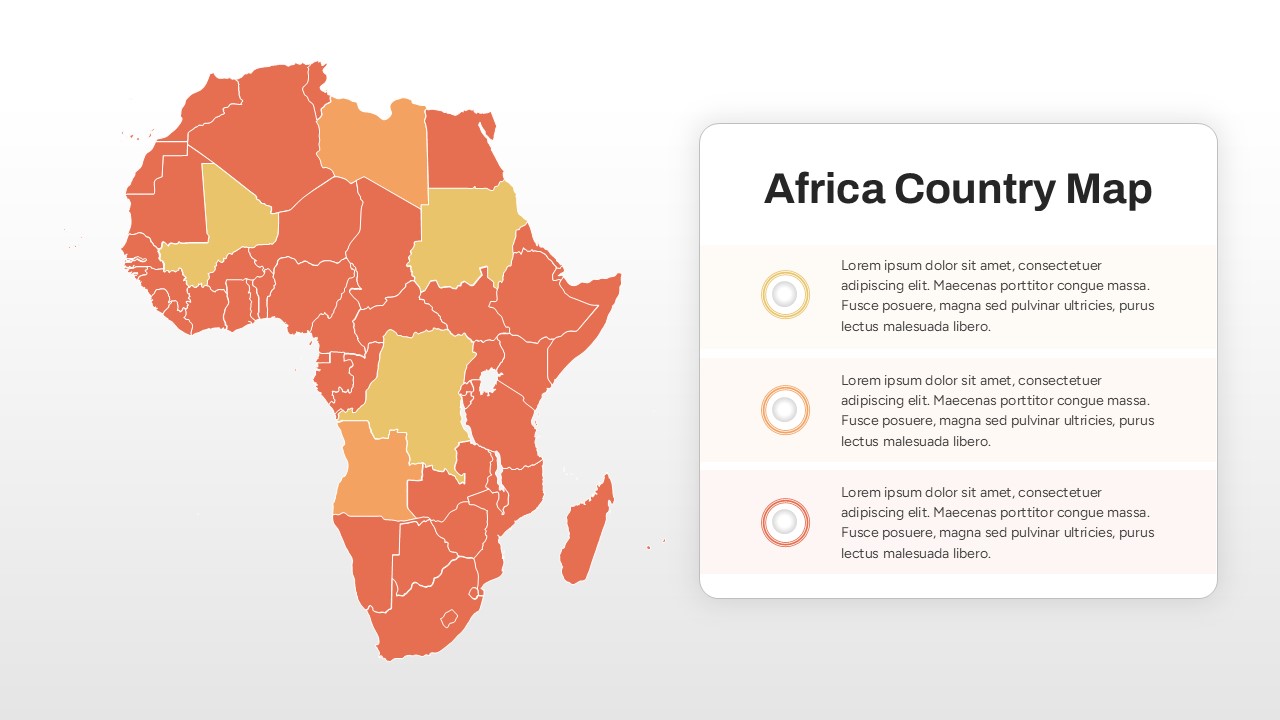
The Hungary map on PowerPoint template is a professionally designed slide that provides a detailed and visually appealing representation of Hungary’s geographical regions. This template is ideal for presentations related to business expansion, market research, demographic analysis, tourism, and statistical data visualization in Hungary.
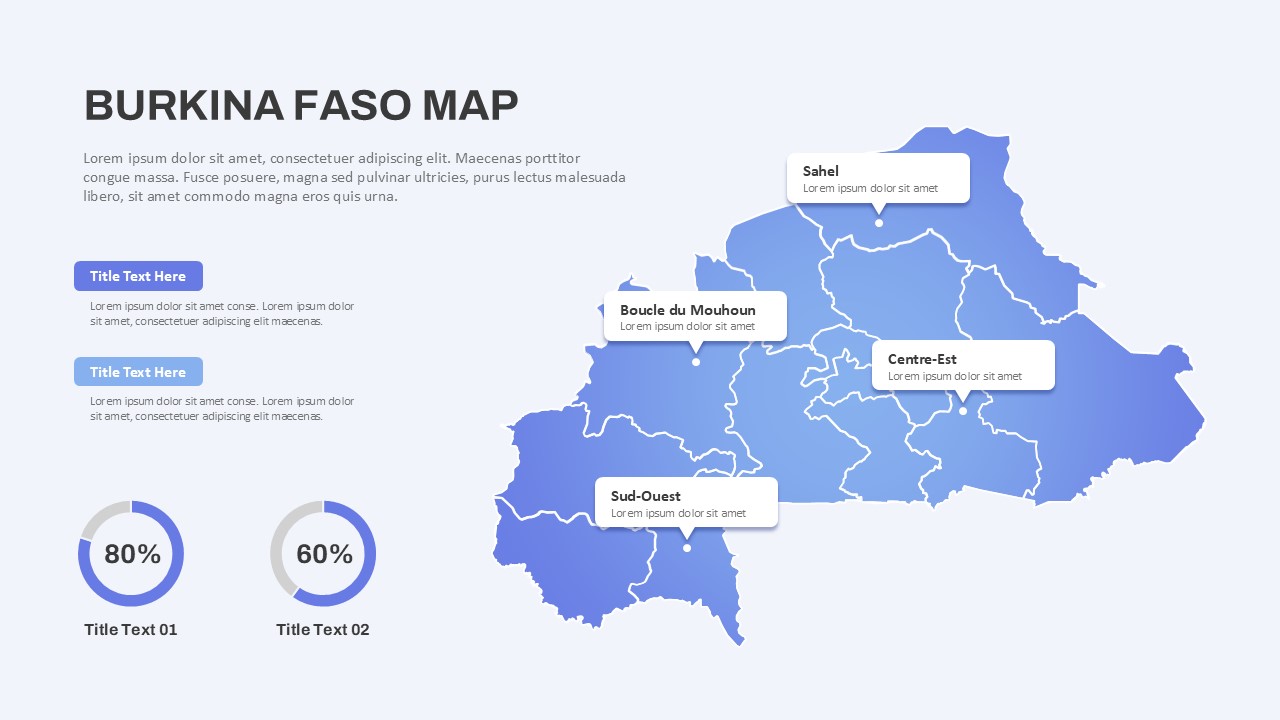
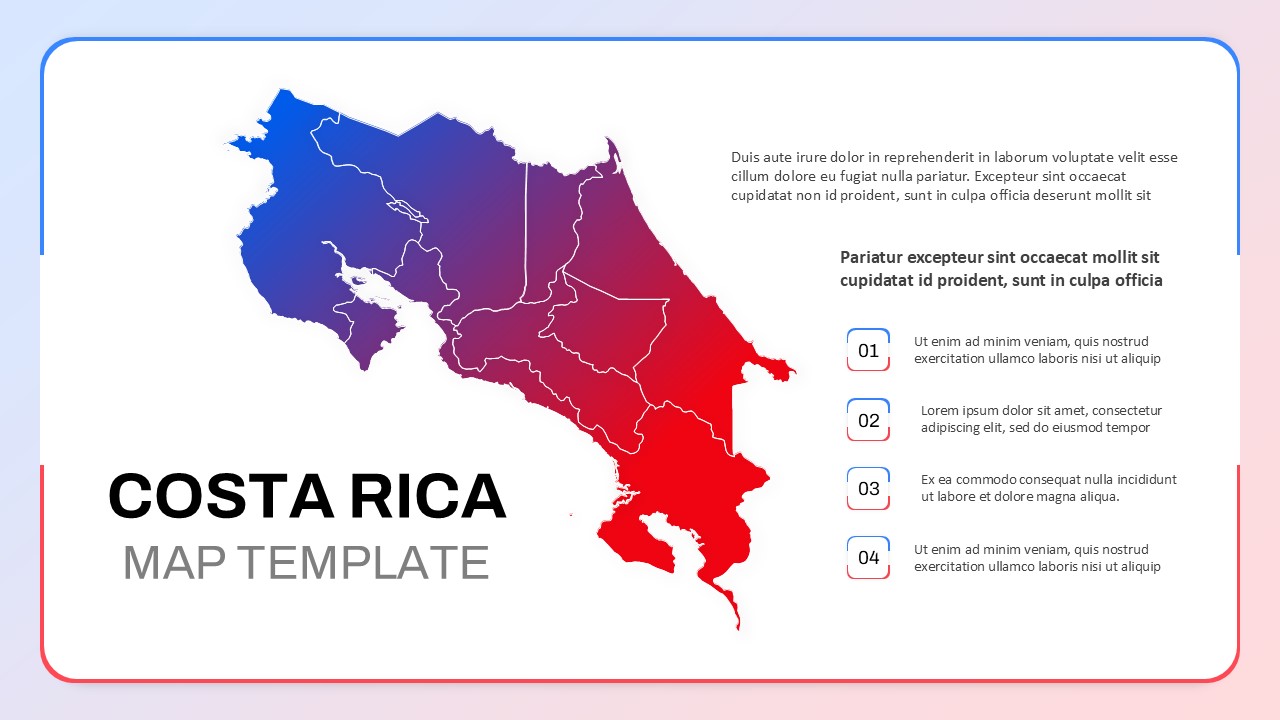
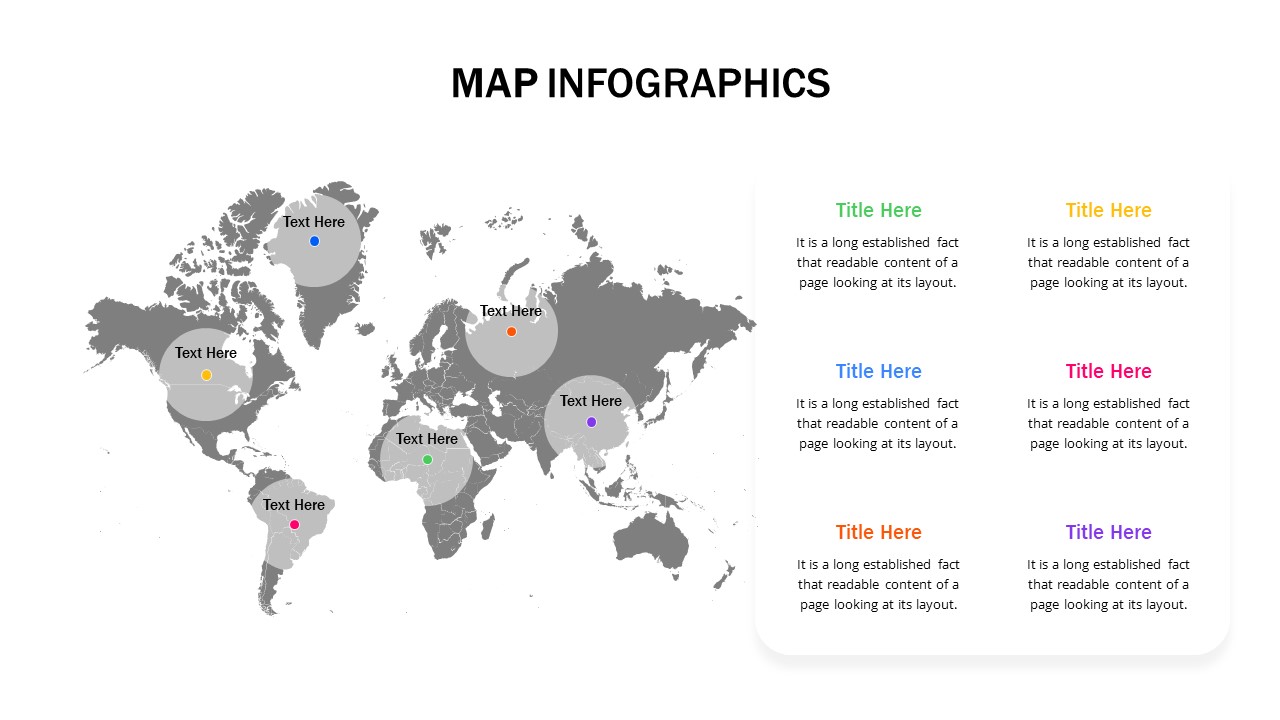
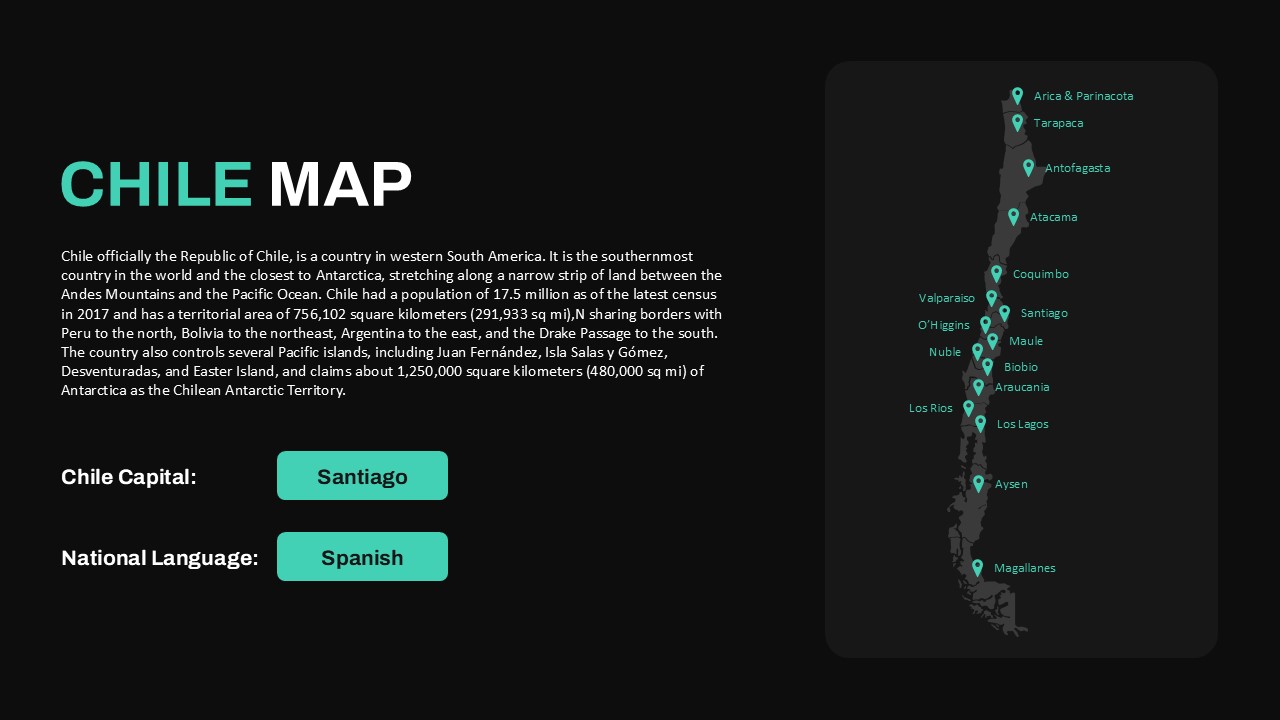
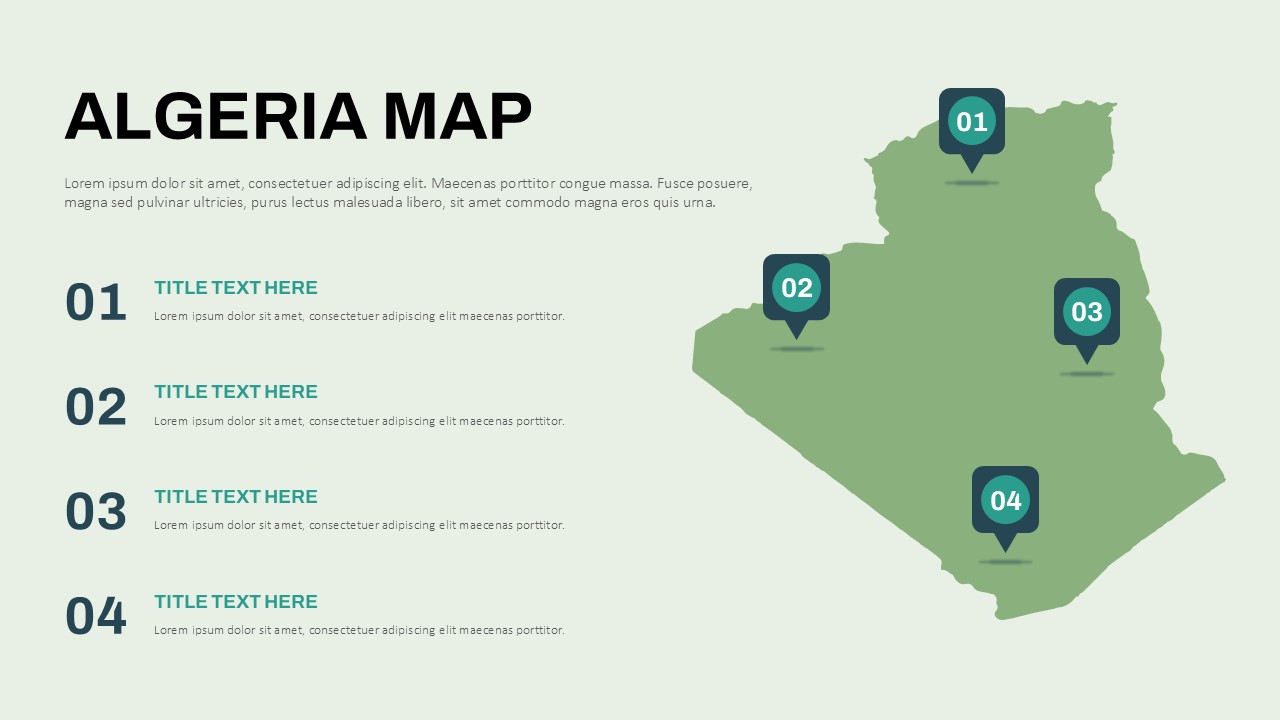
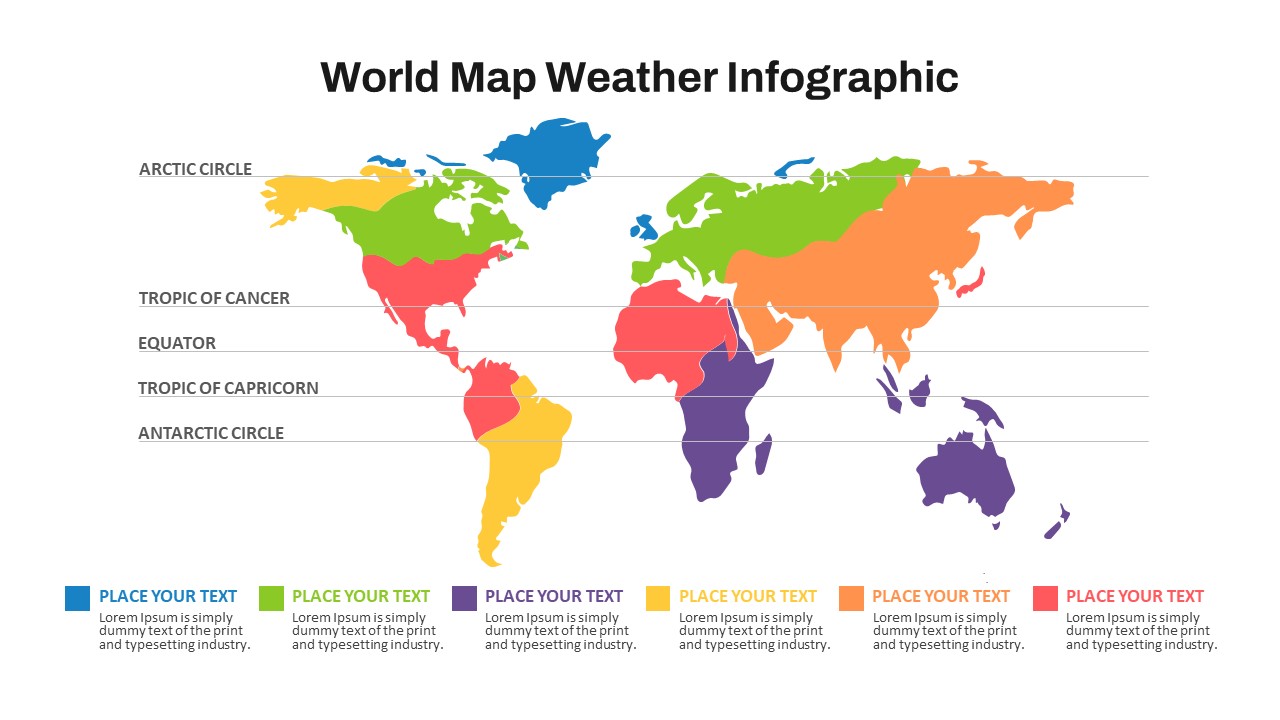
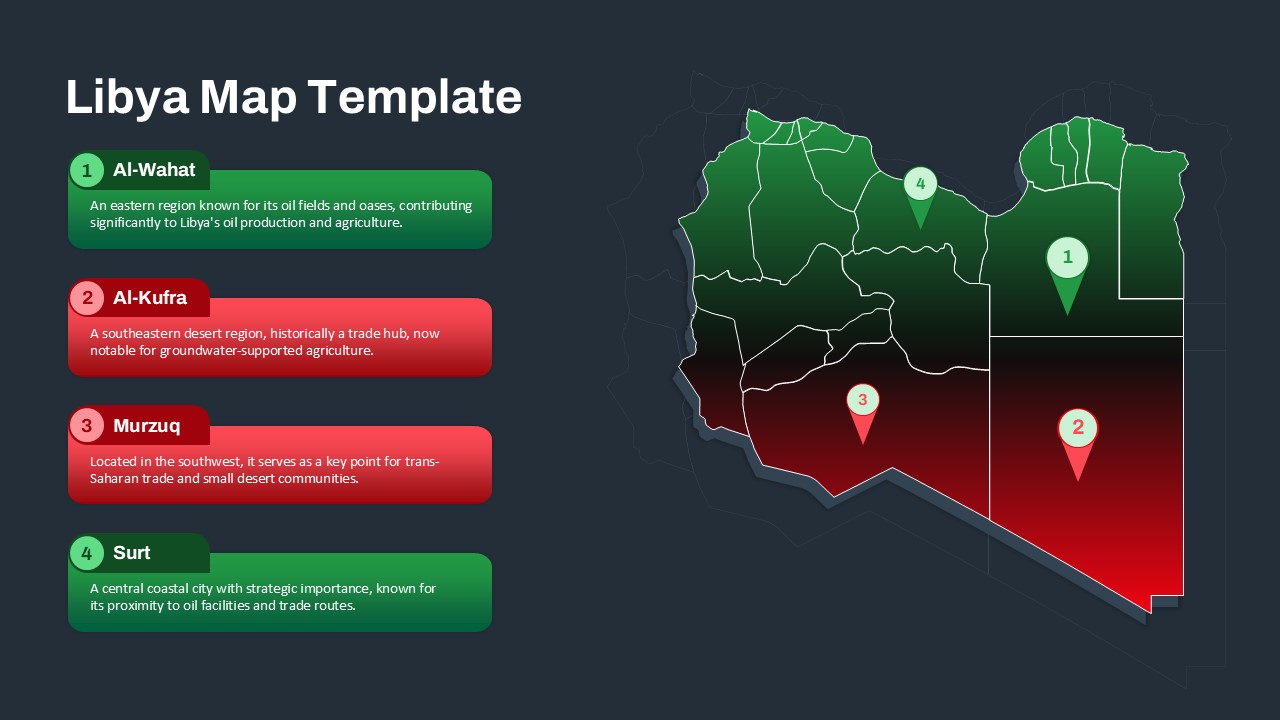
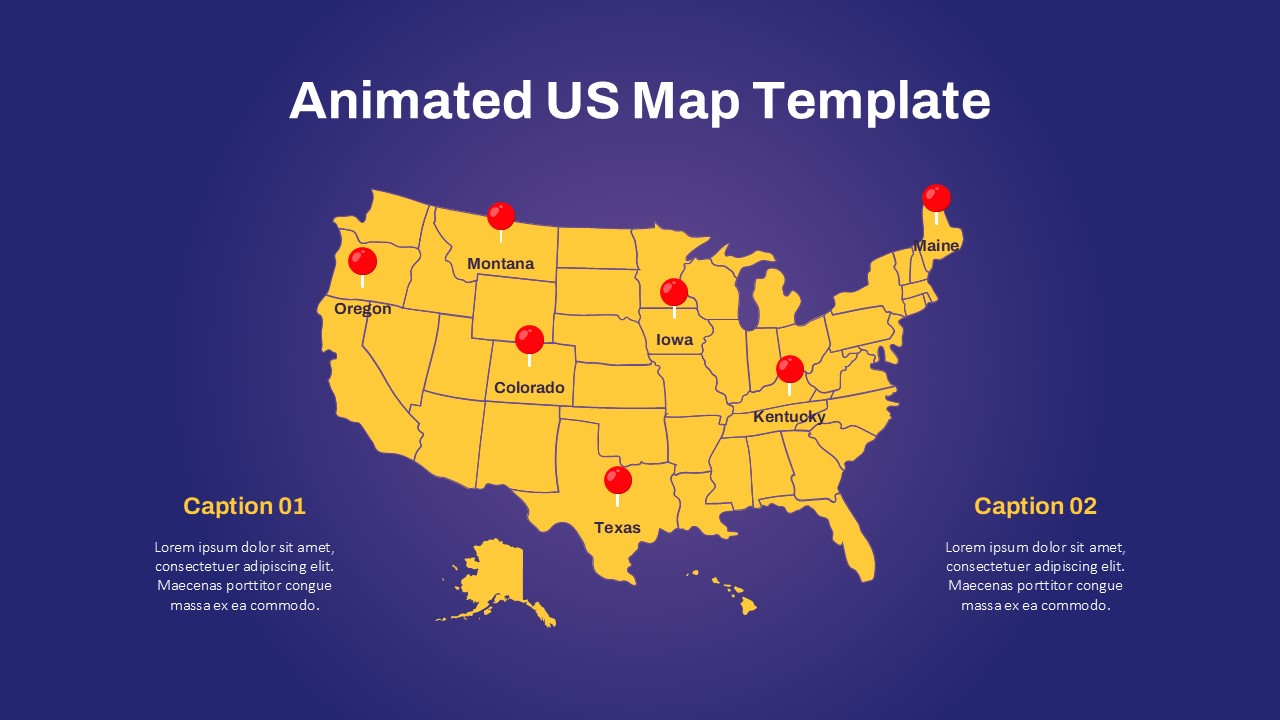
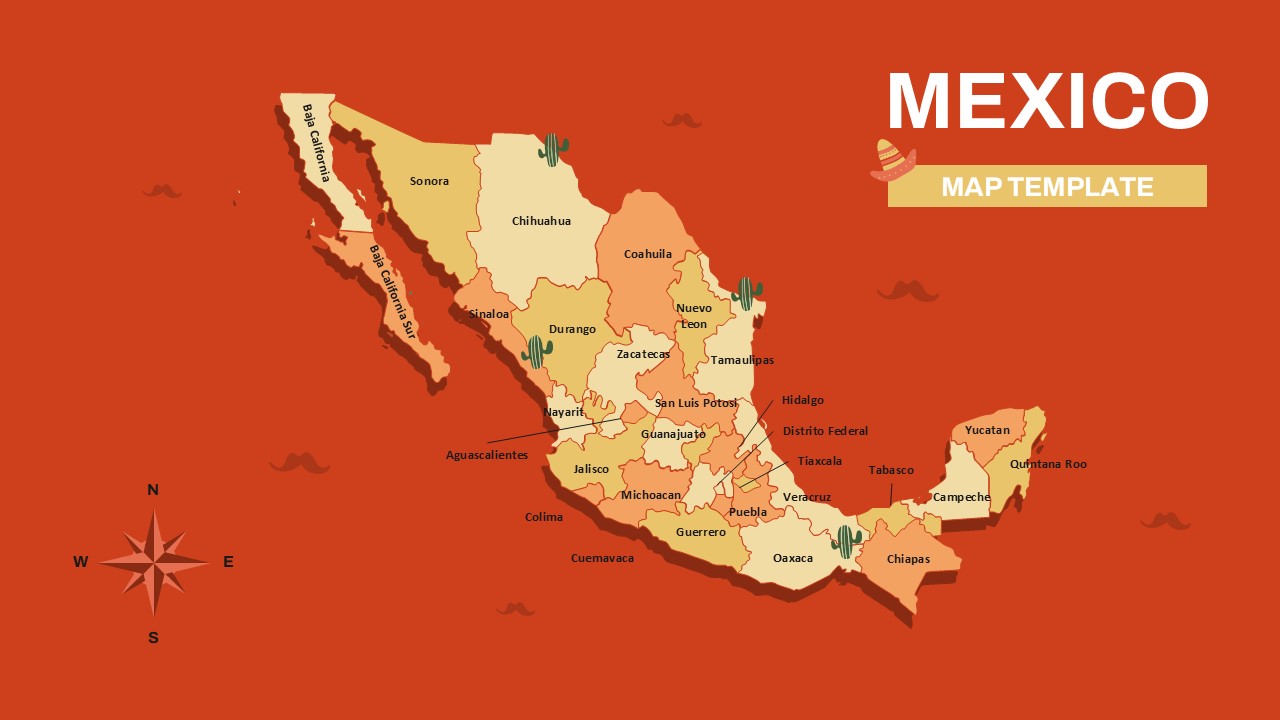
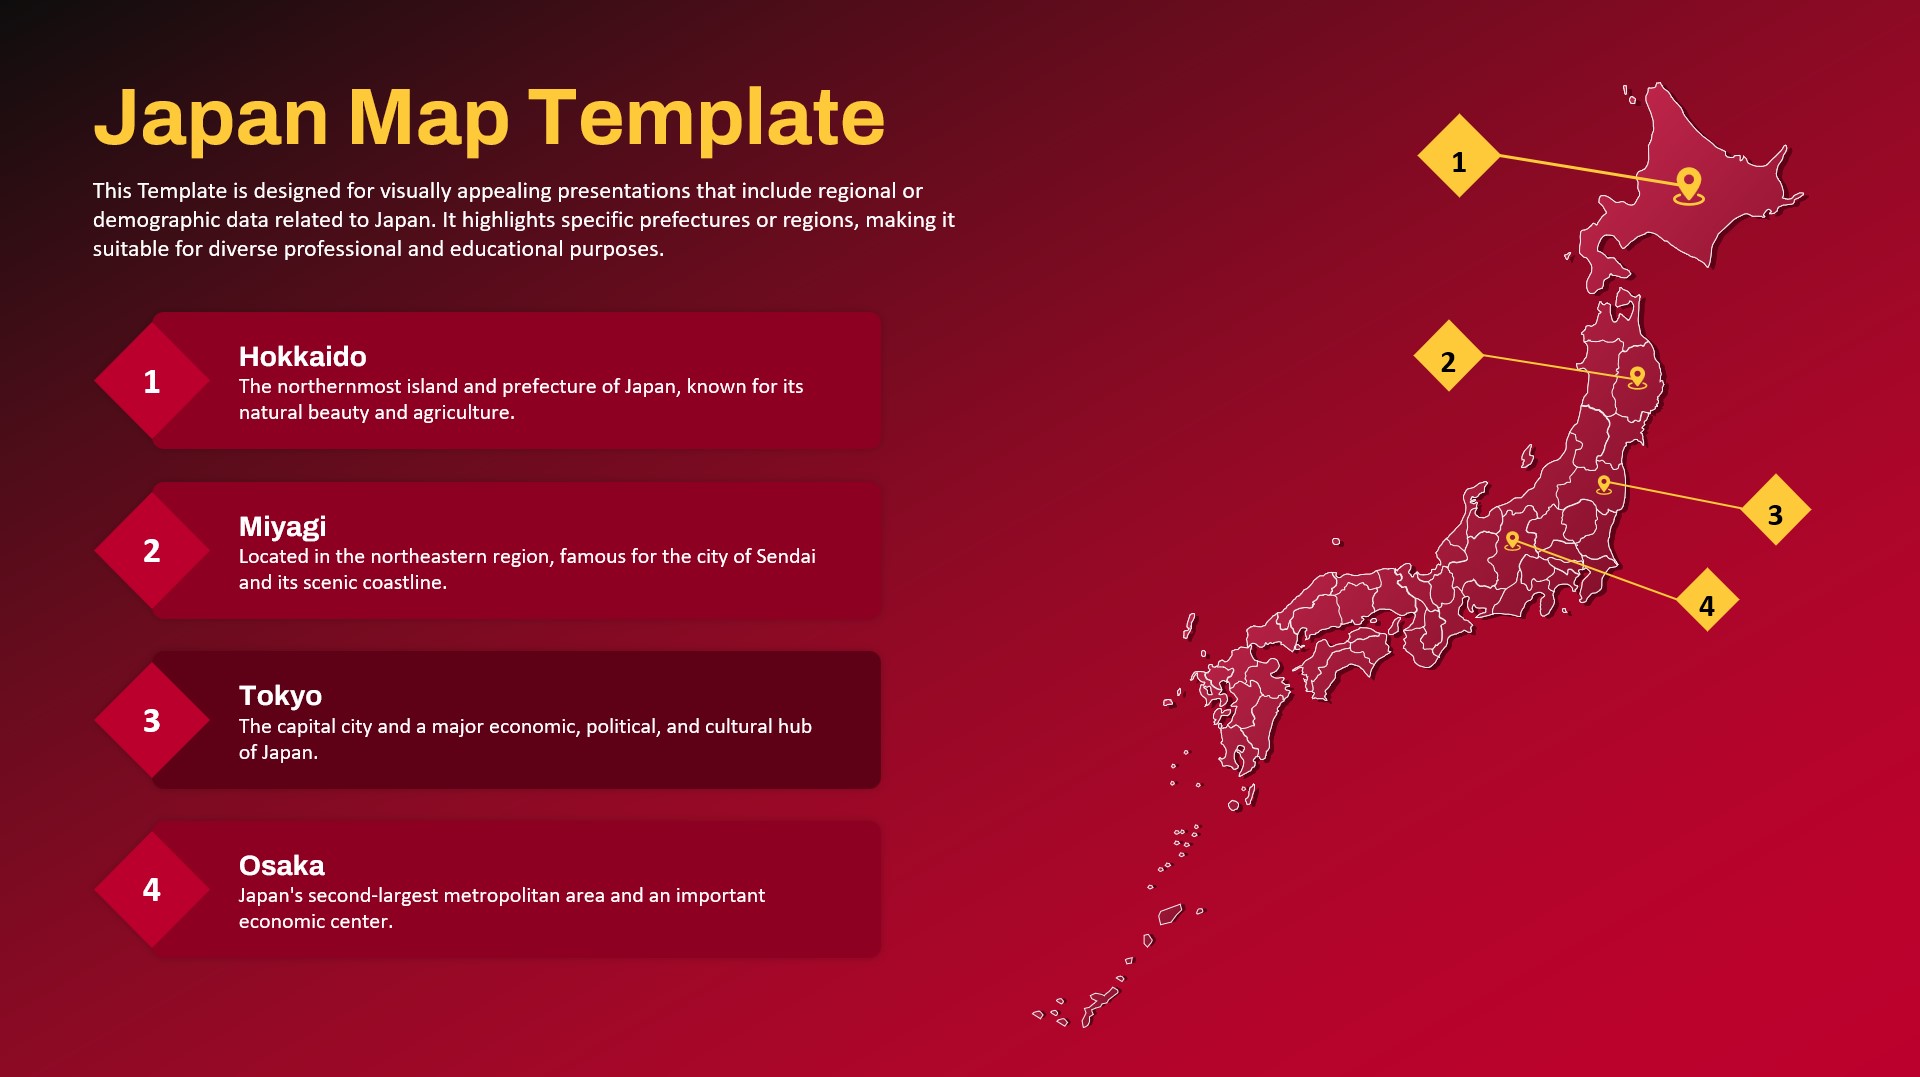
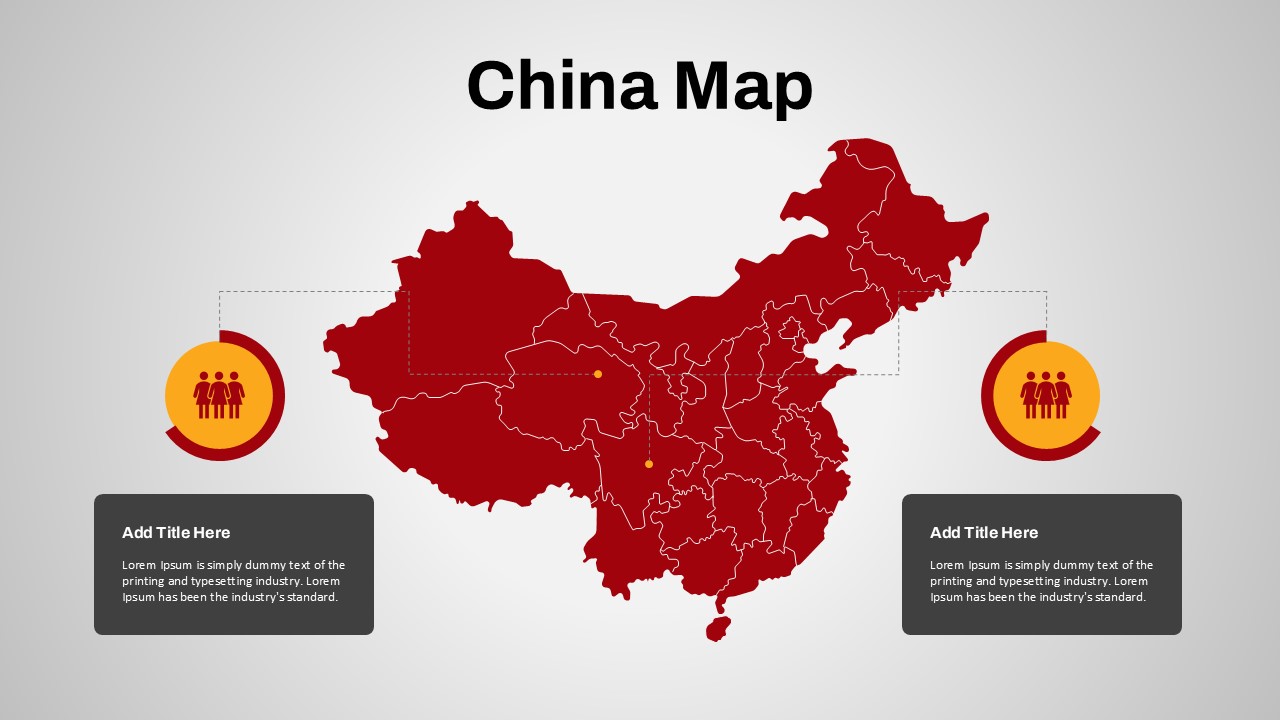
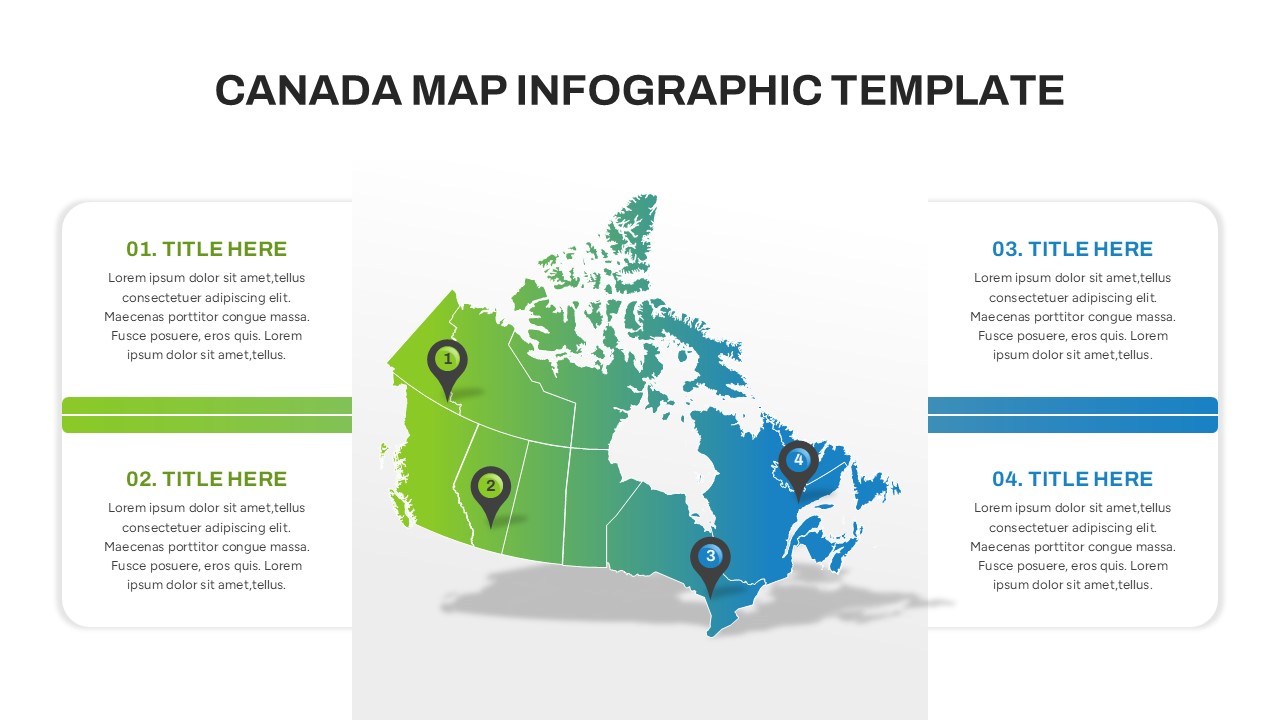
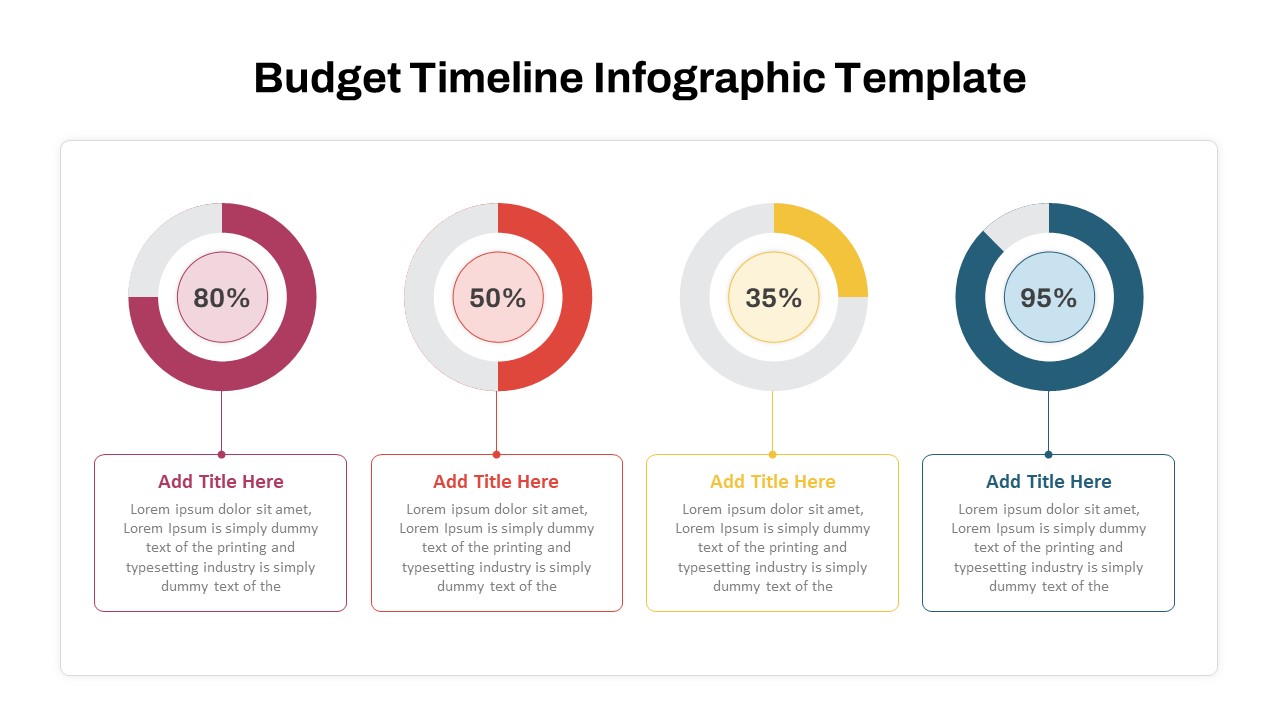
Featuring a color-coded map with highlighted regions and location markers, this slide allows users to showcase specific areas with relevant data points and percentages. The use of dynamic callouts, percentage indicators, and pin markers makes the template suitable for business strategy meetings, academic presentations, governmental reports, and regional sales analysis.
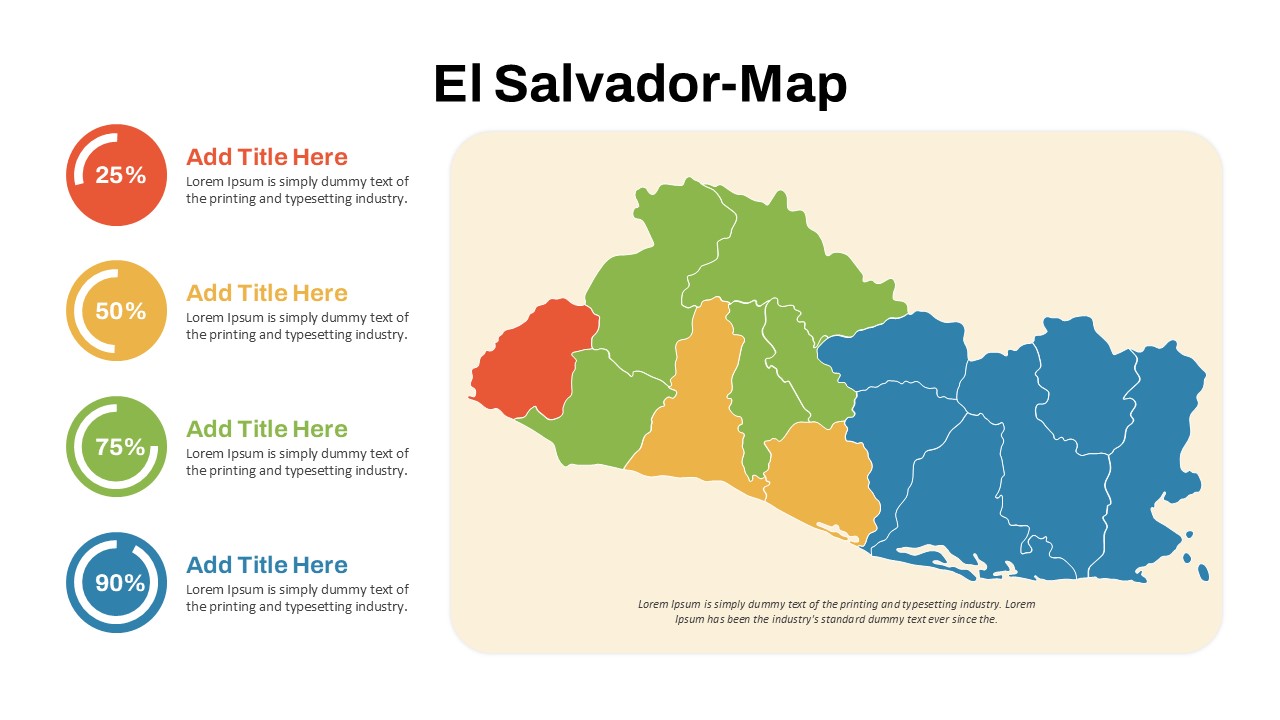
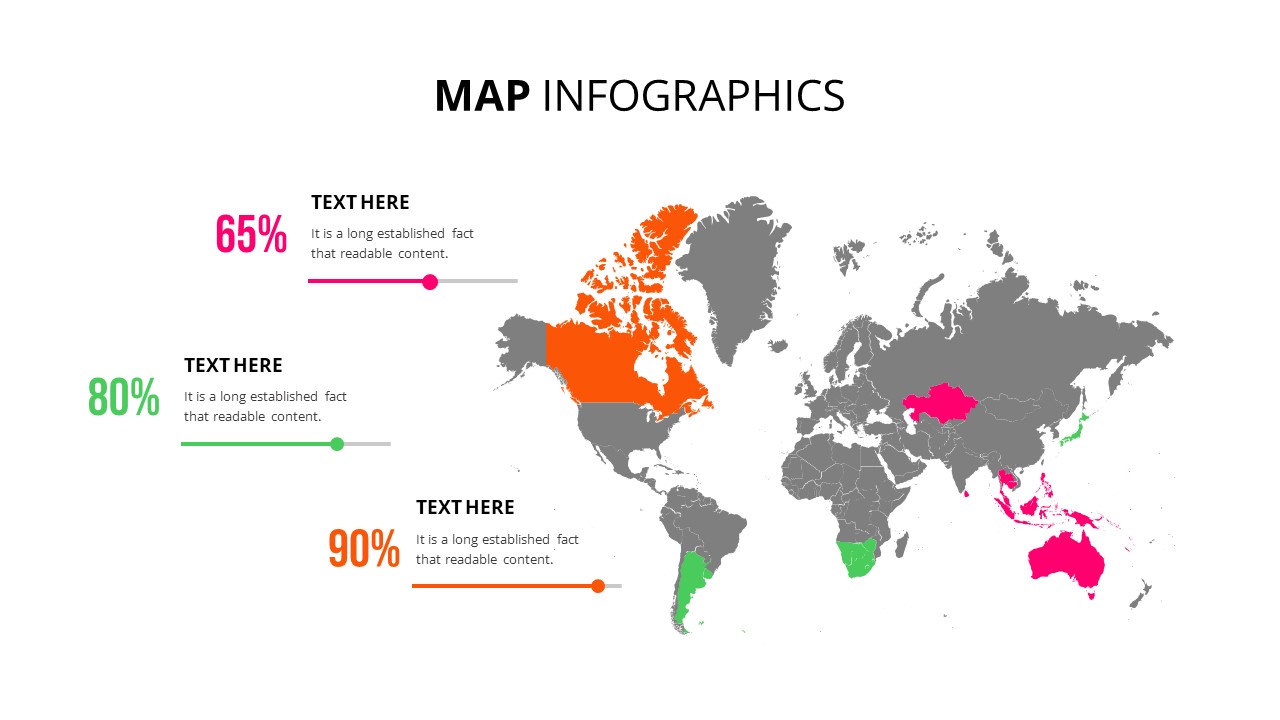
This template is perfect for business professionals, analysts, researchers, educators, and policymakers who need to present region-based insights, economic statistics, or geographical comparisons. The accompanying legend and percentage-based data representations help to make complex information more digestible and visually engaging for the audience.
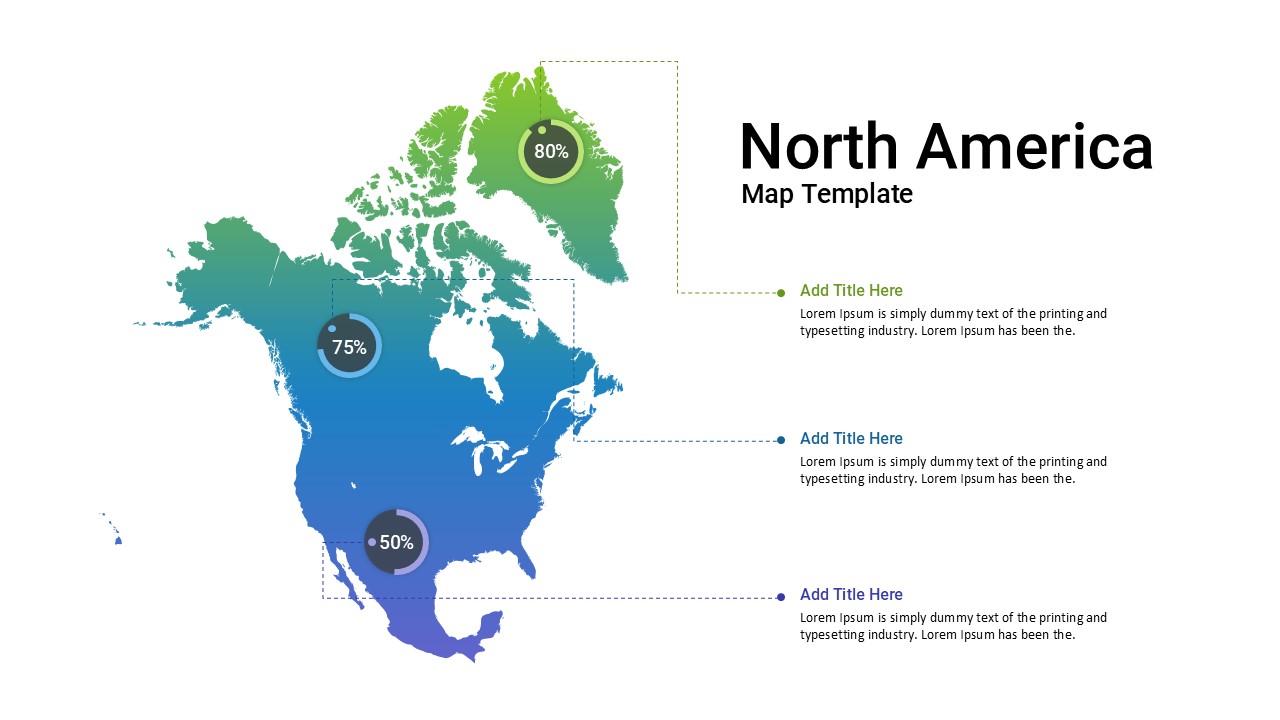
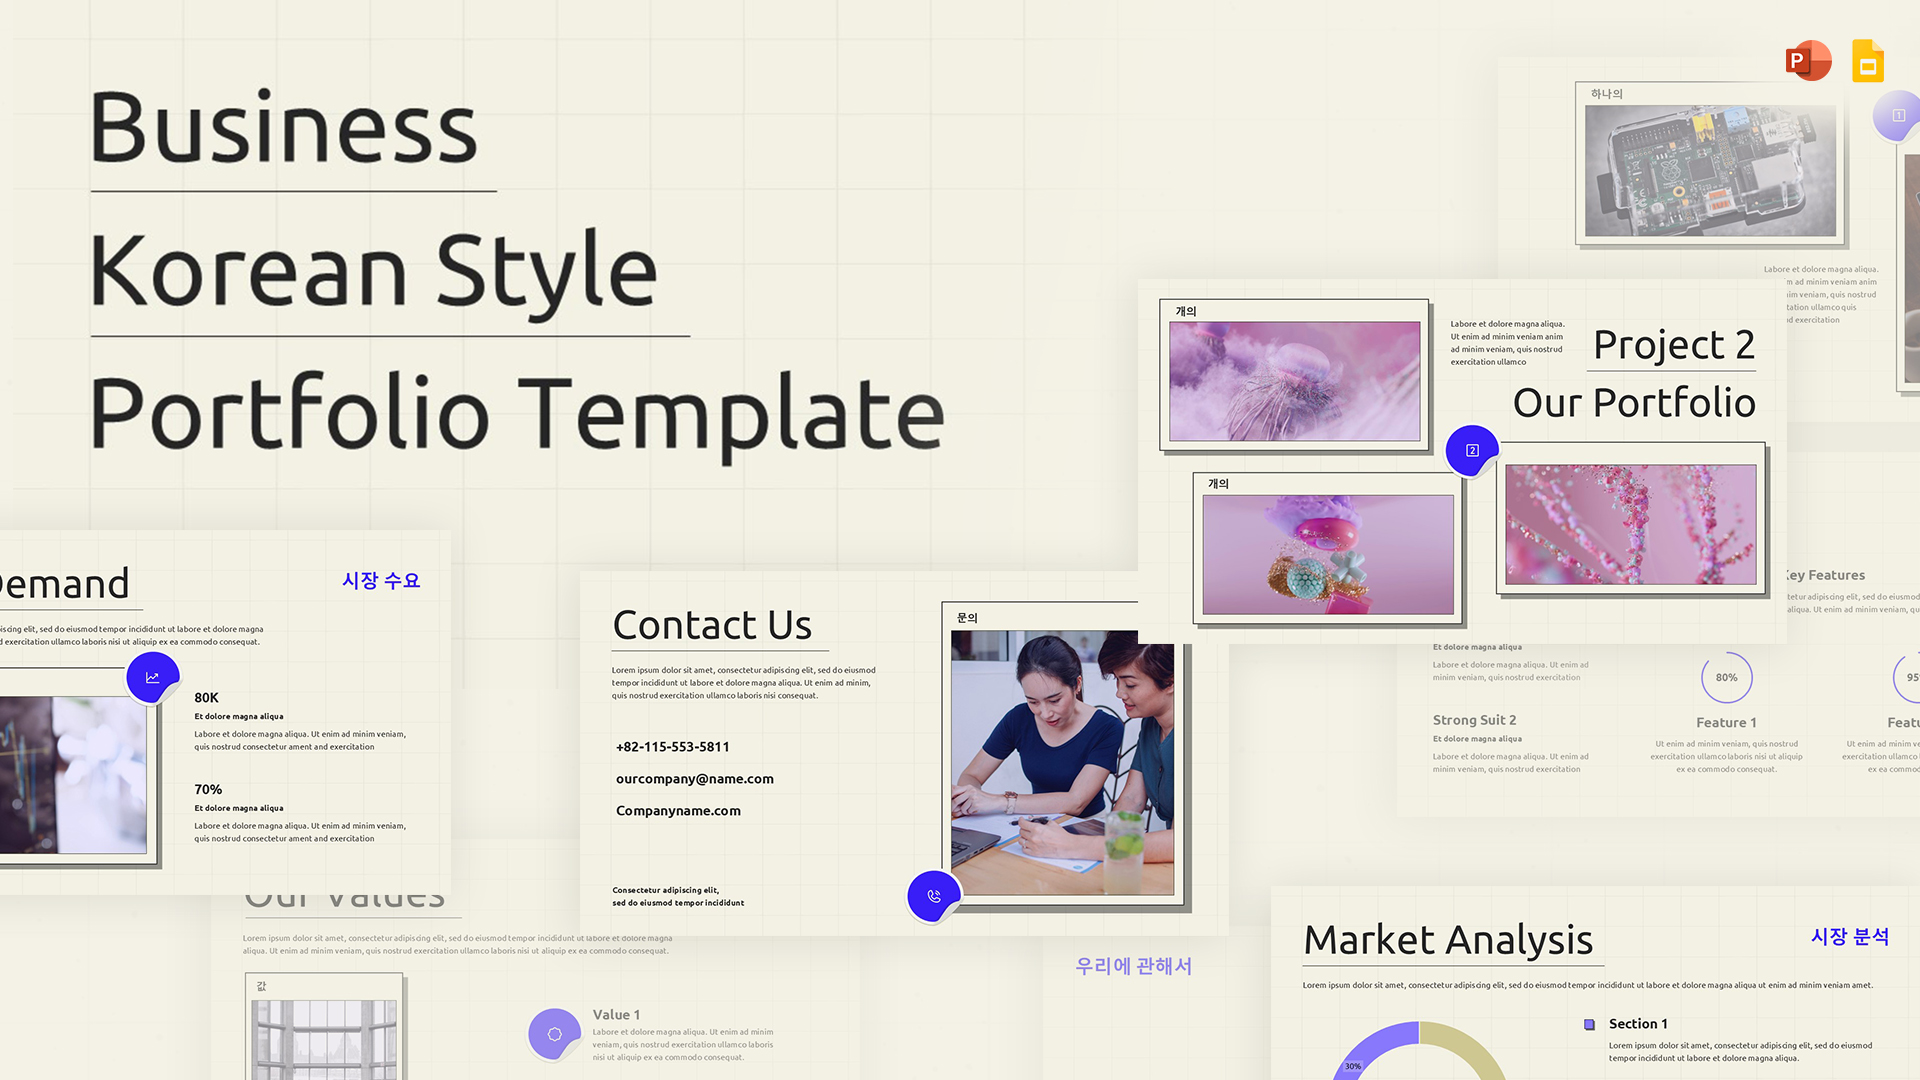
With editable text placeholders, colors, and design elements, users can customize the map to represent different industries, political divisions, or regional trends. Whether you’re tracking market penetration, tourism trends, election results, or population distribution, this PowerPoint & Google Slides template provides a clear, organized, and professional way to showcase Hungary-related data.
See more

Aspect Ratio
16:9Item ID
SKT03190
Features of this template
Other Use Cases of the Template:
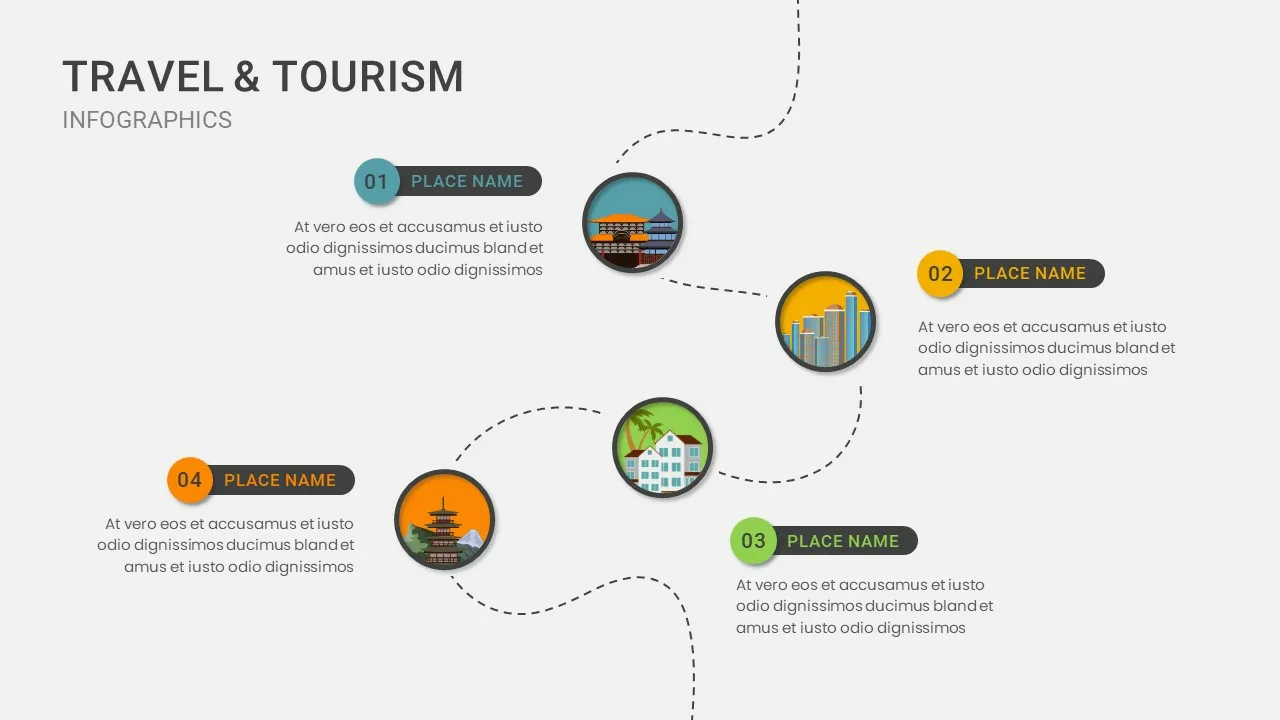
Market research analysis, business expansion planning, regional sales performance, demographic studies, government policy presentations, tourism and travel insights, election result mapping, economic trend reports, academic geography lessons, corporate strategy development.
FAQs
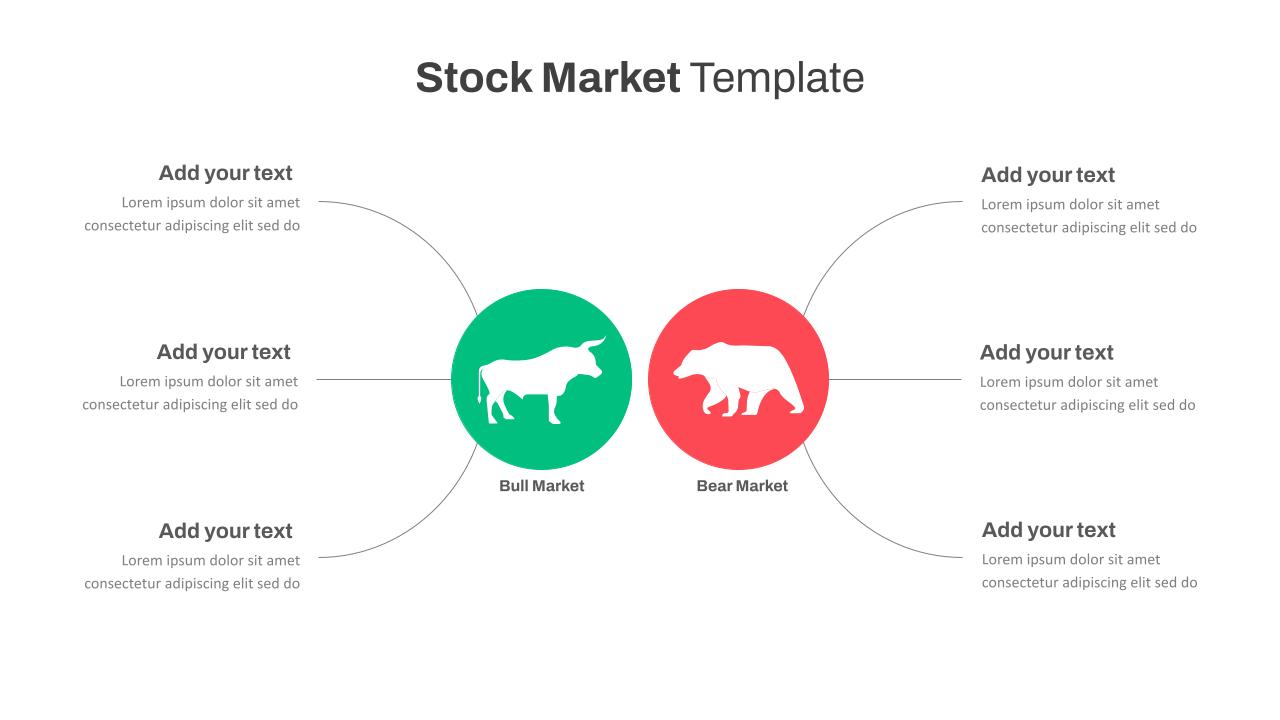
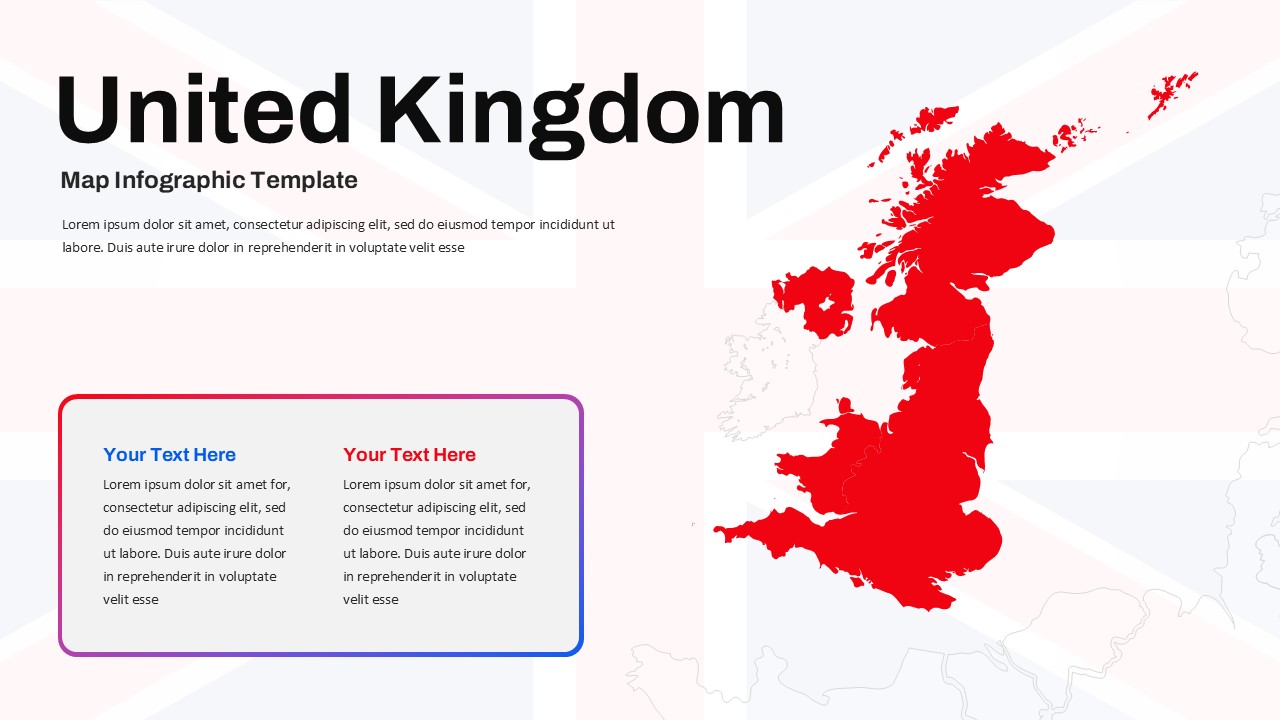
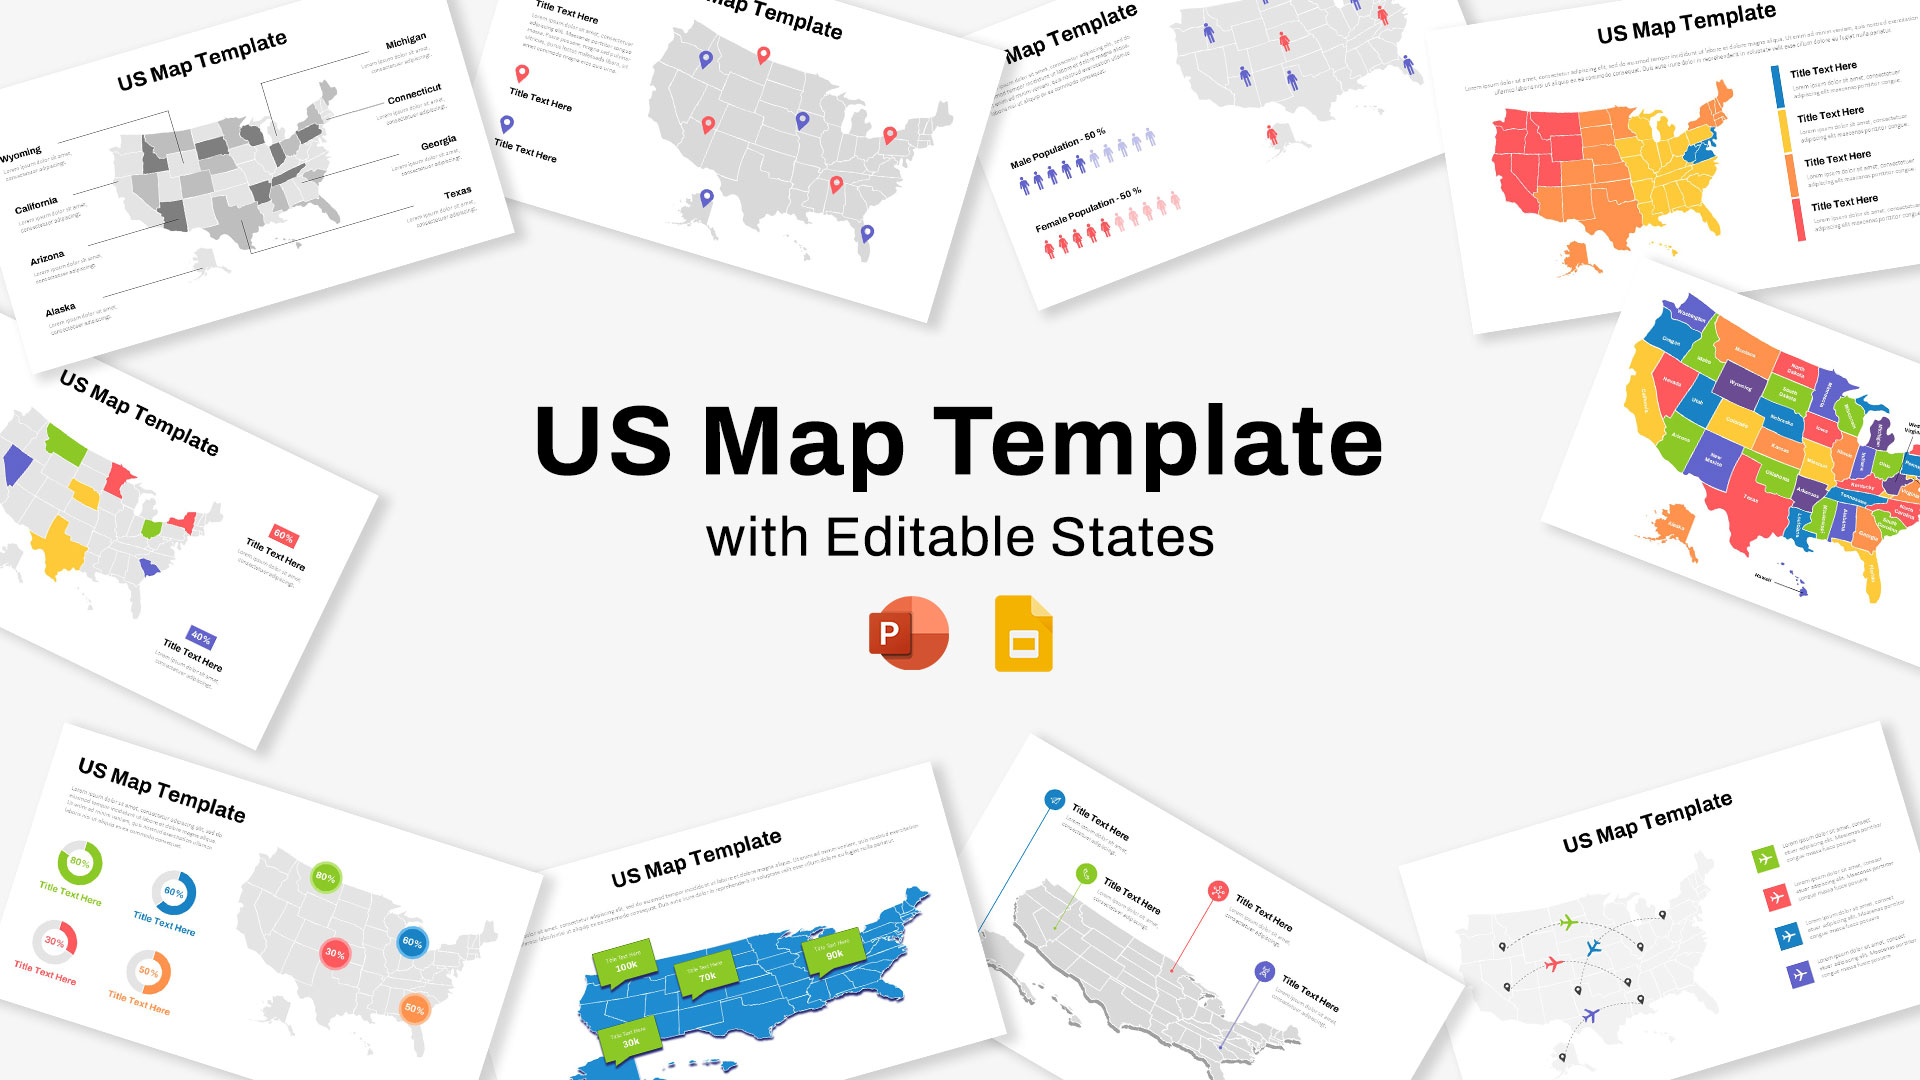
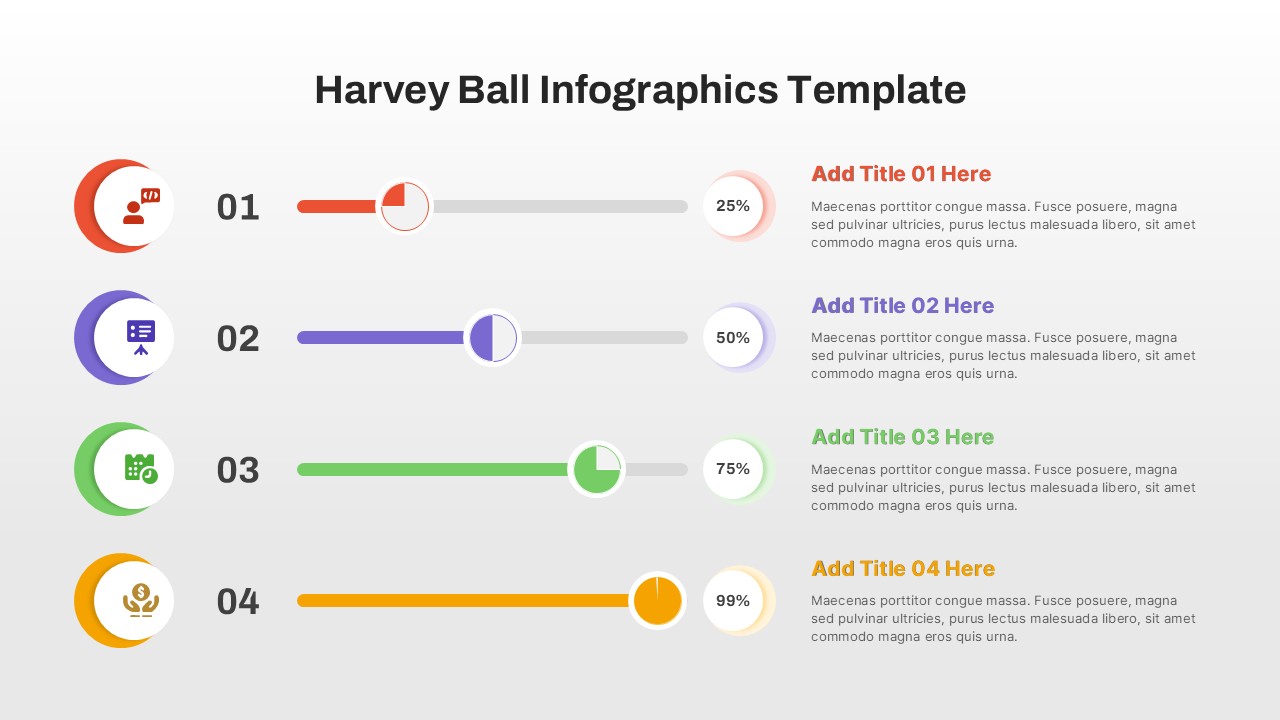
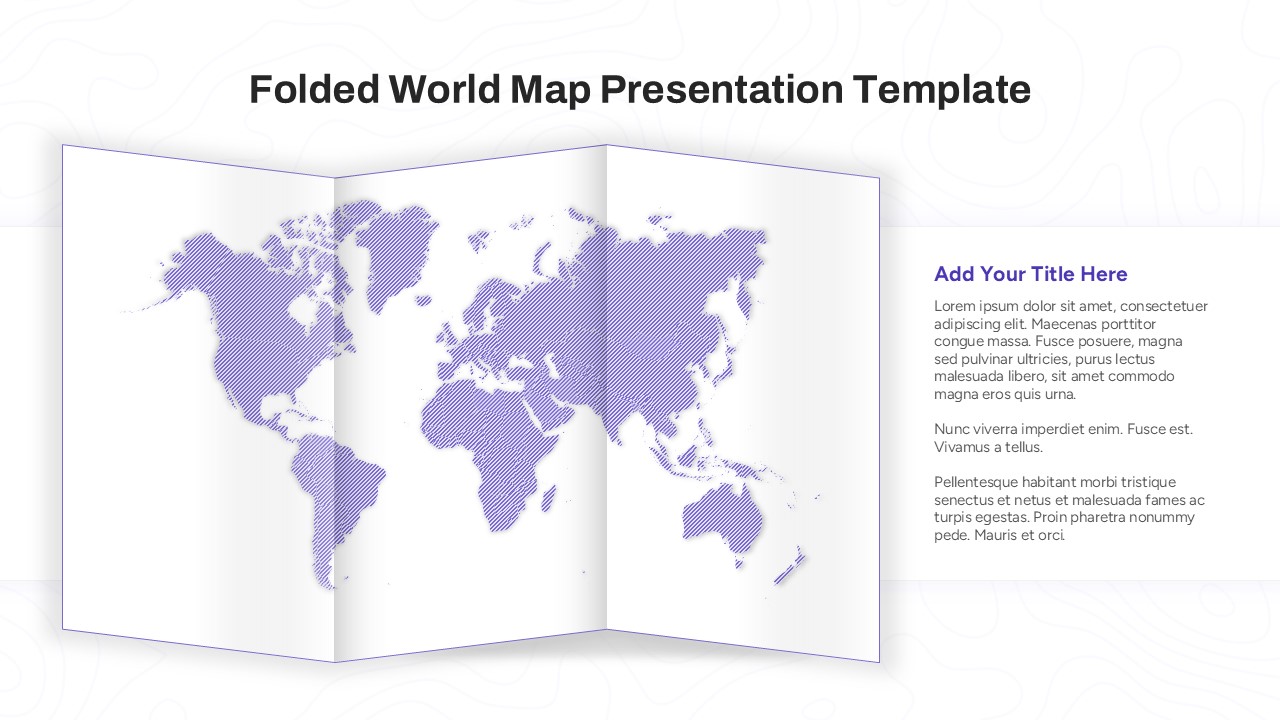
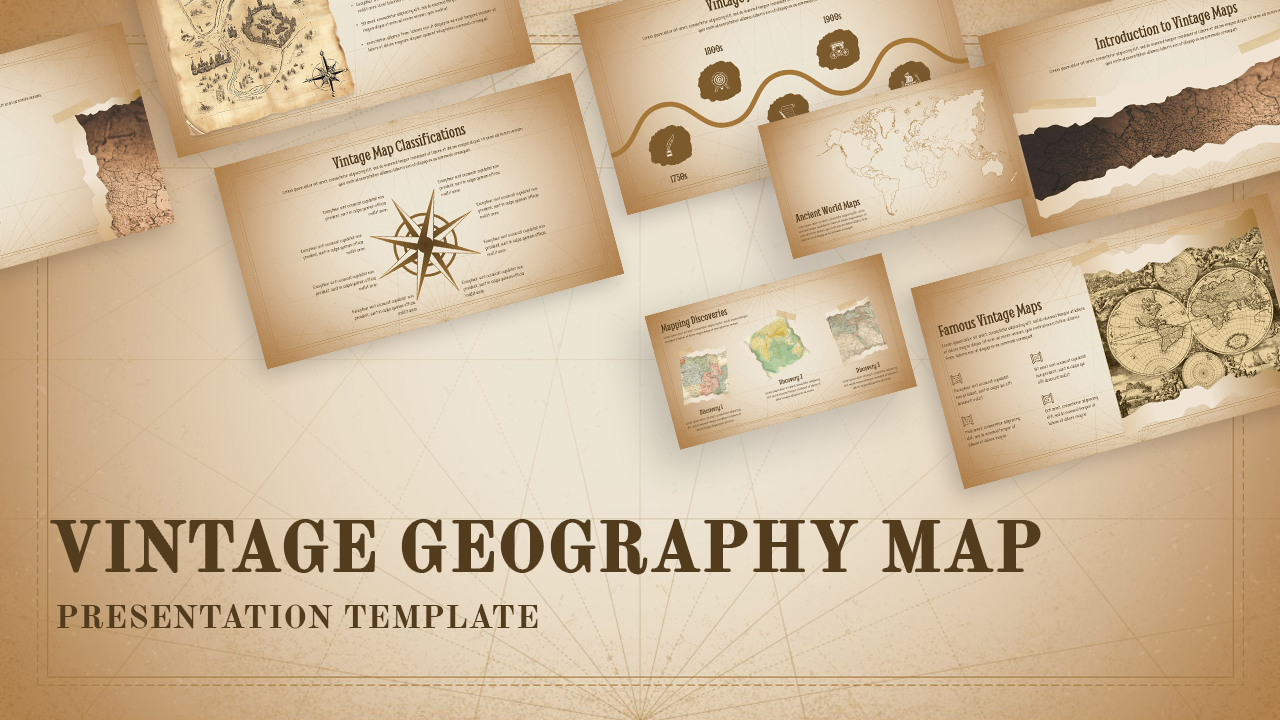
You May Also Like These Presentation Templates


- Free
- Free


- Free

- Free


- Free
- Free
- Free
- Free