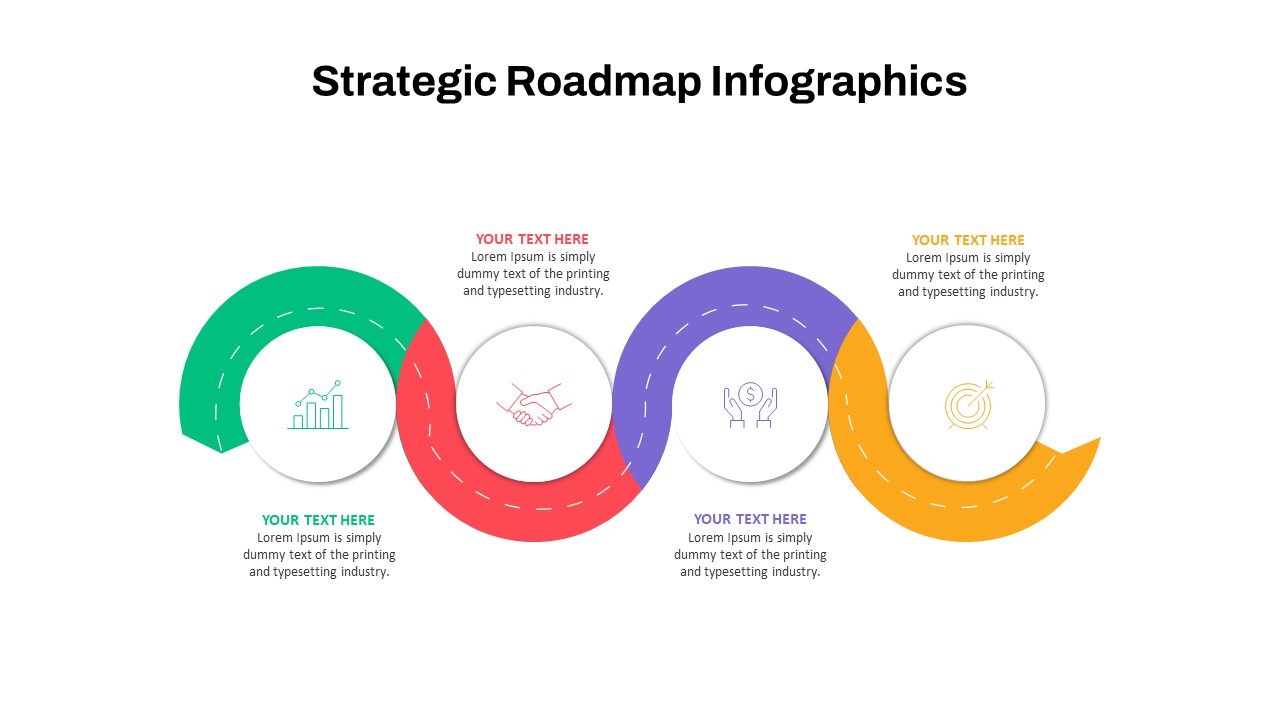
Free Infographic Cycle Diagram For PowerPoint


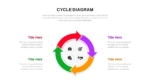
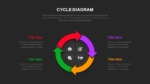
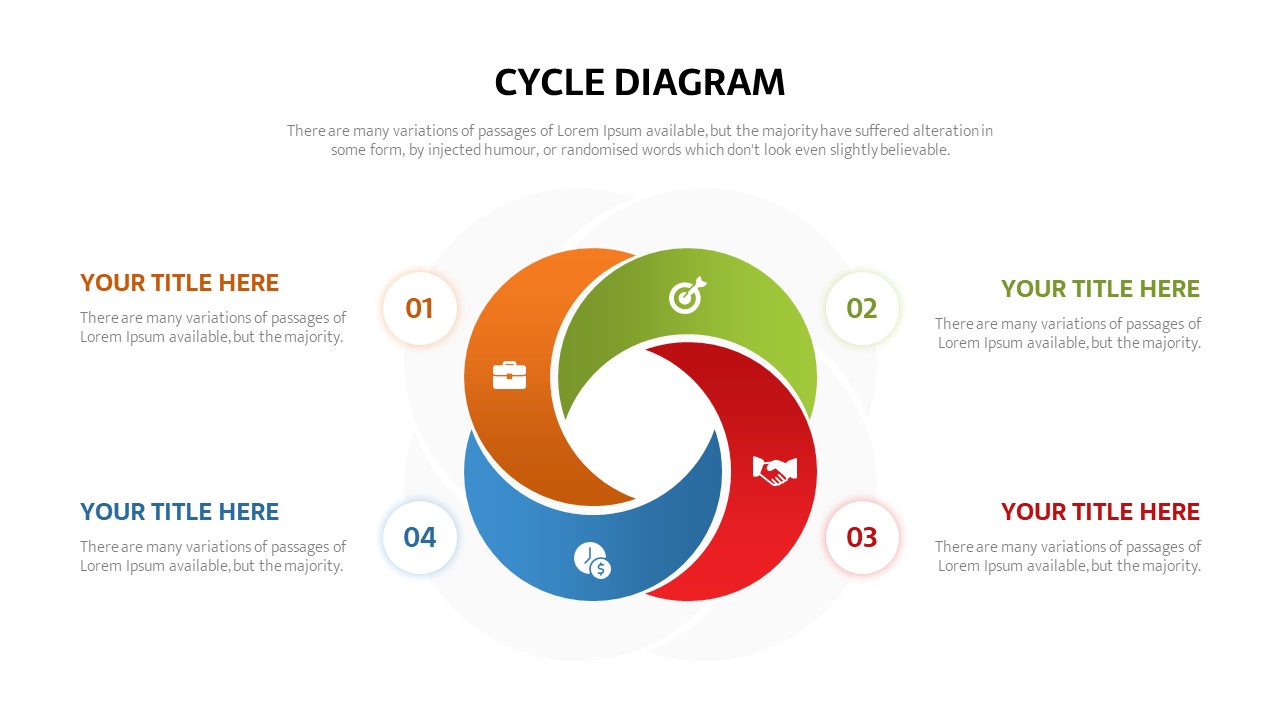
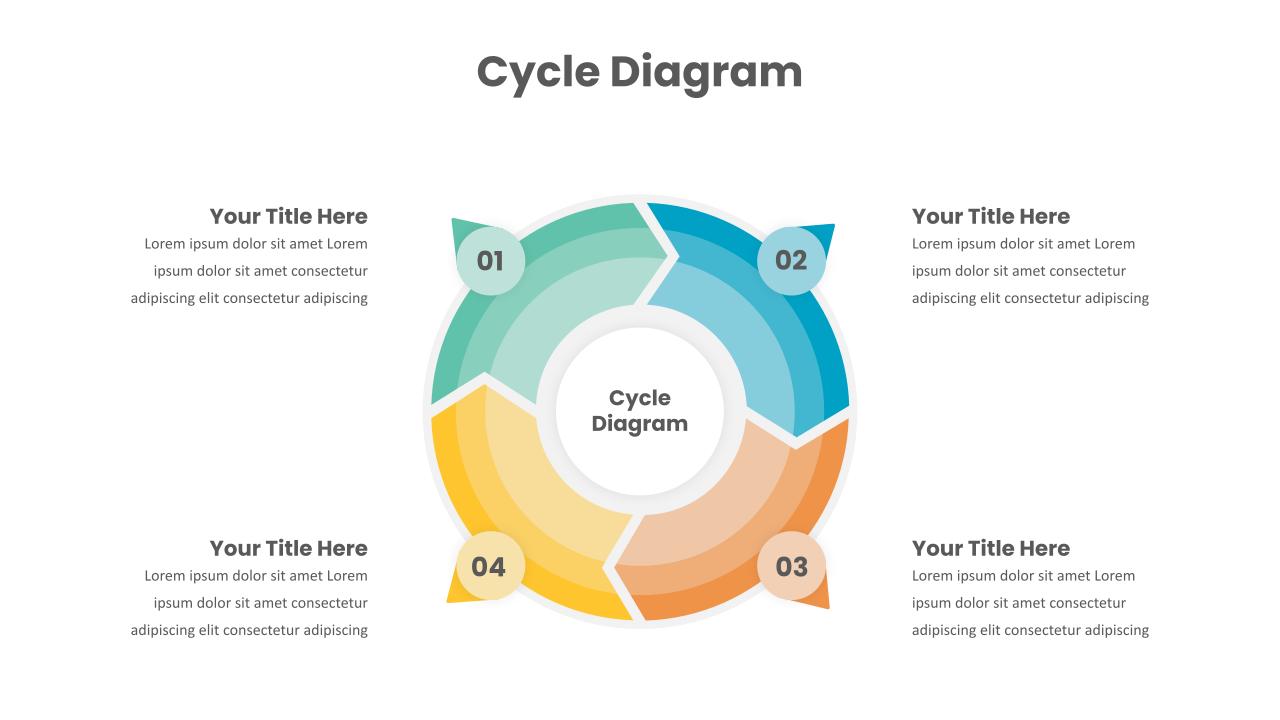
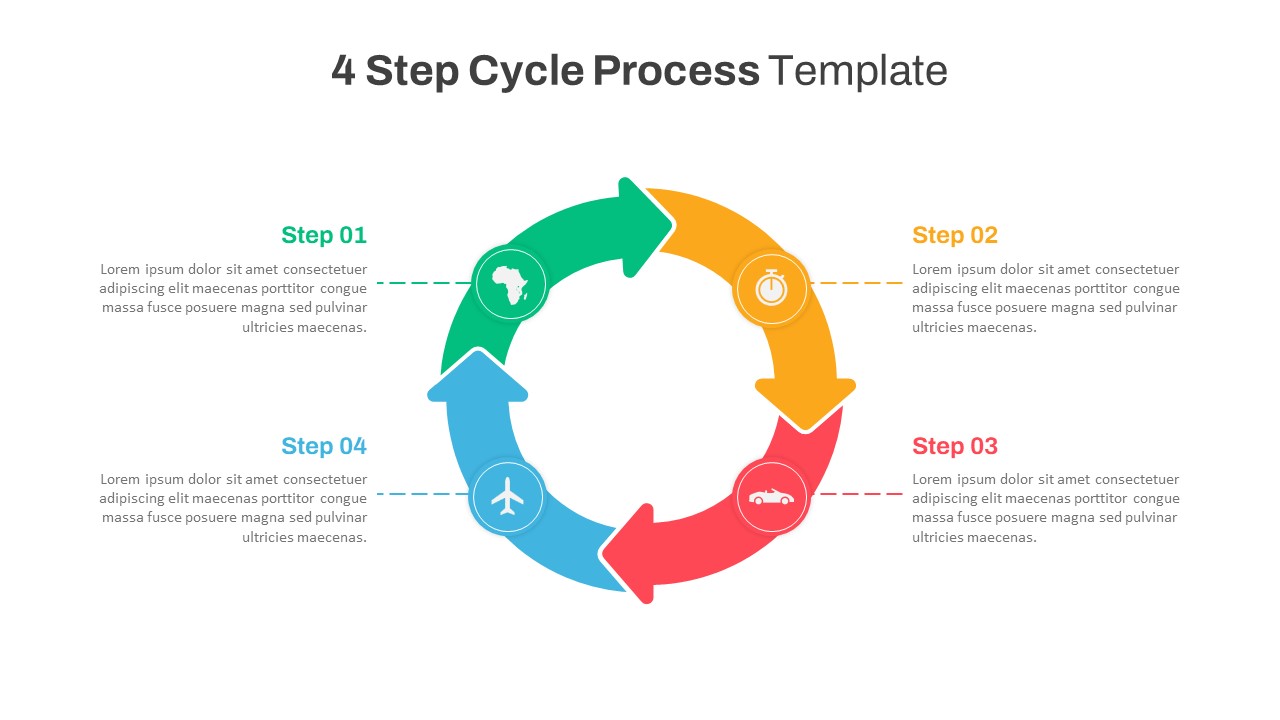
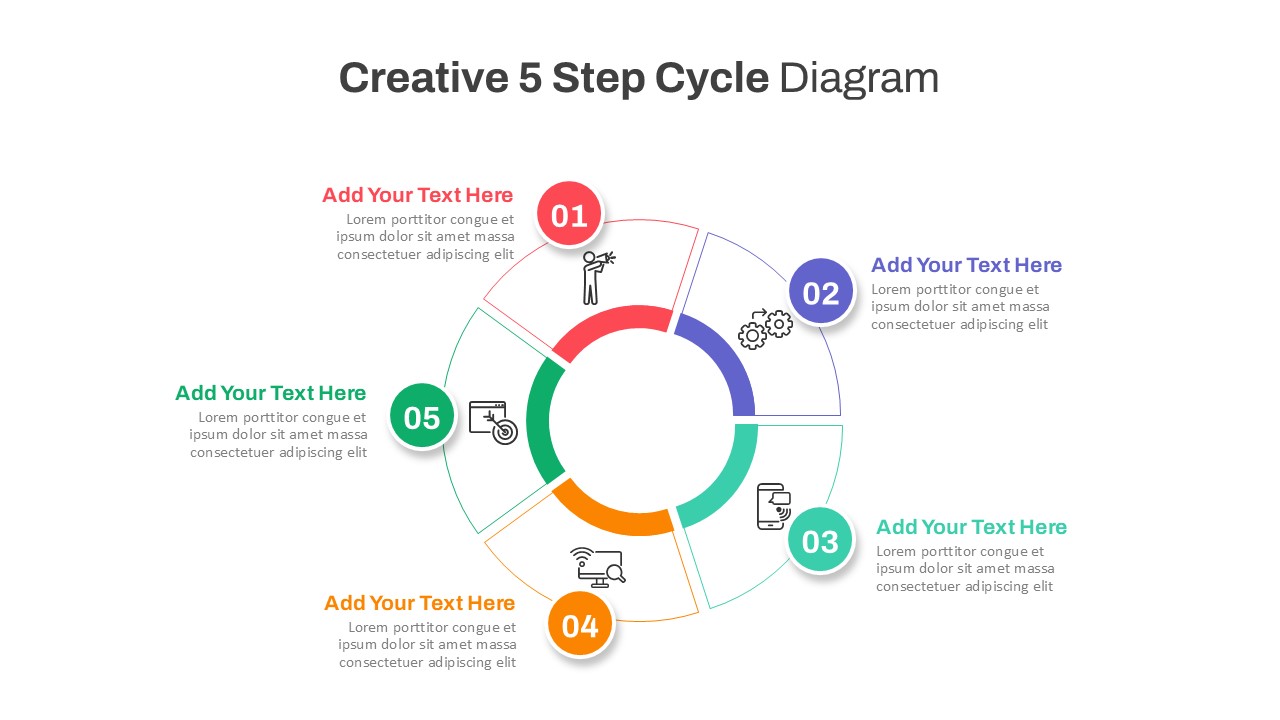
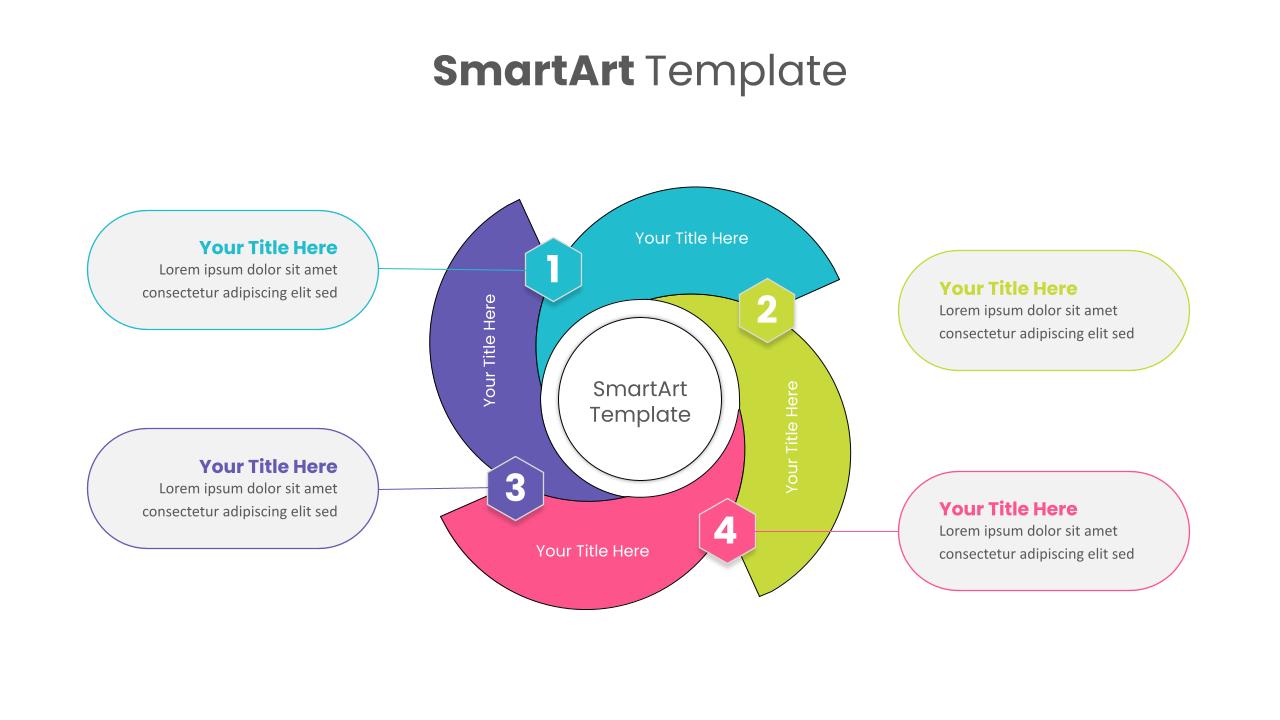
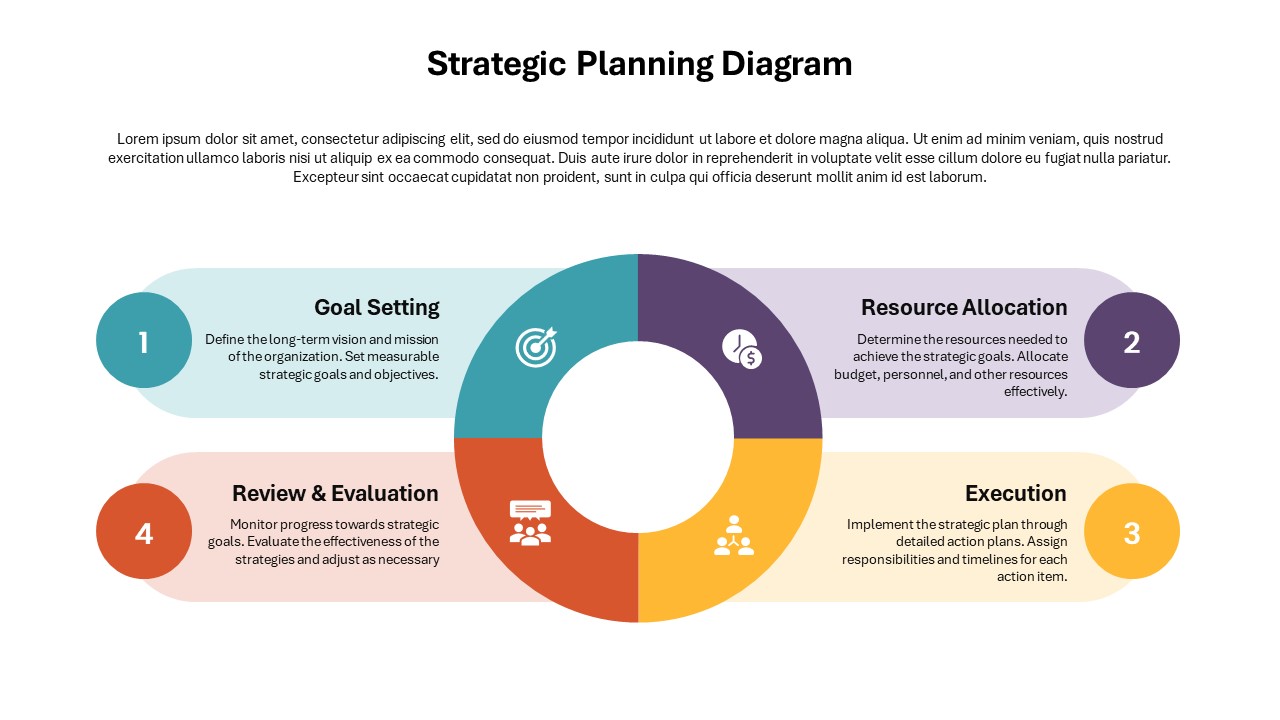
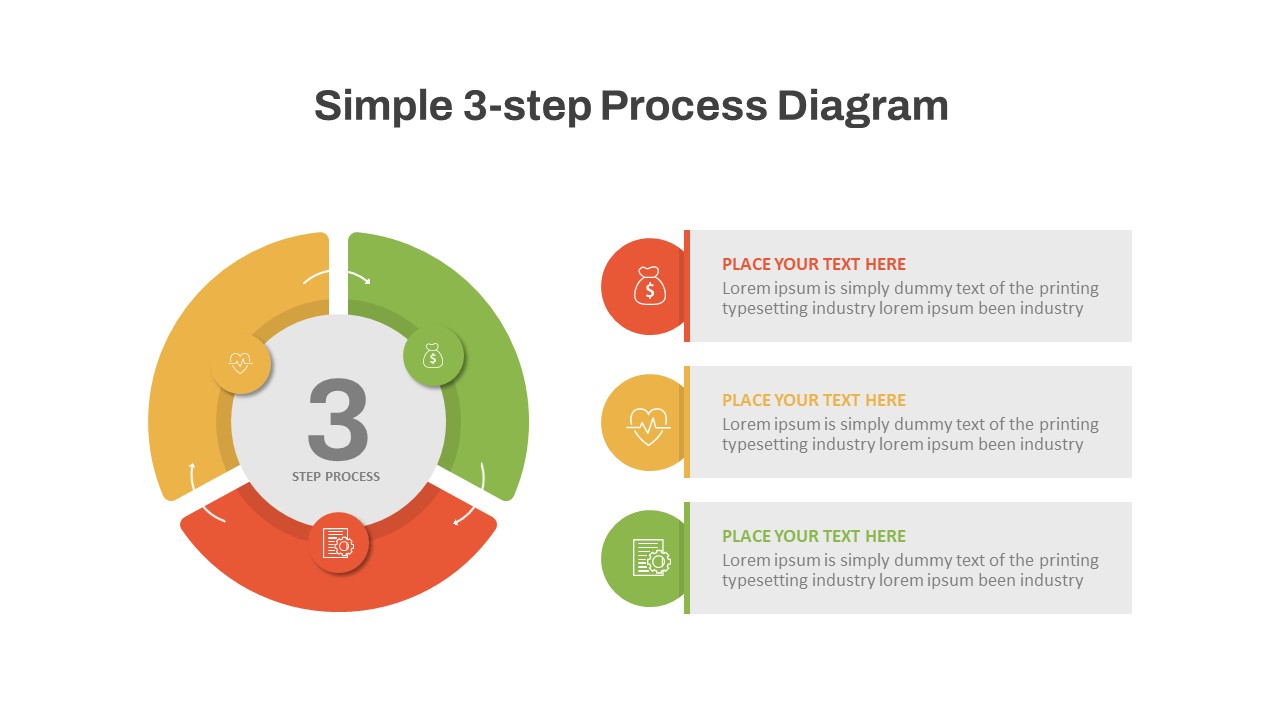
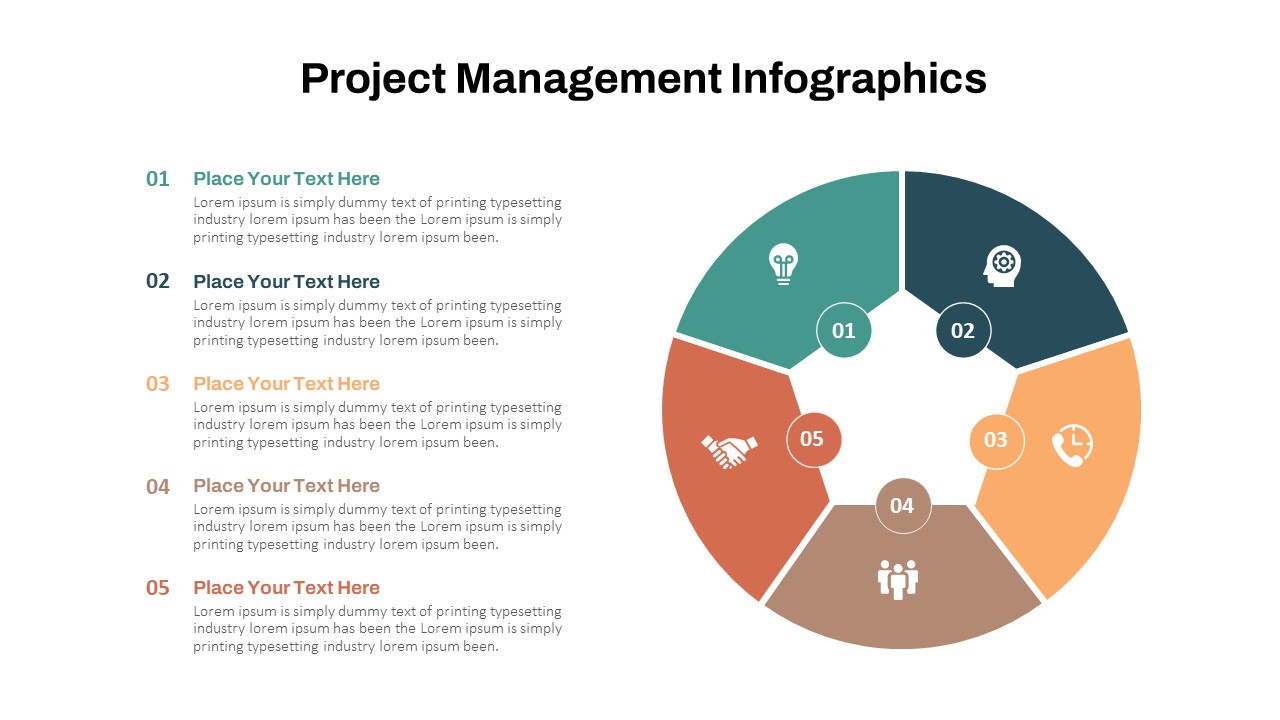
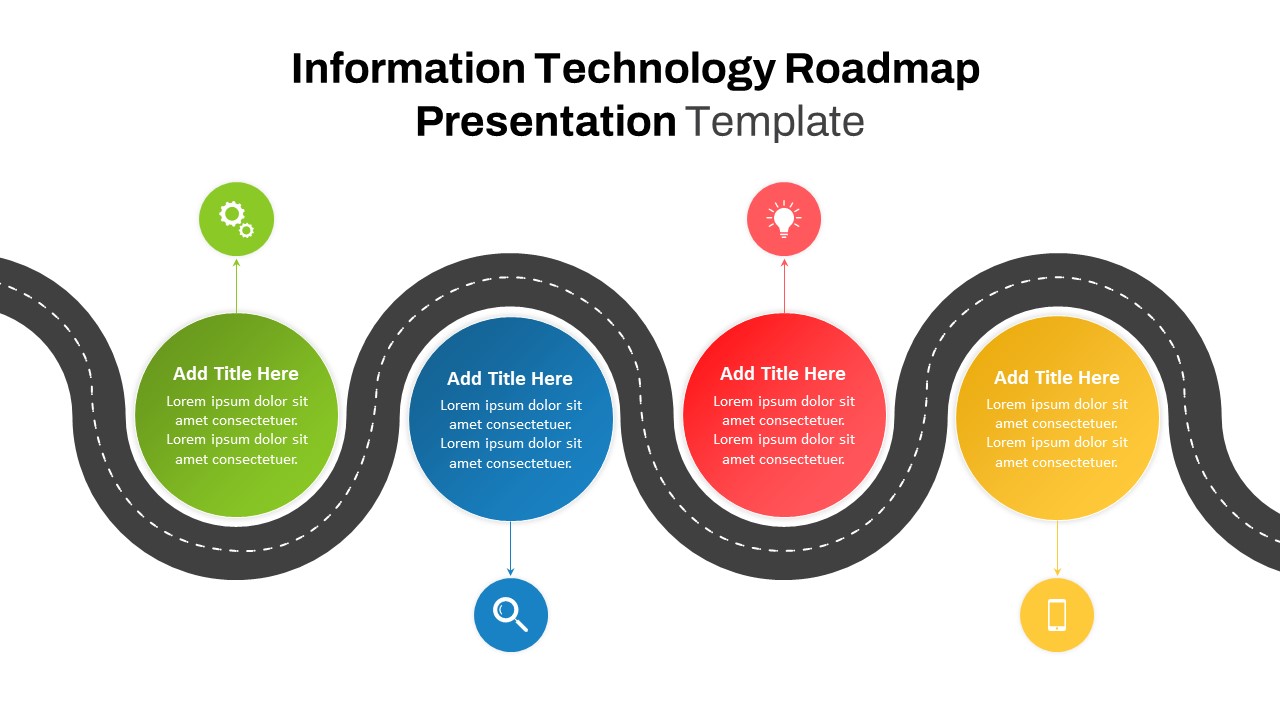
The Colorful Cycle Diagram Template is a vibrant and visually engaging tool designed to showcase processes, cycles, or continuous workflows. At the center of this Infographic Cycle Diagram For PowerPoint, a four-segmented circular diagram is displayed, each section represented by an arrow and highlighted with a bold color—red, green, purple, and orange. These arrows illustrate a seamless flow from one phase to the next, making the template perfect for demonstrating cyclic processes such as project management, business strategies, product lifecycles, or financial planning.
In the middle of the cycle, simple yet effective icons represent key themes such as goals, business, finance, and collaboration, adding clarity and emphasis to the content. Surrounding the cycle are four text boxes where users can insert their own titles and descriptions, making the template fully customizable and versatile for various presentation needs. The minimalist white background keeps the focus on the content, ensuring your message stands out. This template is ideal for both PowerPoint and Google Slides, offering flexibility and ease of use for presentations in business, education, project planning, and more. The clean and professional layout is designed to maintain audience engagement and provide a clear, structured overview of any process or cycle.
See more

Aspect Ratio
16:9Item ID
SKT00679
FAQs
You May Also Like These Presentation Templates


- Free
- Free
- Free
- Free
- Free
- Free
- Free
- Free
- Free
- Free
- Free
- Free