Infographic Pie Chart PPT Template


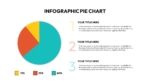
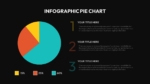
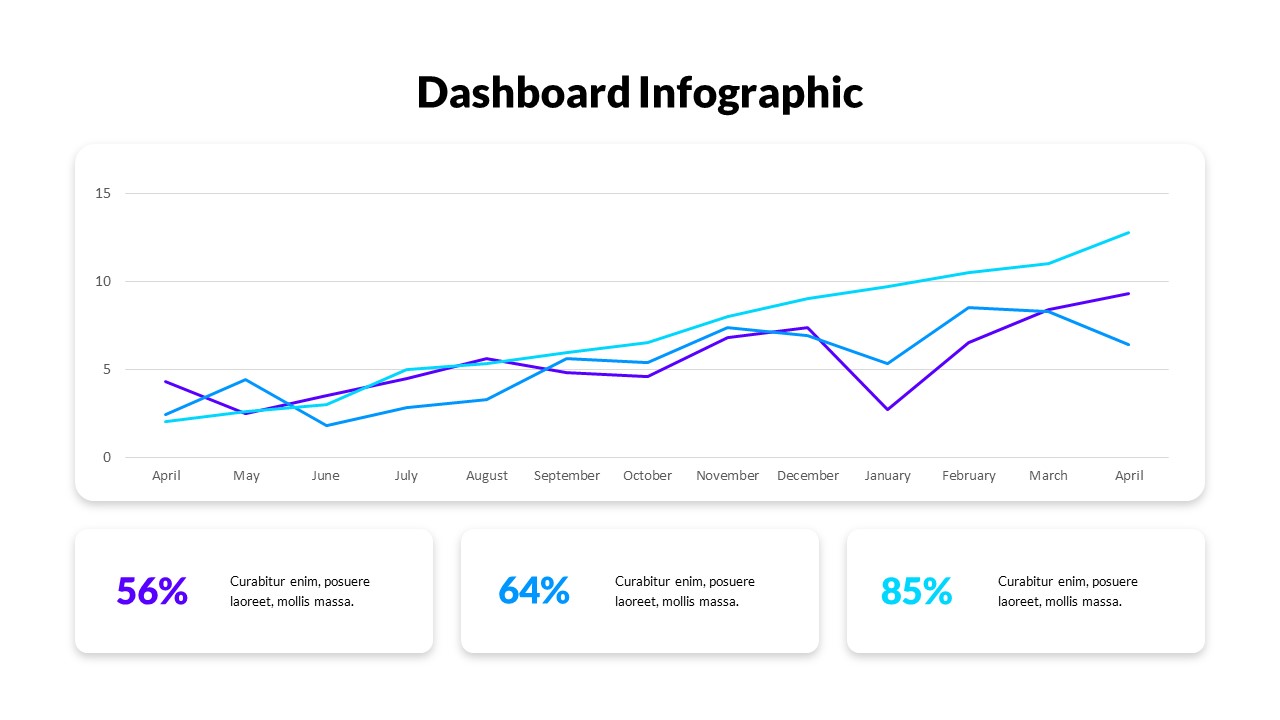
The Infographic Pie Chart Template is a dynamic and visually appealing way to present data in a simplified, digestible format. Featuring a three-segment pie chart at the center of the slide, the Pie Chart Ppt template allows for the presentation of proportional data with sections labeled 15%, 25%, and 60%. Each segment is color-coded—yellow, orange, and teal—creating a clear visual distinction between the different categories. Accompanying the pie chart are three corresponding numbered sections on the right, where users can insert relevant information and detailed explanations for each data segment.
This circle chart PowerPoint is perfect for making statistics, survey results, or market shares more engaging for your audience. Its modern, minimalist design ensures that the data is the focal point while the bright colors keep the audience’s attention. Ideal for use in business reports, financial reviews, educational presentations, or marketing analytics, this template is fully customizable, enabling you to adapt the content and colors to fit your specific needs.
Compatible with both PowerPoint and Google Slides, the pie graph PPT template offers flexibility and ease of use, making it suitable for various professional and academic settings.
See more

Aspect Ratio
16:9Item ID
SKT00693
FAQs
You May Also Like These Presentation Templates


- Free
- Free

- Free

- Free

- Free
- Free
- Free
- Free
- Free
- Free