Infographic Pie Chart Templates For PPT

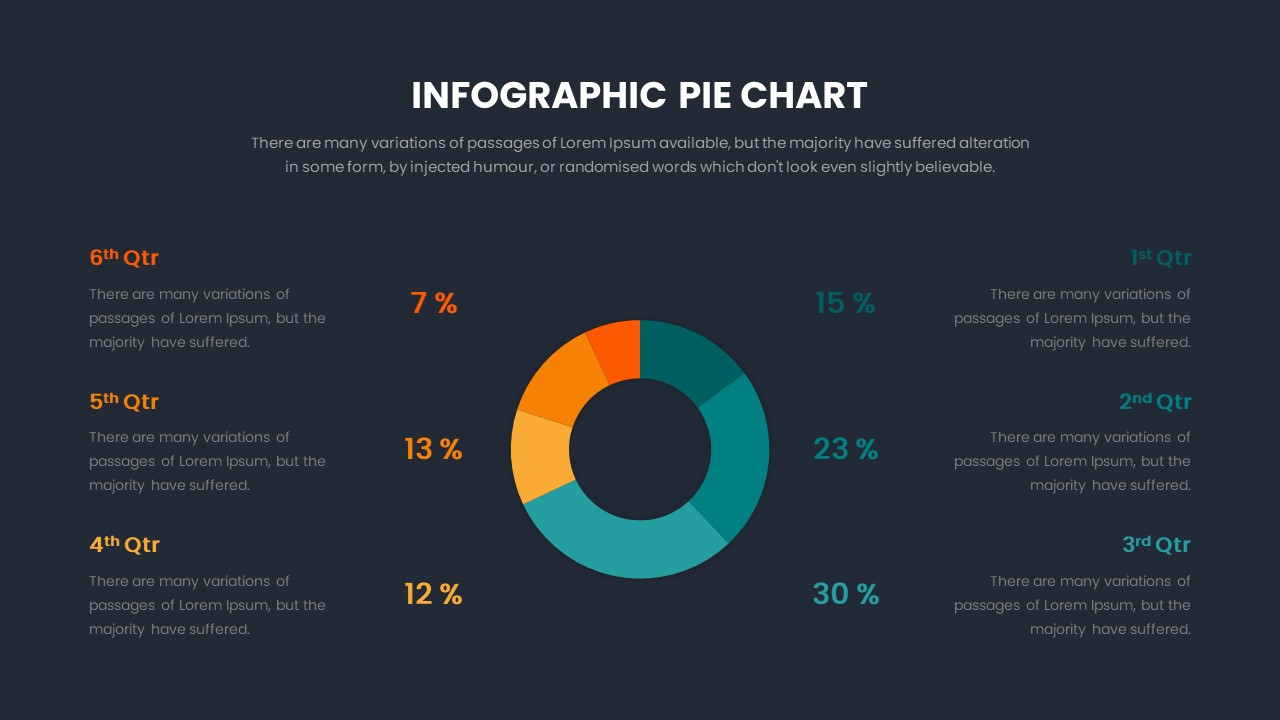
The Pie Chart Templates For PPT provides a clean and visually appealing way to represent data segments and percentages. This pie graph in PowerPoint template features a colorful, donut-style pie chart in the center, with corresponding data explanations on both sides, making it easy to present complex information in a digestible and organized format. The color-coded sections allow for quick differentiation of data points, while the minimalist design keeps the focus on the information without overwhelming your audience.
Ideal for business presentations, data-driven reports, and marketing analytics, this template allows you to clearly communicate financial breakdowns, survey results, market shares, or performance reviews. Each section of the pie chart is labeled with a percentage, and the corresponding text blocks offer space for further explanation, ensuring that your audience can fully grasp the key insights of your data.
Fully customizable in PowerPoint and Google Slides, the template allows you to edit the colors, numbers, and text to match your presentation needs. Whether you’re preparing a corporate report, client presentation, or educational material, this infographic template ensures your data is presented in a professional and visually engaging way.
See more

Aspect Ratio
16:9Item ID
SKT00755
FAQs
You May Also Like These Presentation Templates


- Free
- Free

- Free


- Free
- Free
- Free
- Free
- Free