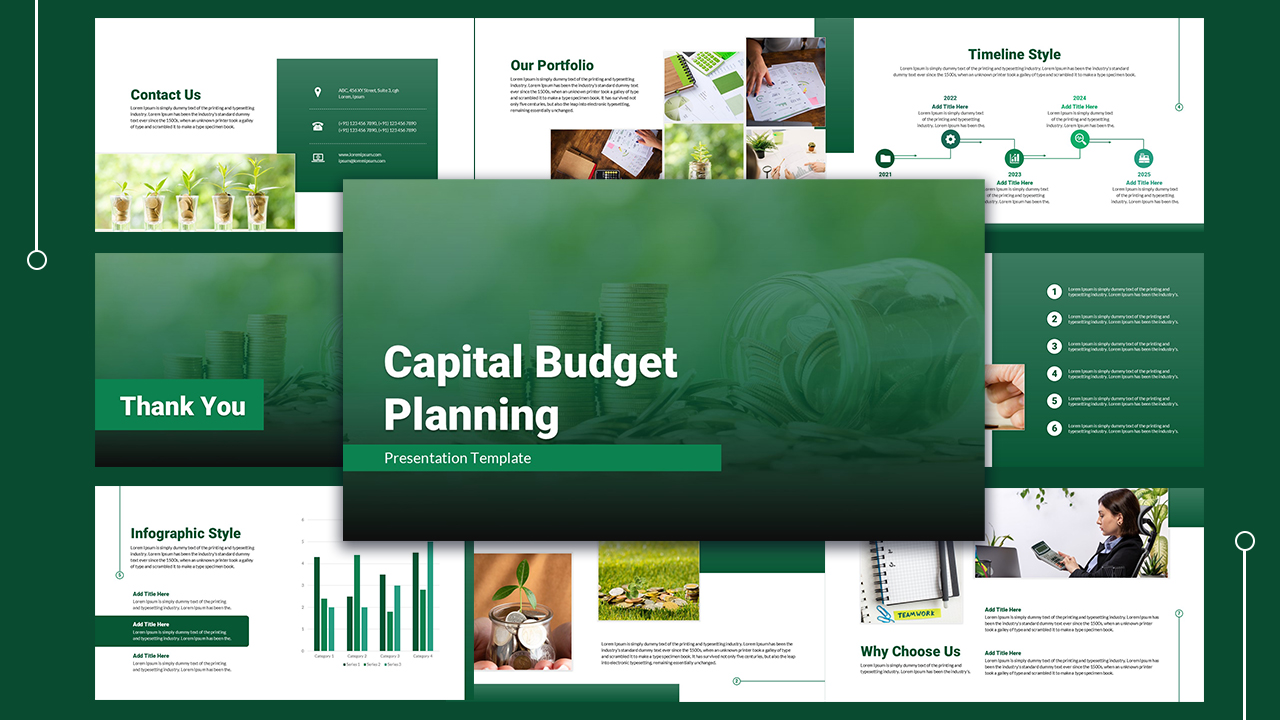
Investment Dashboard Template for PowerPoint & Google Slides

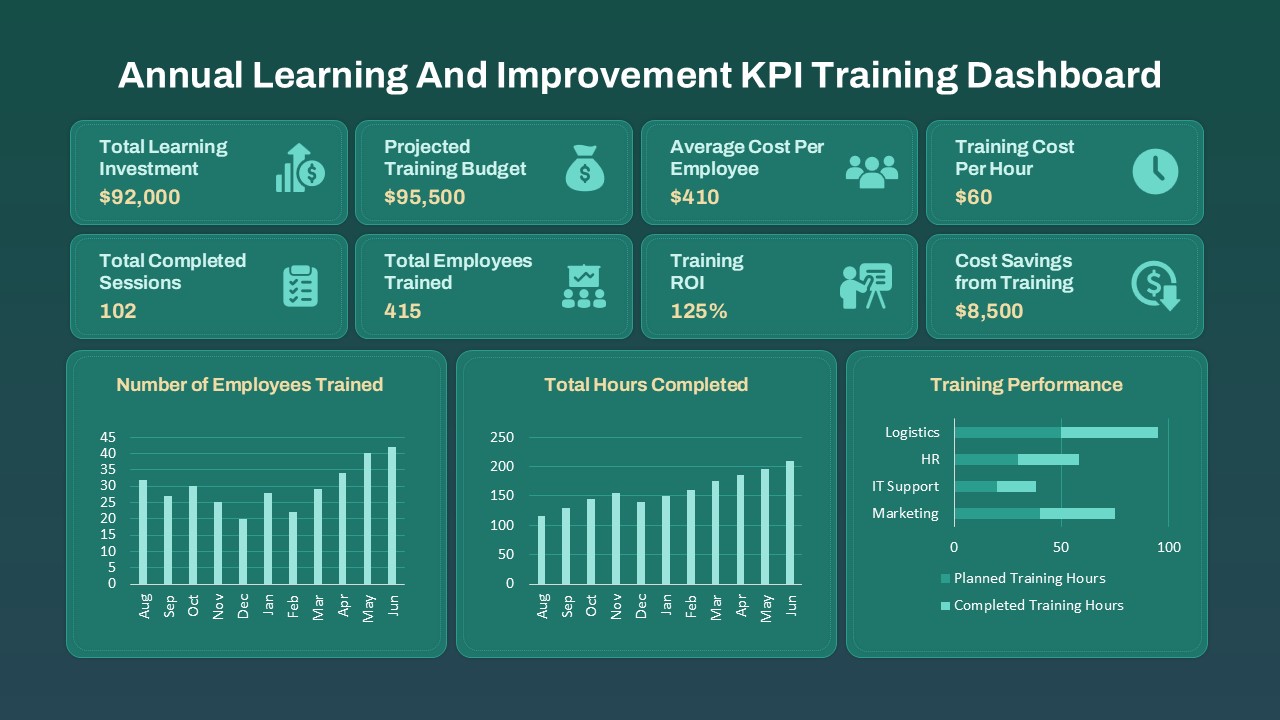
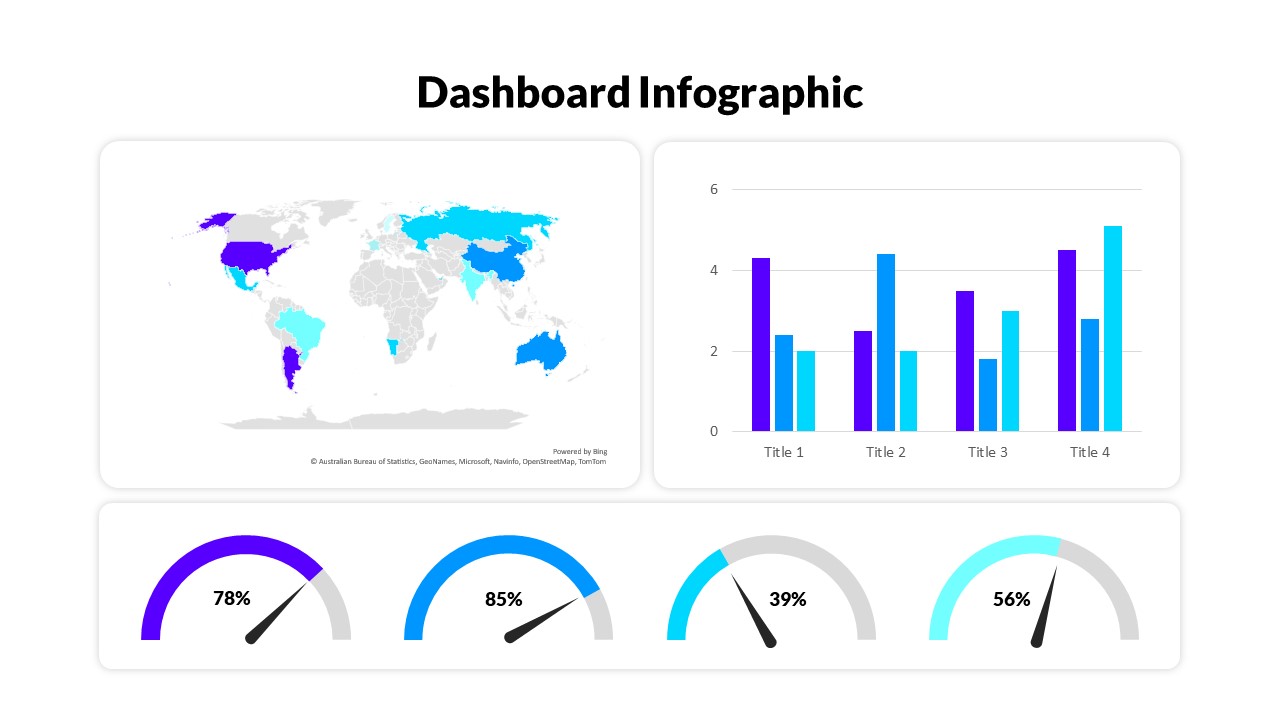
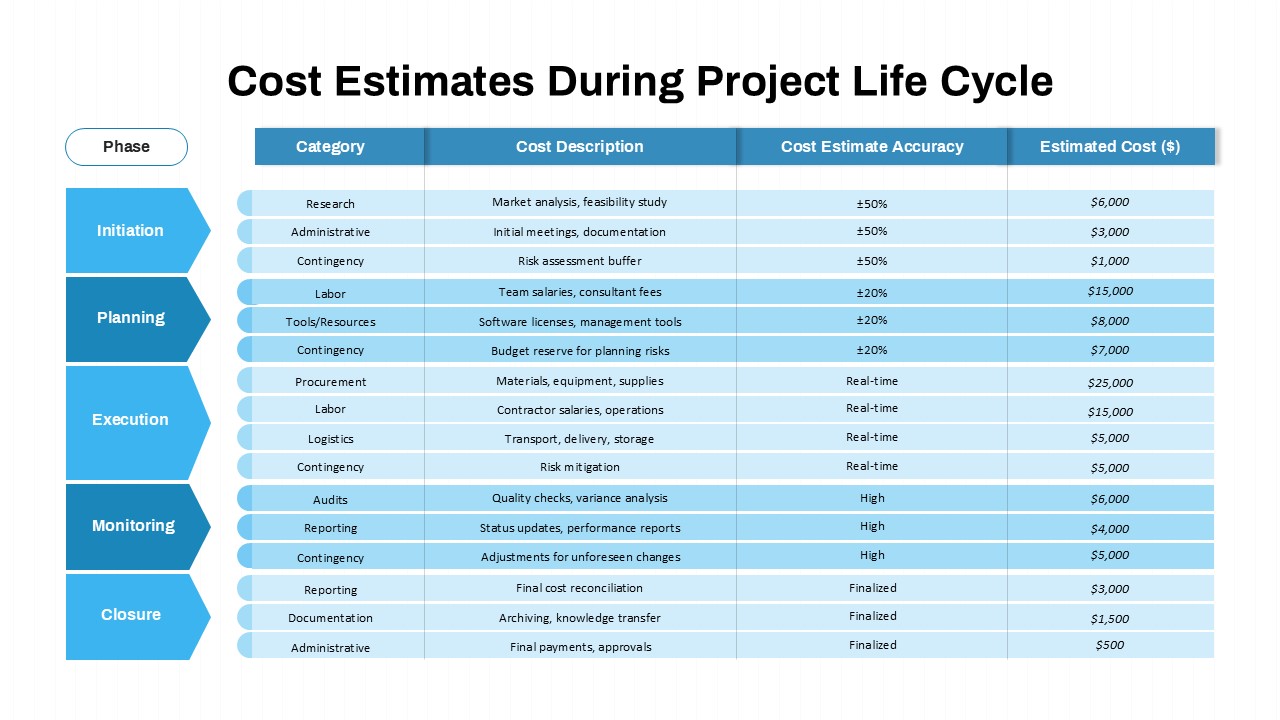
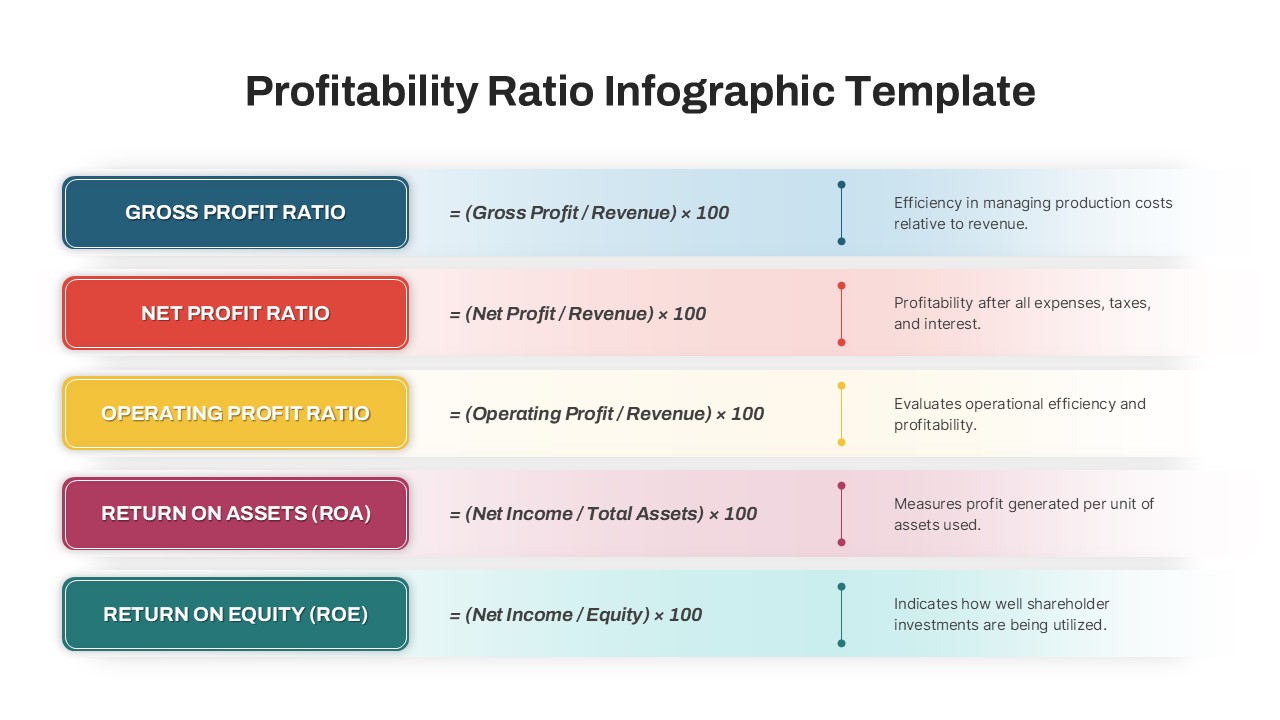
The Investment Dashboard Template is a visually appealing and data-driven tool designed for financial analysts, investors, and financial advisors. This template provides a comprehensive snapshot of an investment portfolio, displaying key financial metrics such as Total Investment Value, Total Returns, Risk Level Indicator, and ROI Percentage.
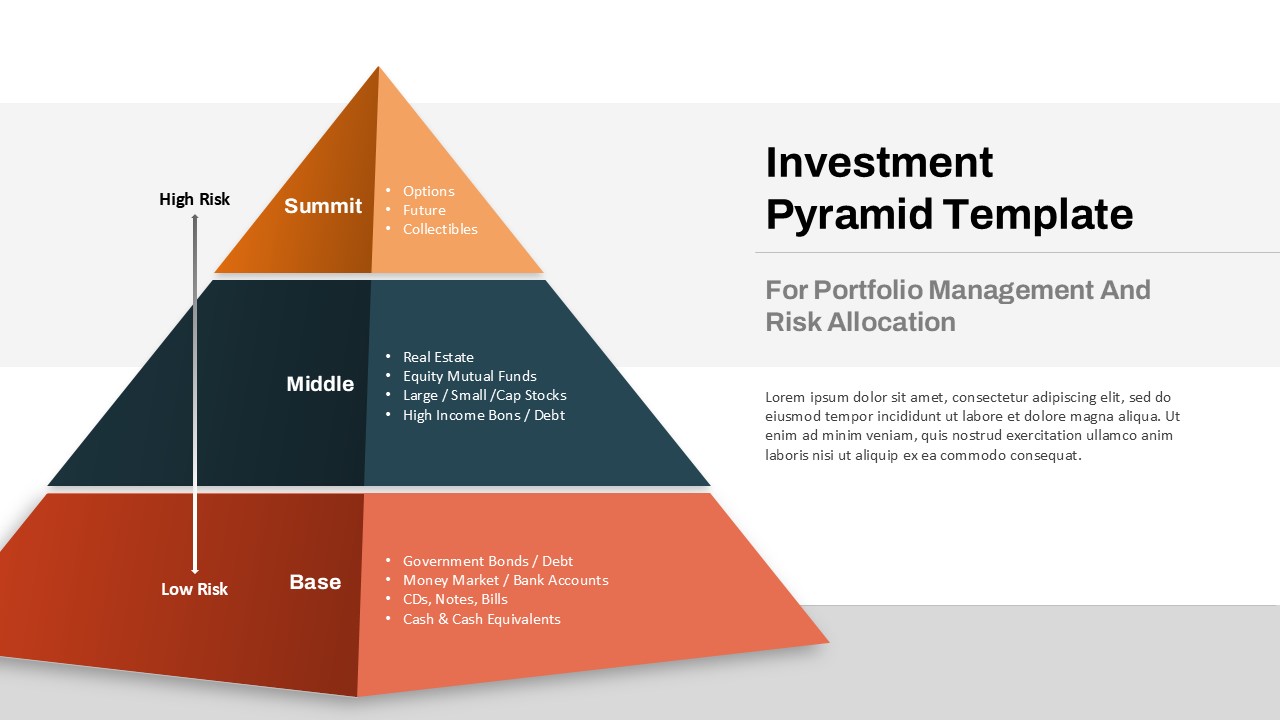
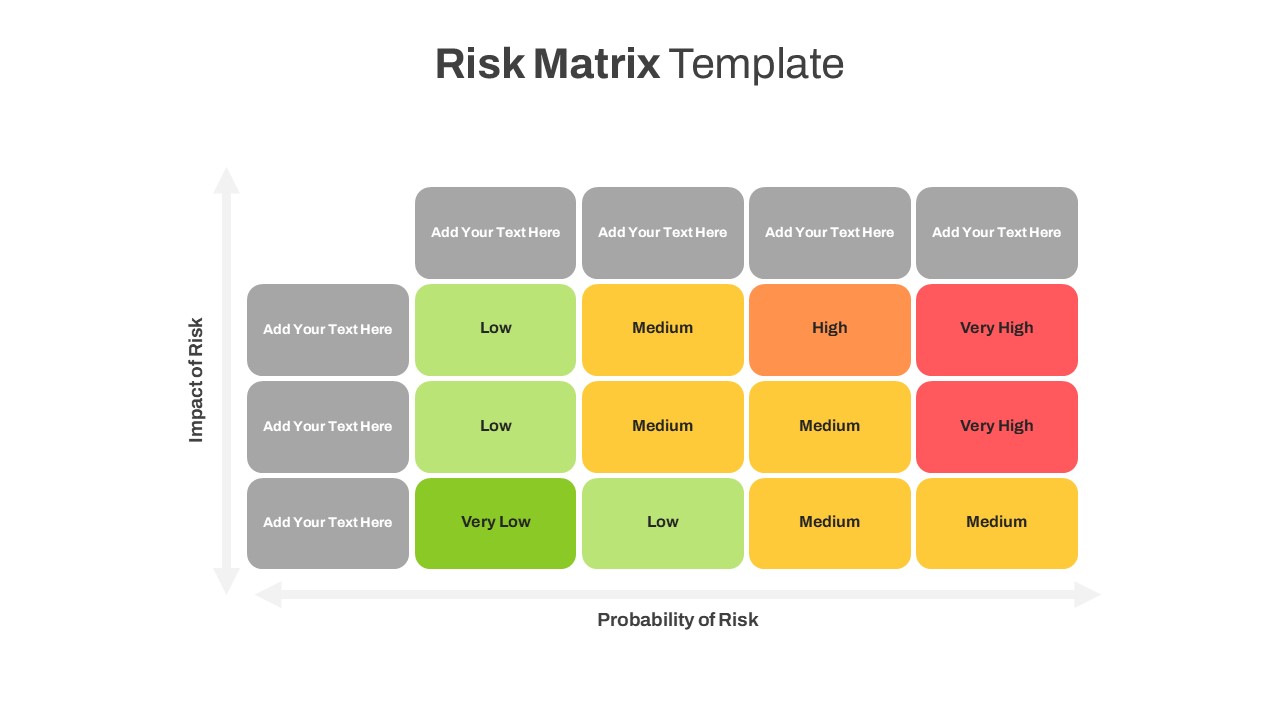
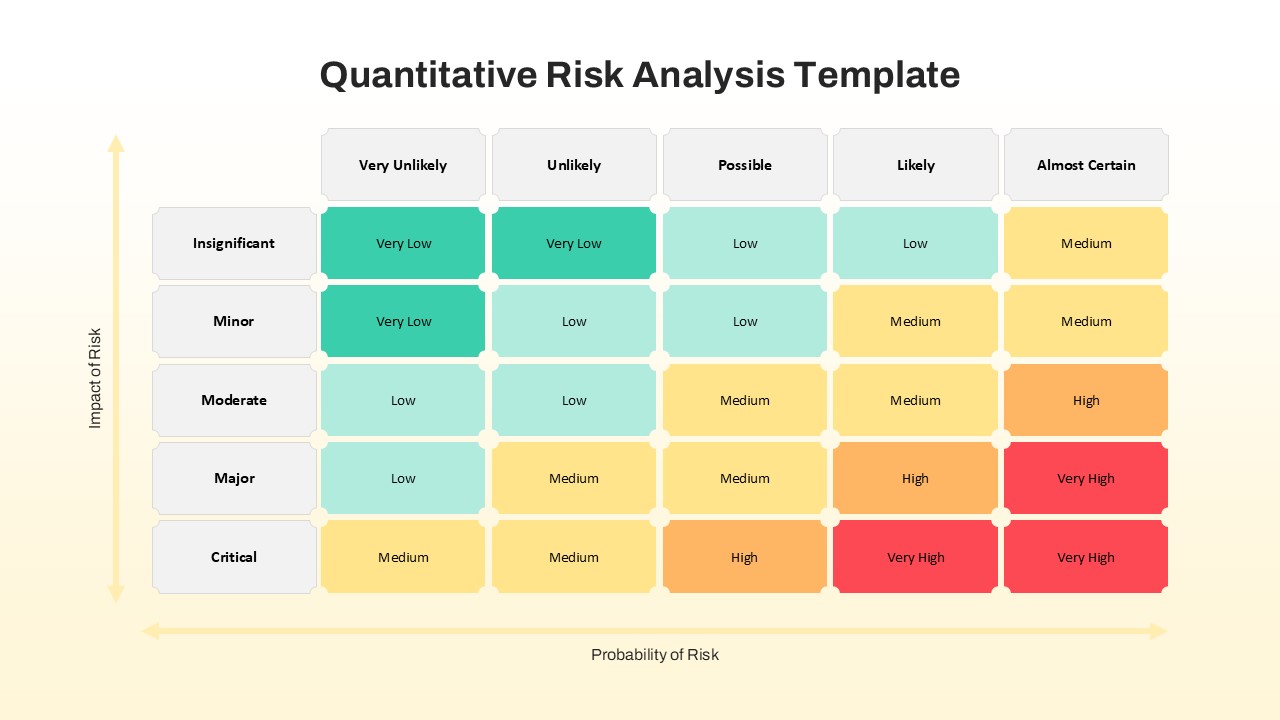
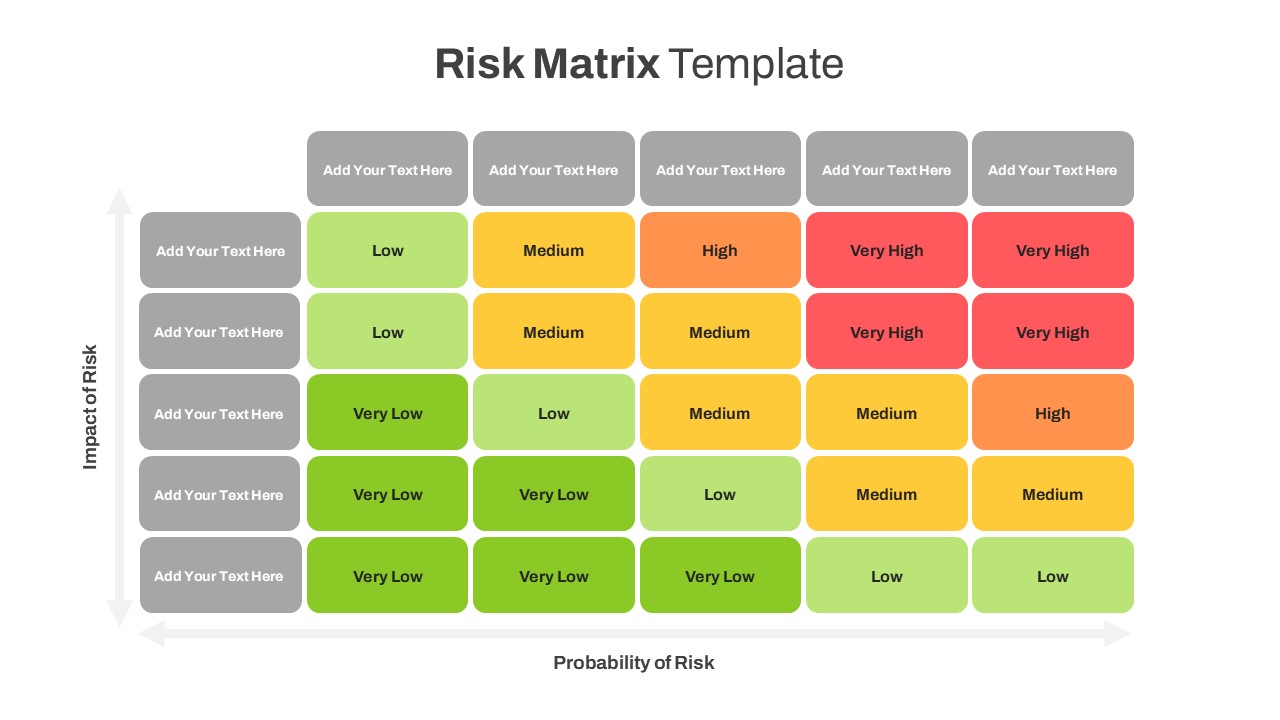
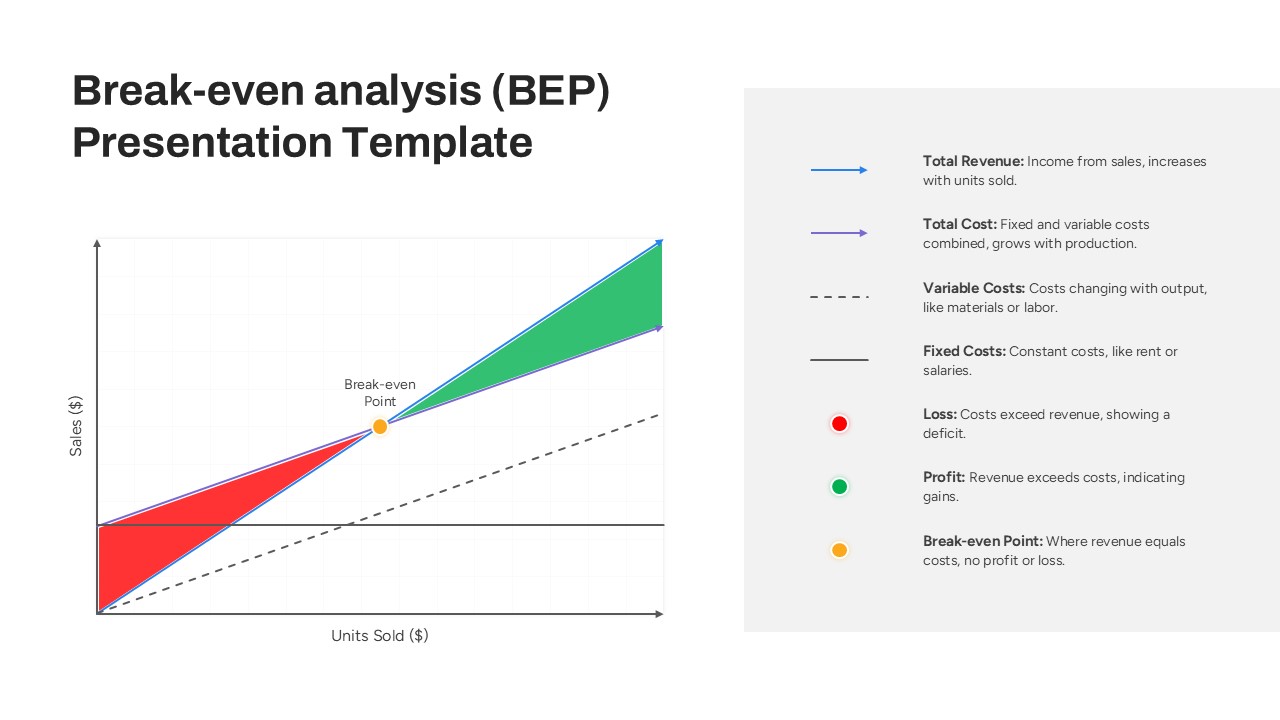
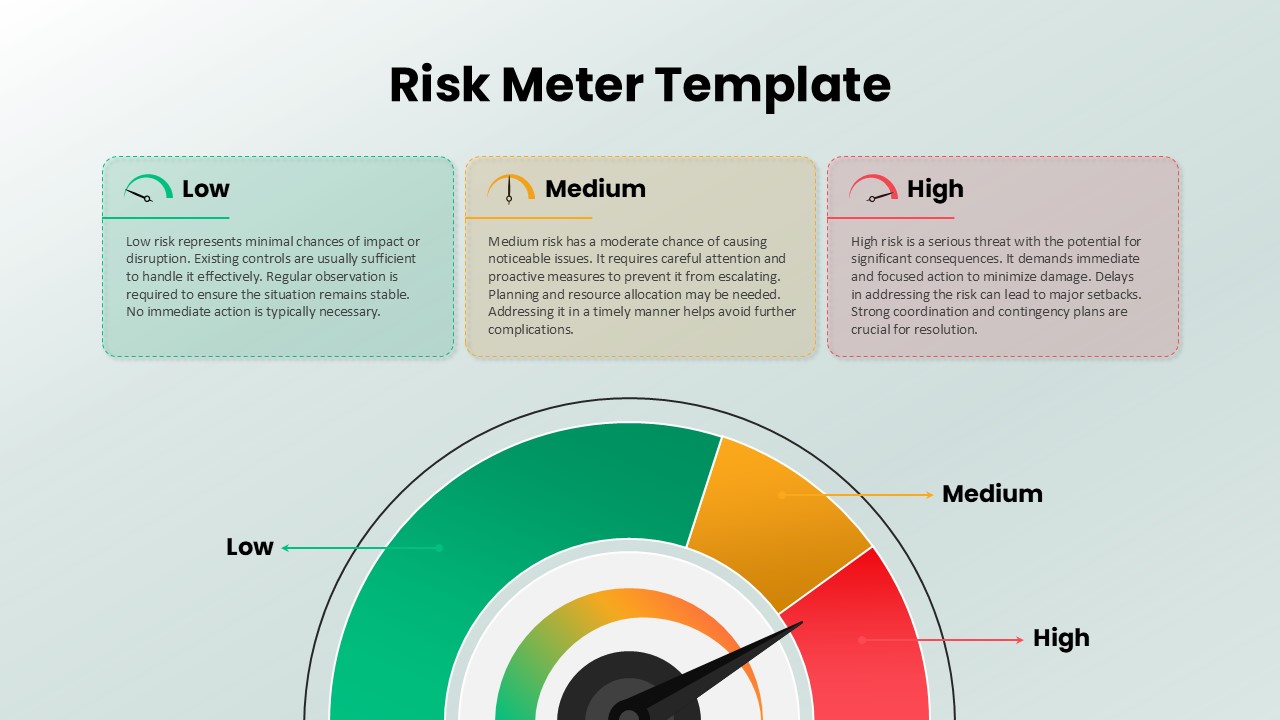
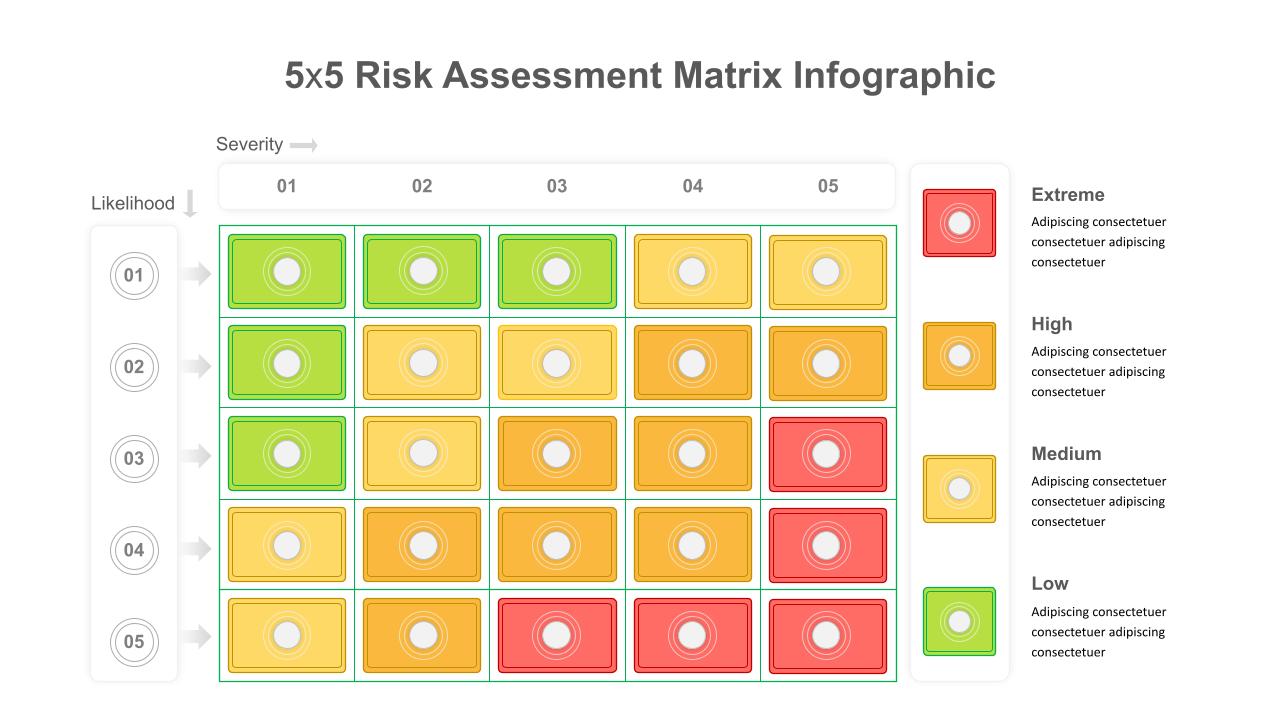
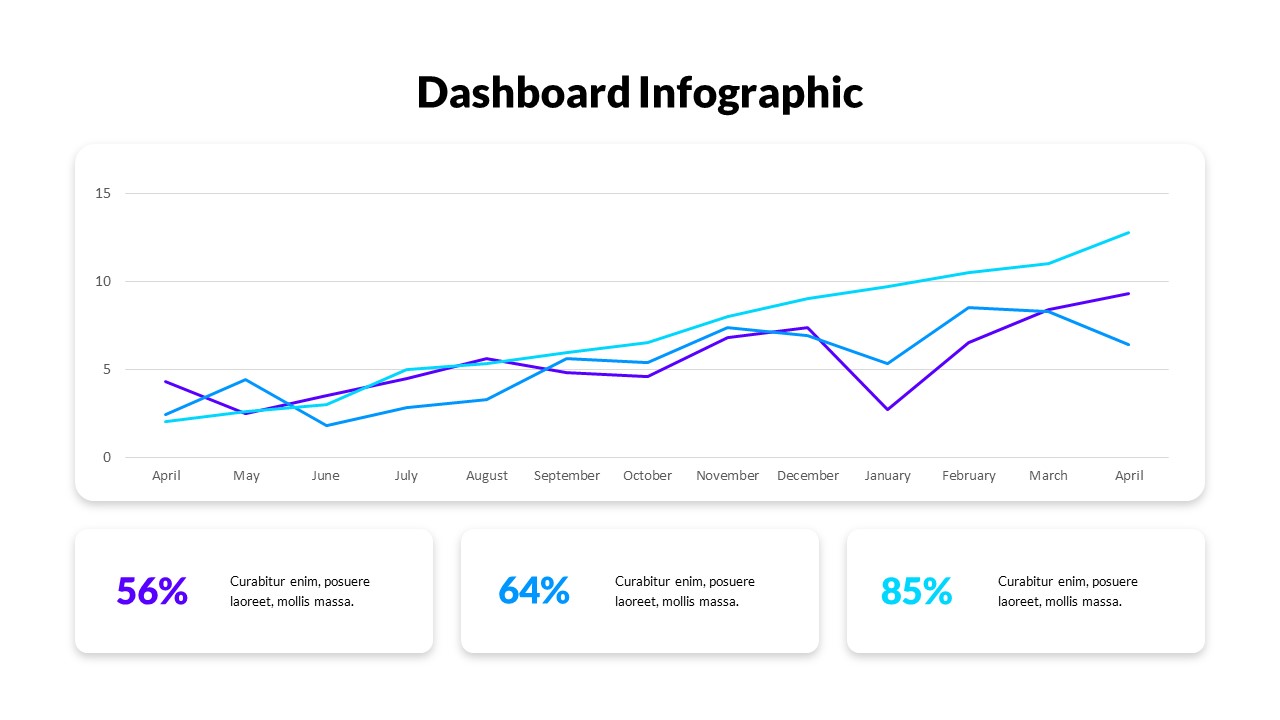
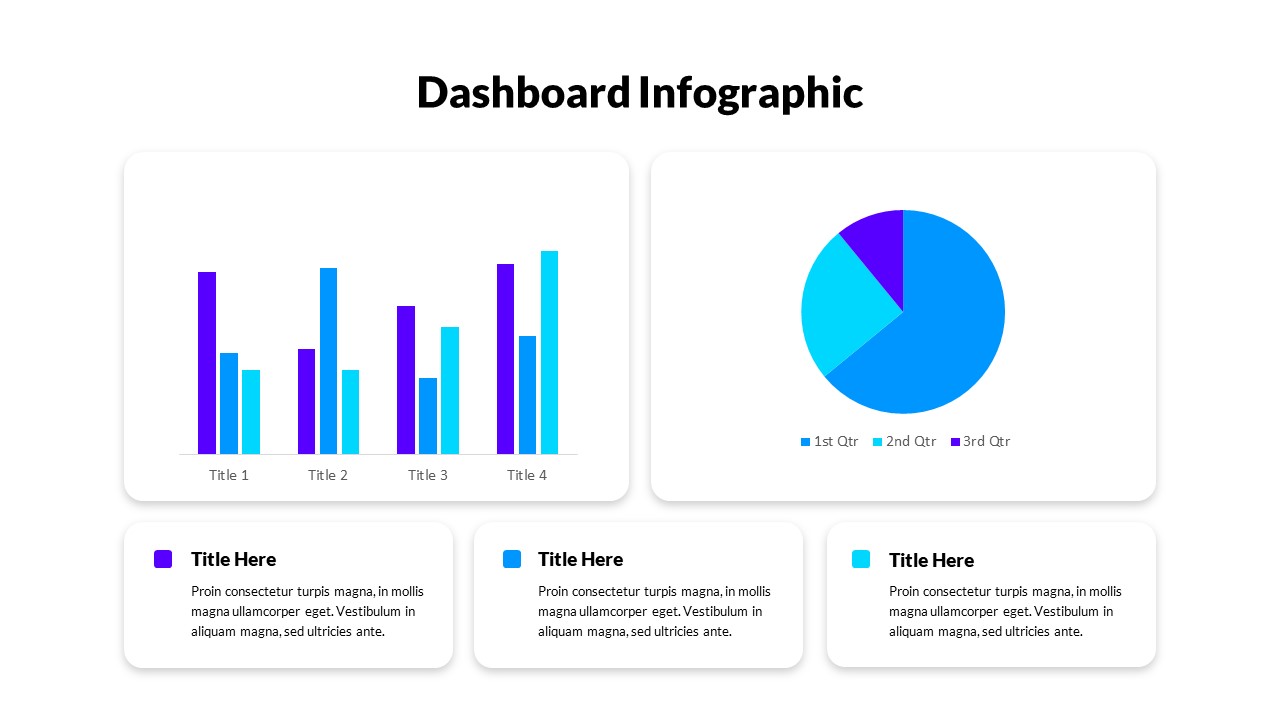
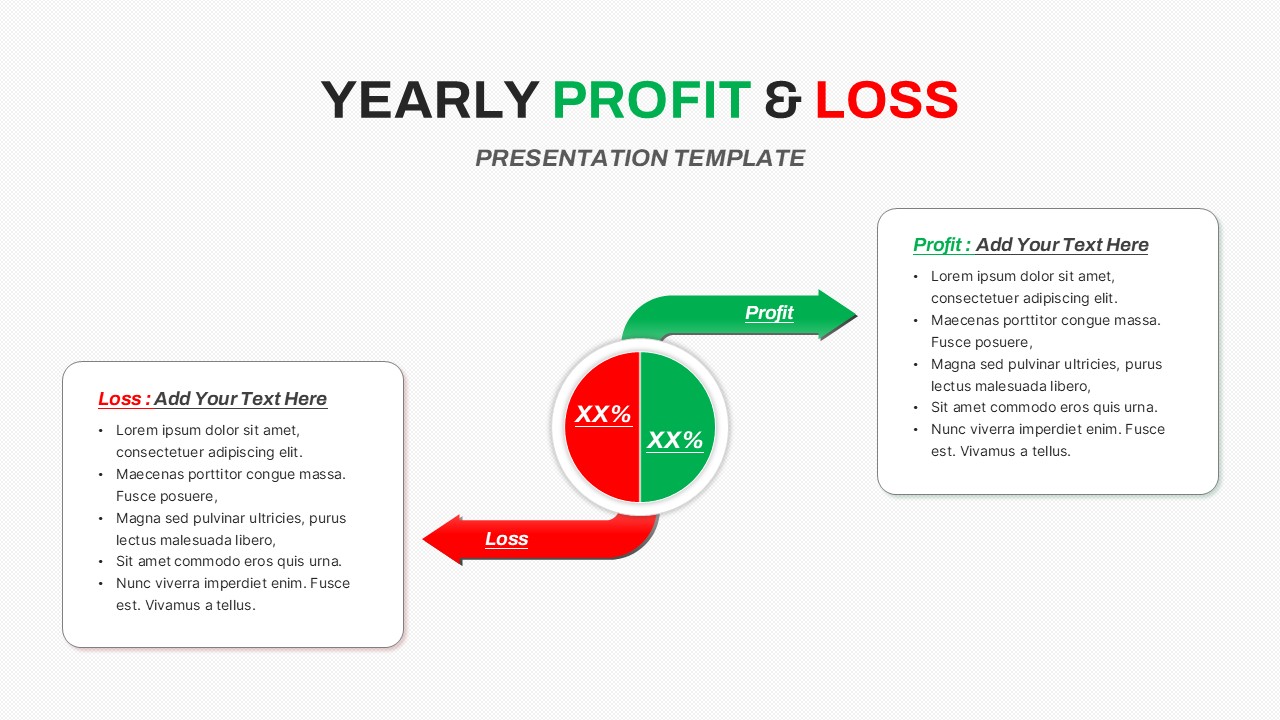
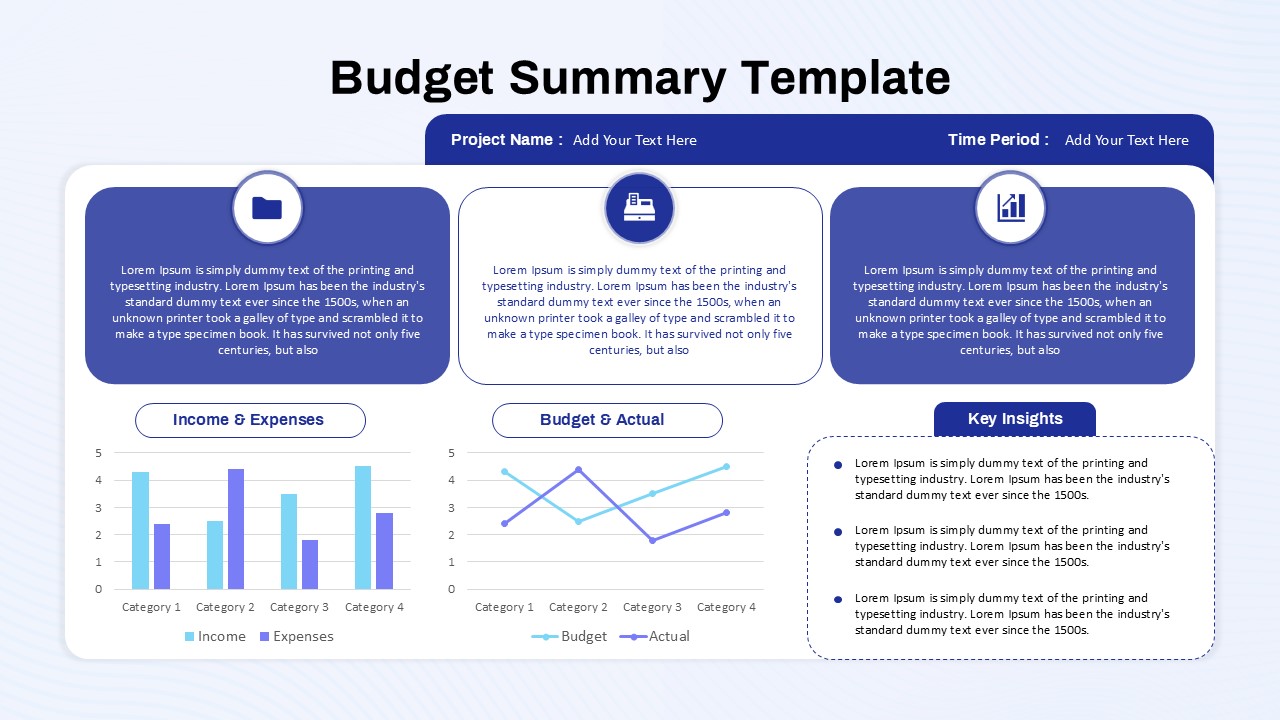
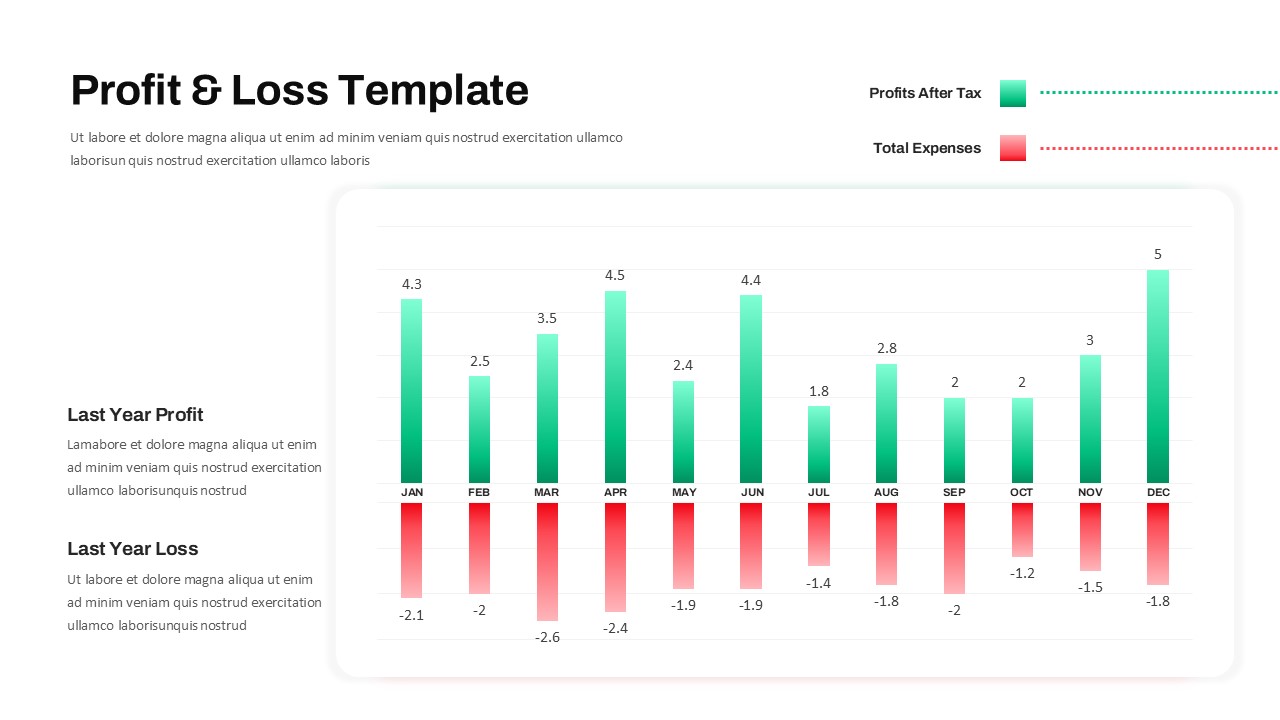
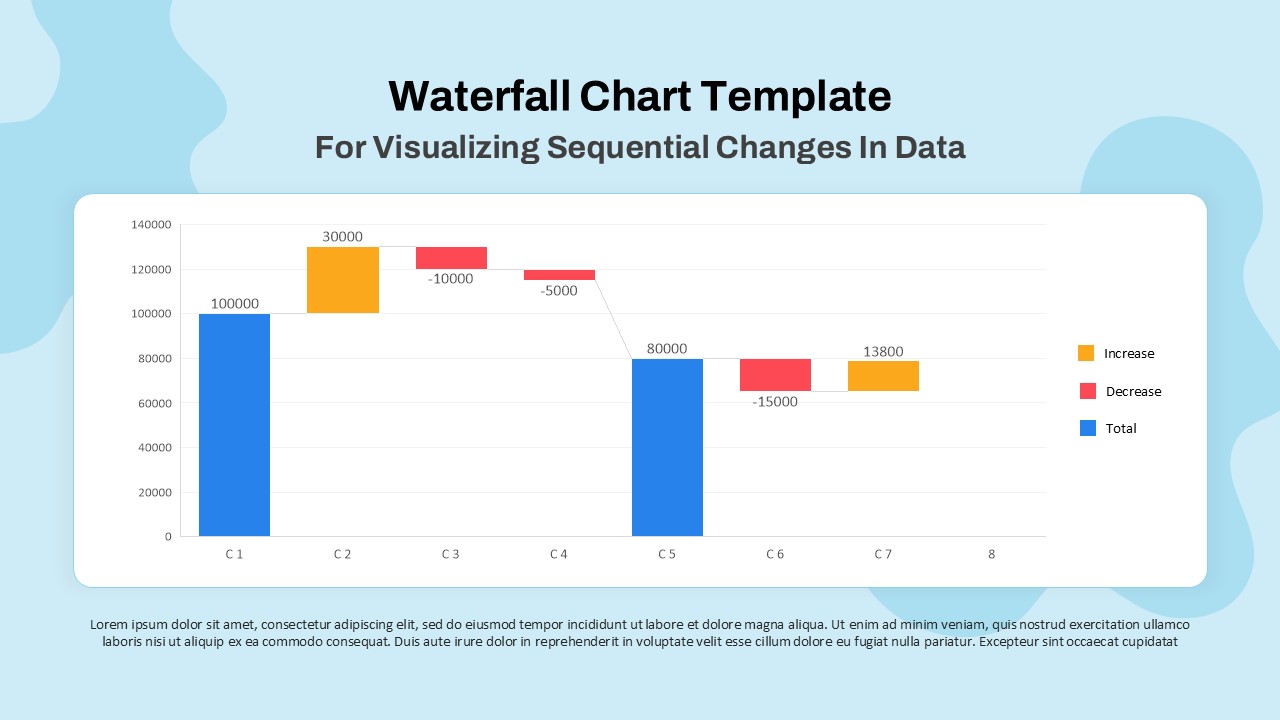
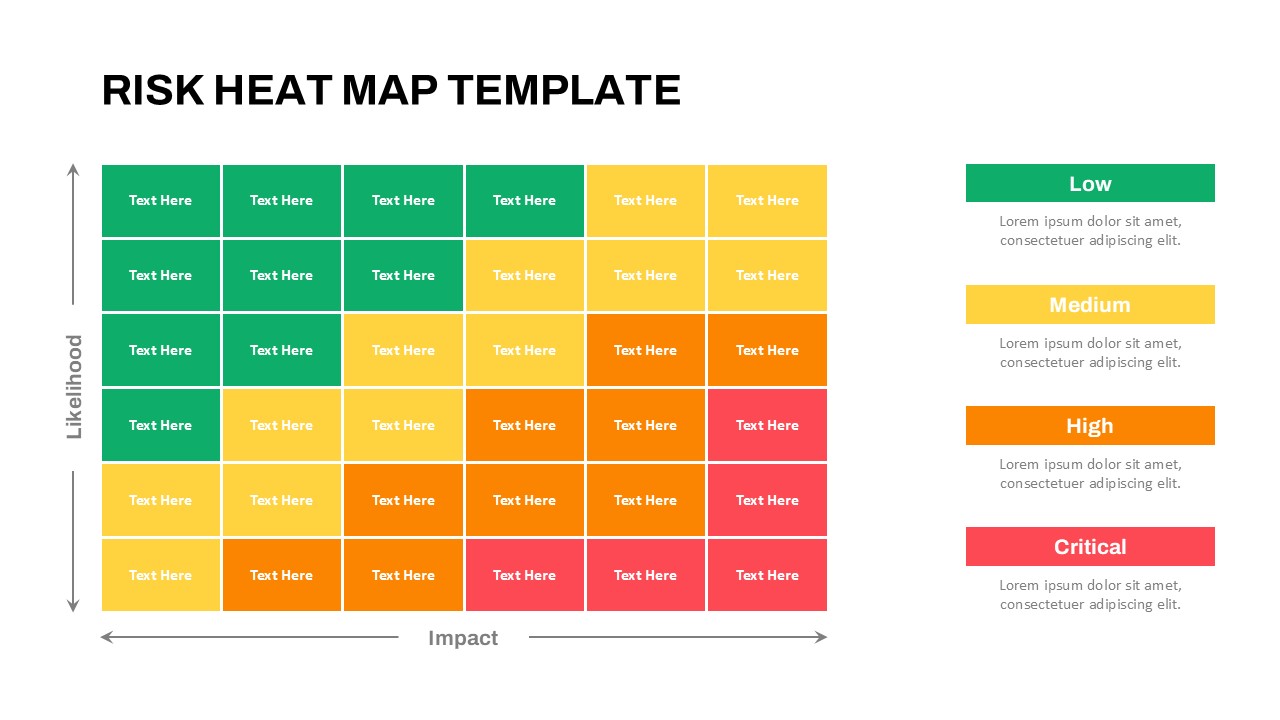
With clear visual aids like Pie Charts for investment allocation, Line Graphs for growth over time, and Bar Graphs for sector diversification, this template makes it easy to interpret financial data at a glance. Additionally, the Risk vs. Reward Analysis section highlights asset class risk levels, while the Projected Growth Rate offers future performance insights.
This dashboard is ideal for financial planning presentations, investment analysis reports, client portfolio reviews, and business strategy meetings. It is fully customizable in PowerPoint and Google Slides, enabling users to adjust the visuals, input personalized data, and tailor the presentation to their needs.
Whether you’re managing a personal portfolio or presenting investment performance to stakeholders, the Investment Dashboard Template offers clarity and professionalism to your financial presentations.
See more

Aspect Ratio
16:9Item ID
SKT03389
Features of this template
Other User Cases of the Template:
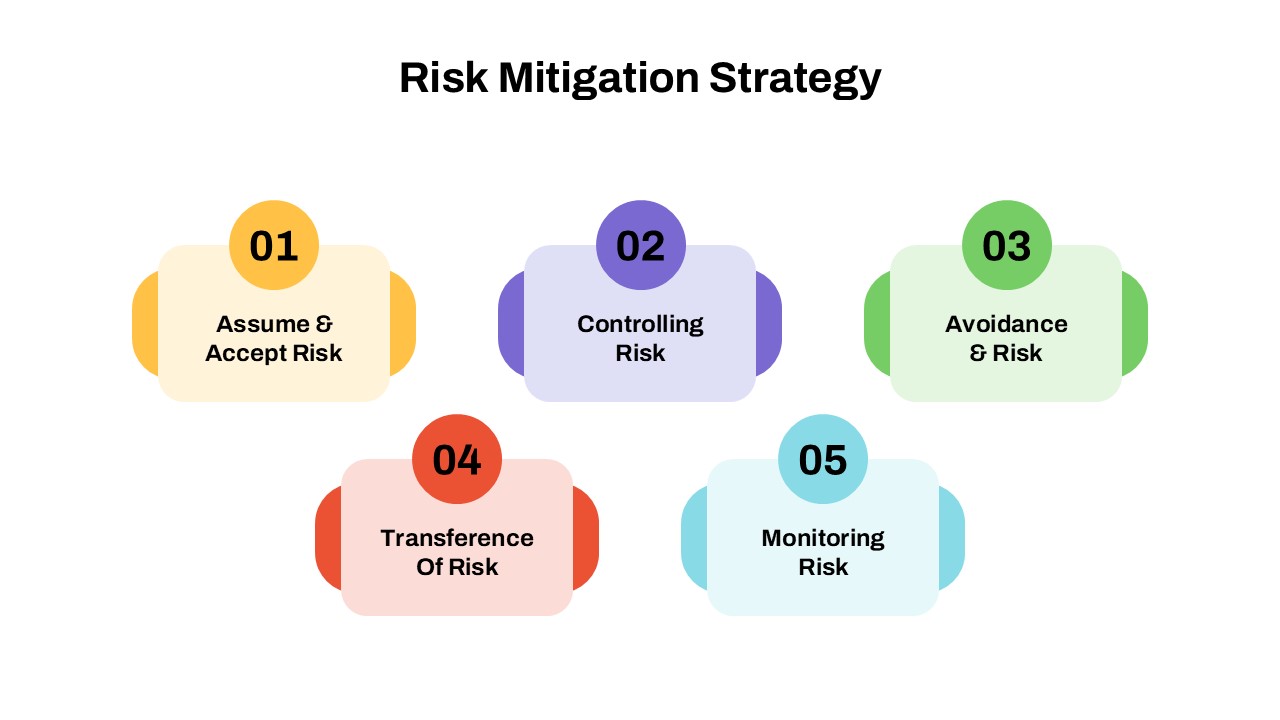
Financial analysis reports, portfolio performance presentations, investment review meetings, risk management analysis, financial planning workshops, investor pitch decks, market trend analysis, sector-specific investment tracking, client financial consultations, budget and forecast presentations
FAQs
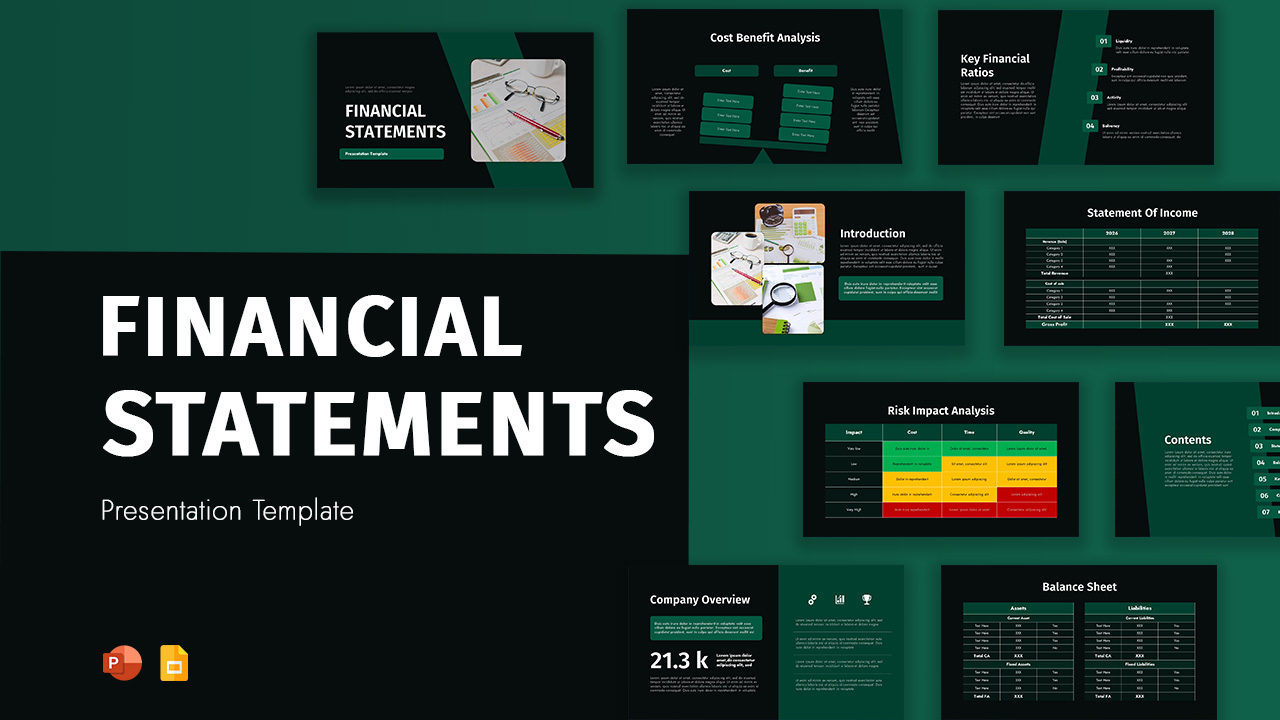
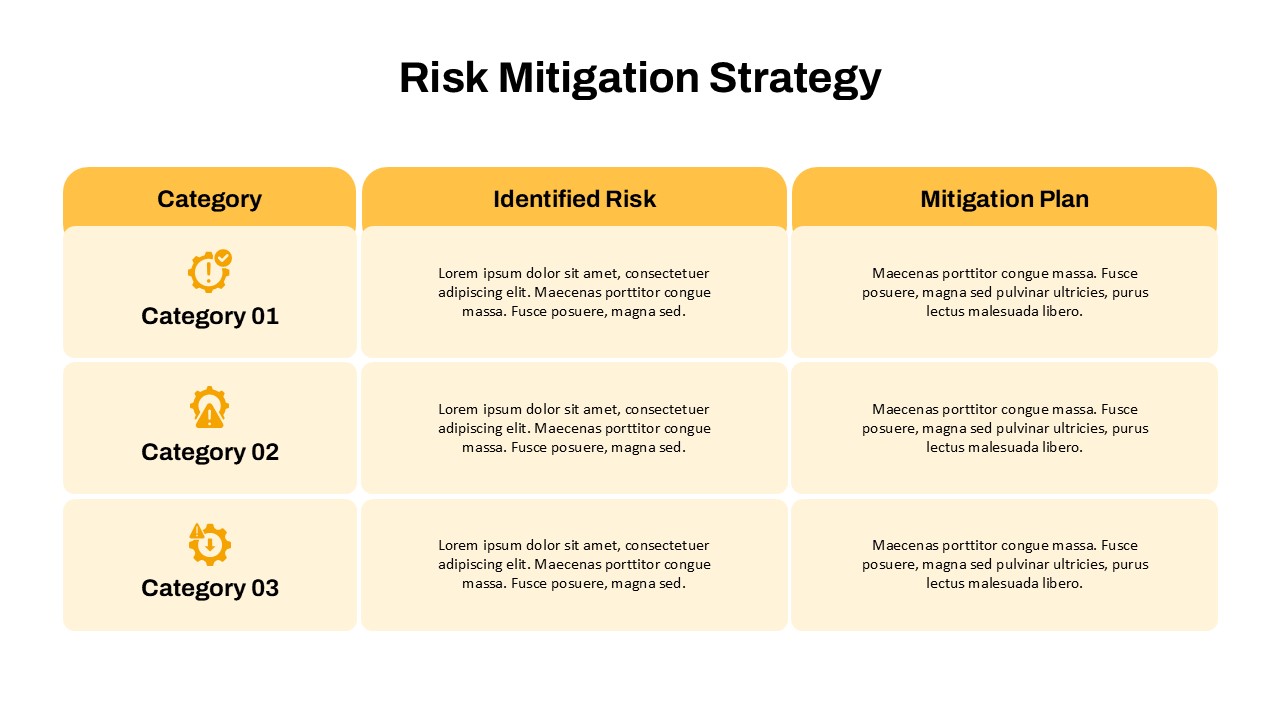
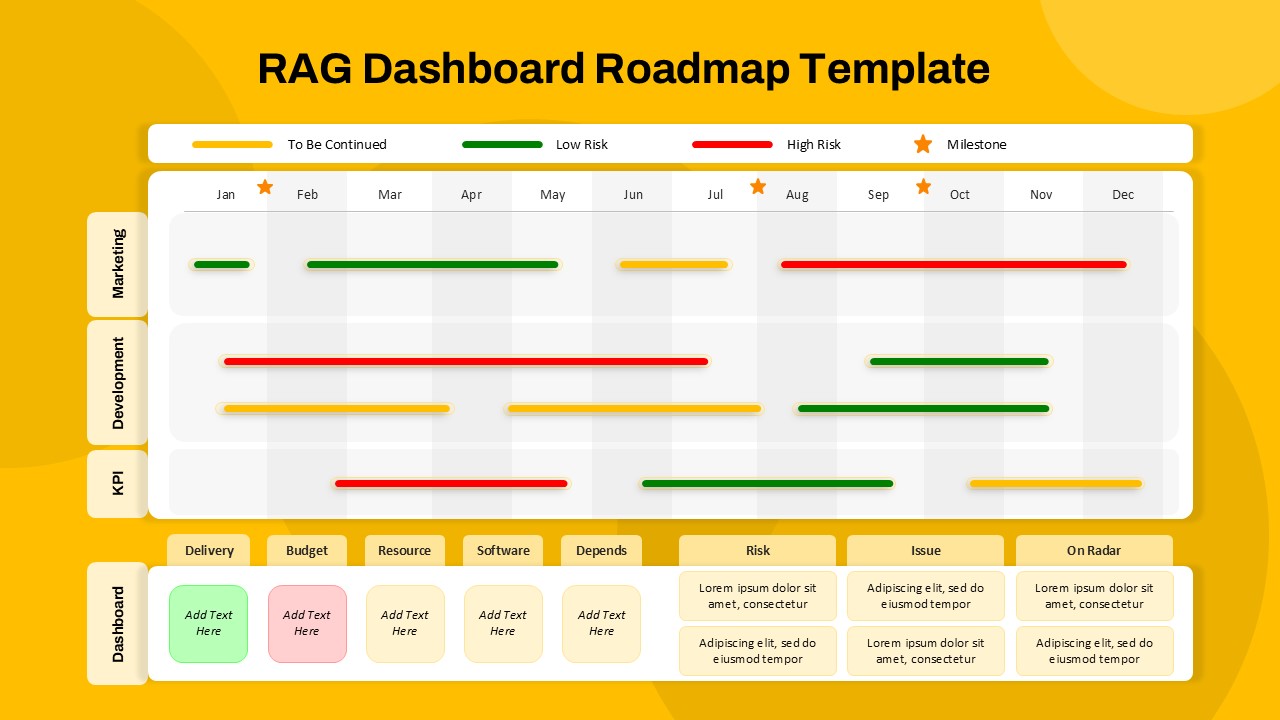
You May Also Like These Presentation Templates


- Free
- Free

- Free
- Free

- Free

- Free
- Free
- Free