Free KPI Dashboard PowerPoint Template

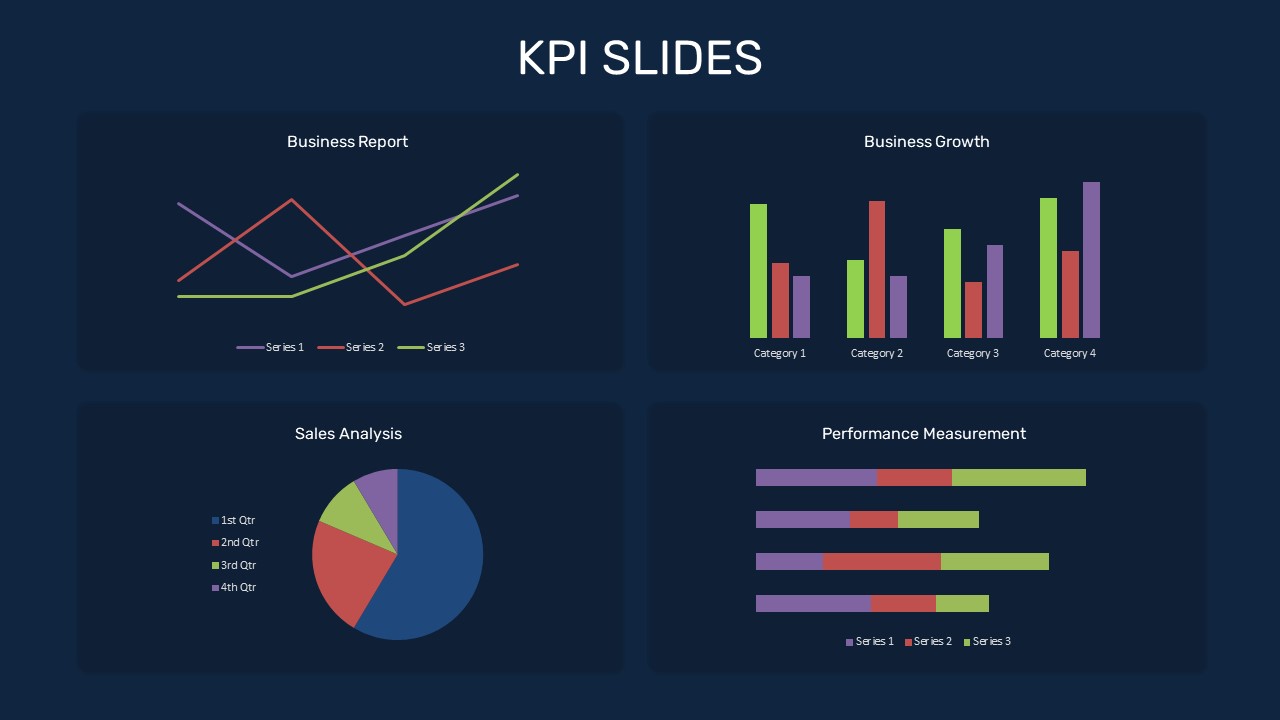
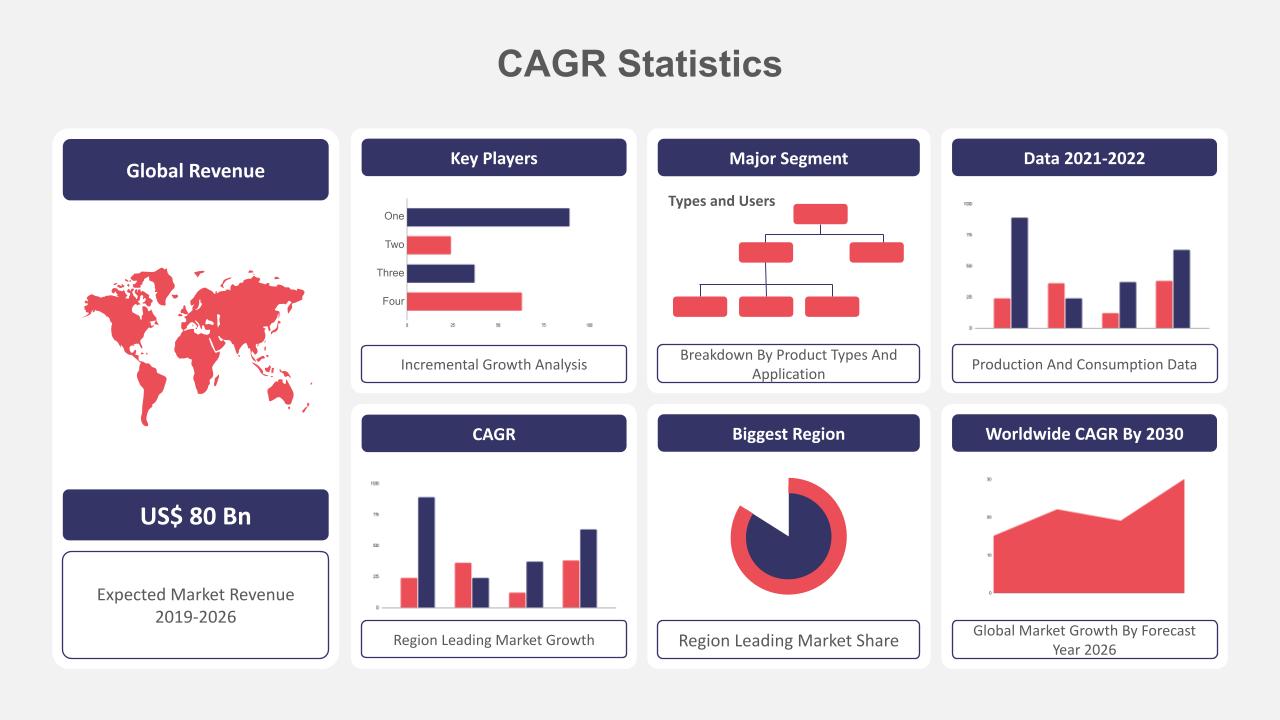
The KPI Dashboard PowerPoint Template is a powerful tool for tracking key performance indicators across multiple dimensions of your business. Featuring a clean and modern layout with a light blue background, this key performance indicators PowerPoint presentation
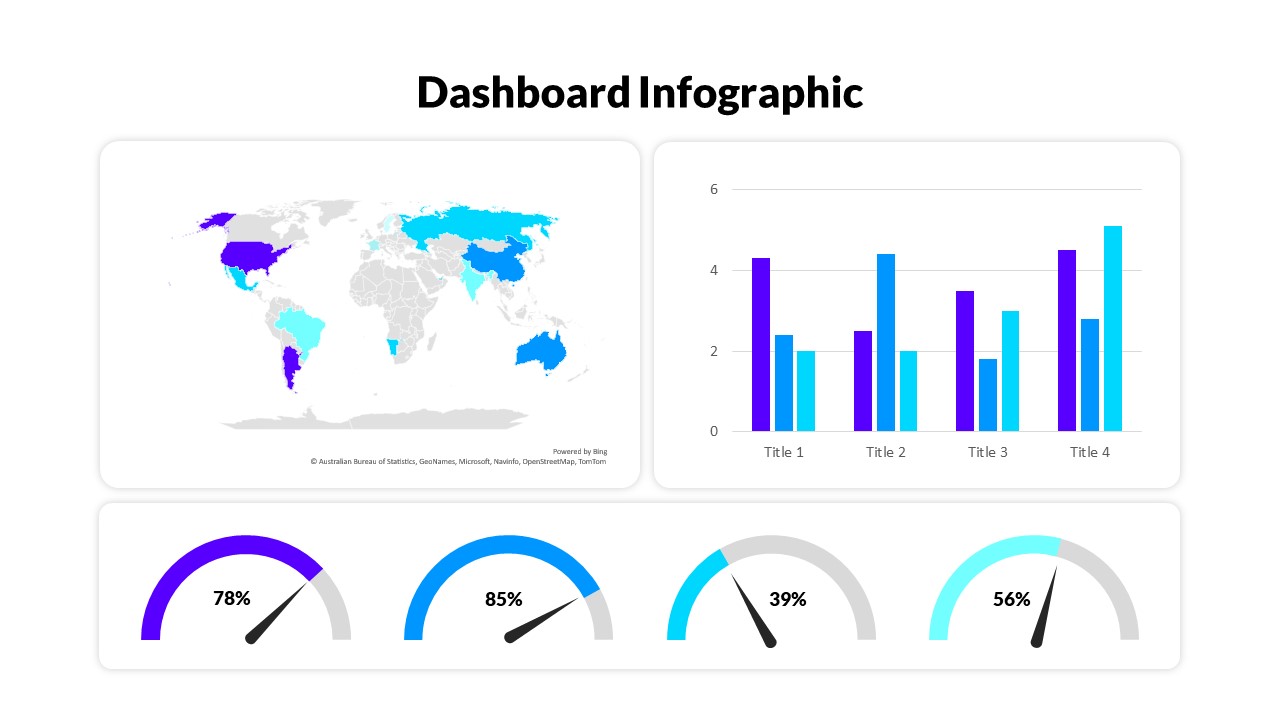
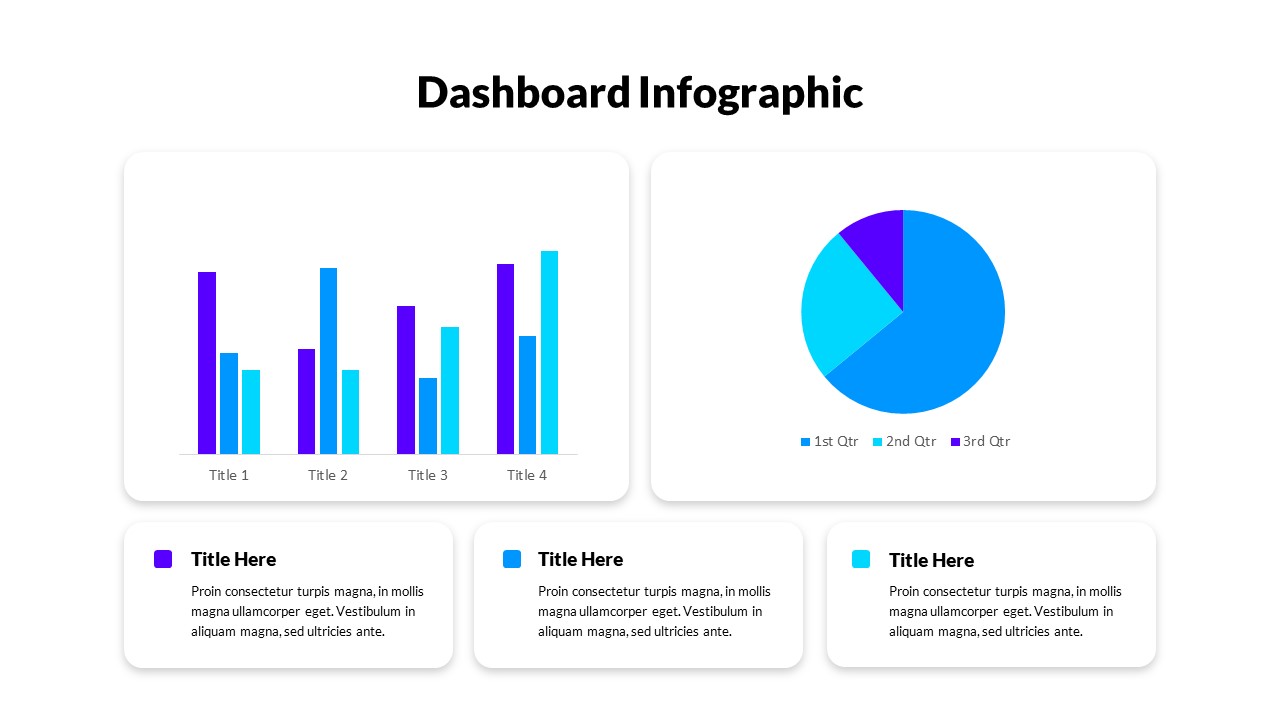
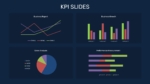
template is designed to make your data easily understandable and visually engaging. It provides four distinct sections: Business Report, Business Growth, Sales Analysis, and Performance Measurement. Each section is represented using different types of charts—line charts, bar charts, pie charts, and horizontal bar charts—offering a comprehensive view of critical metrics at a glance.
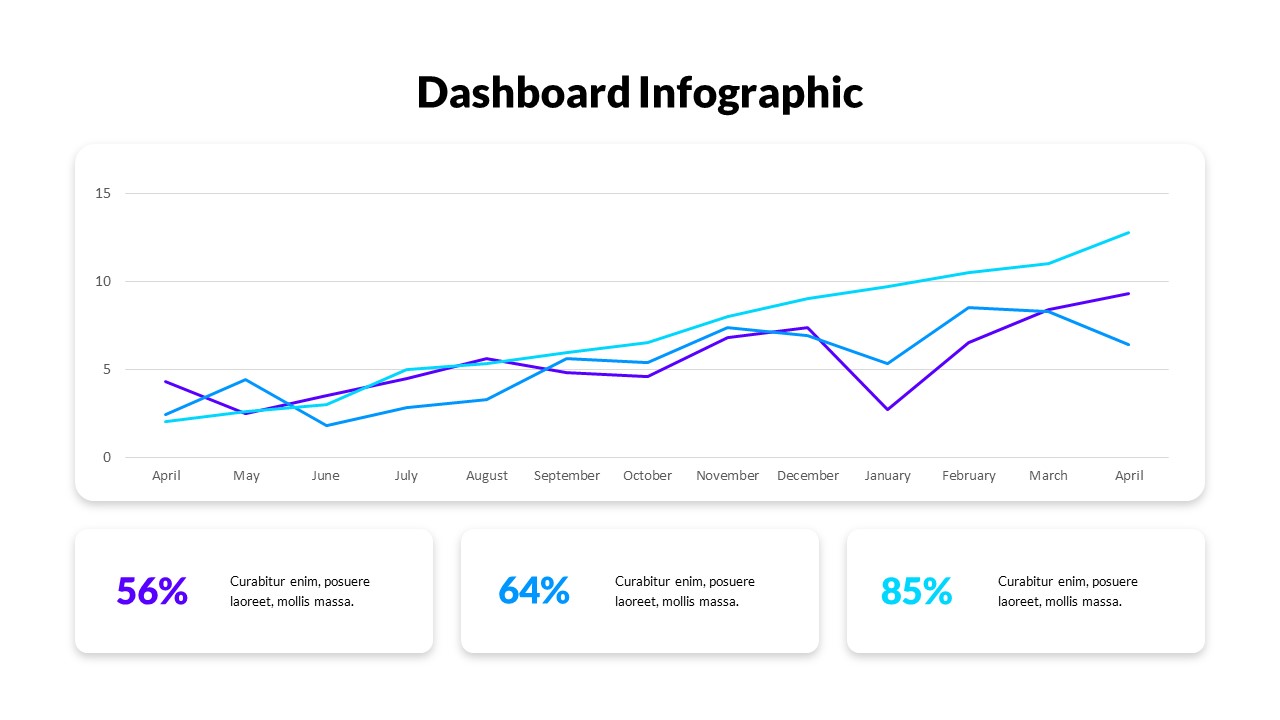
The “Business Report” section utilizes a line chart to display trends over time, which is useful for tracking progress and forecasting future growth. The “Business Growth” section includes a bar chart, making it easy to visualize comparisons across various categories or time periods, perfect for understanding how different business areas are performing. The “Sales Analysis” pie chart helps break down sales data by segment or quarter, providing a clear representation of contributions from different sources. Lastly, the “Performance Measurement” section uses a horizontal bar chart to effectively communicate performance metrics across multiple series, helping you monitor and benchmark progress efficiently. Get this KPI Dashboard PowerPoint Template Free Download.
Versatility:
- Available for both PowerPoint and Google Slides.
- Easy to Customize: Adaptable to suit the specific needs of different teams and projects.
See more

Aspect Ratio
16:9Item ID
SKT00708
FAQs
You May Also Like These Presentation Templates


- Free
- Free
- Free
- Free


- Free
- Free
- Free
- Free
- Free
- Free

- Free
- Free