KPI Infographics Dashboard PowerPoint Slide Template


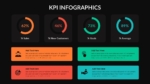
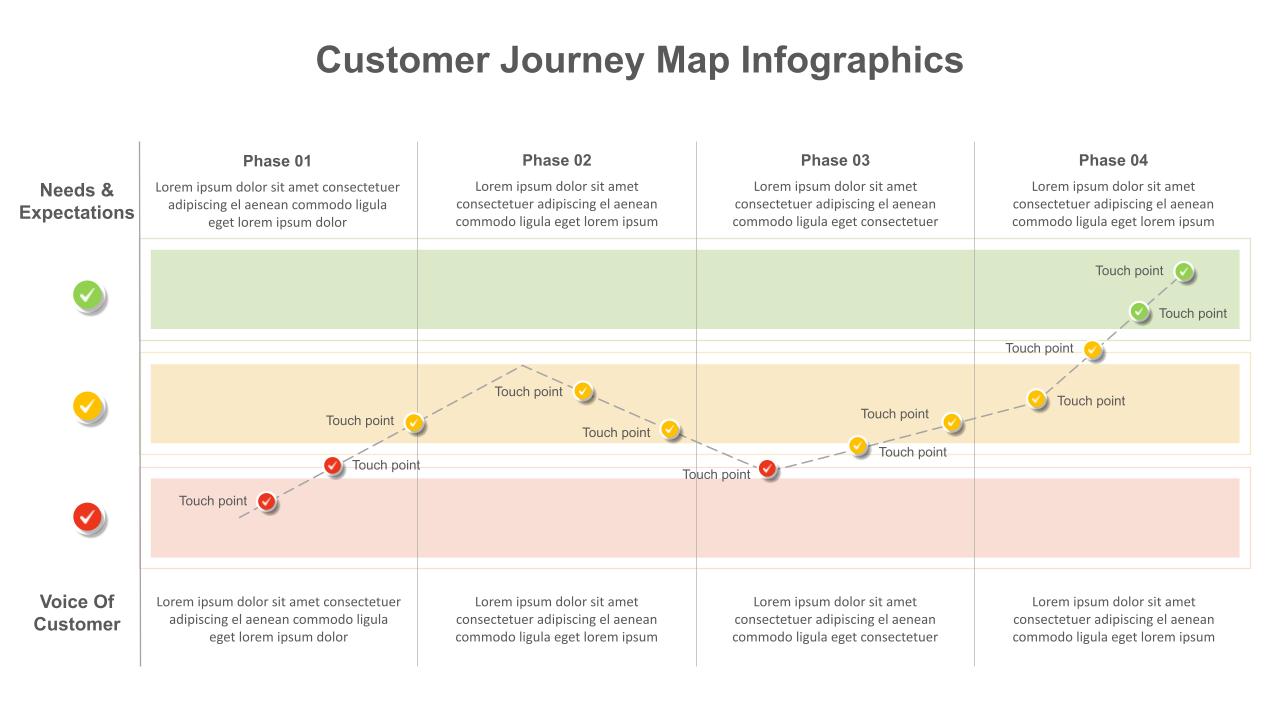
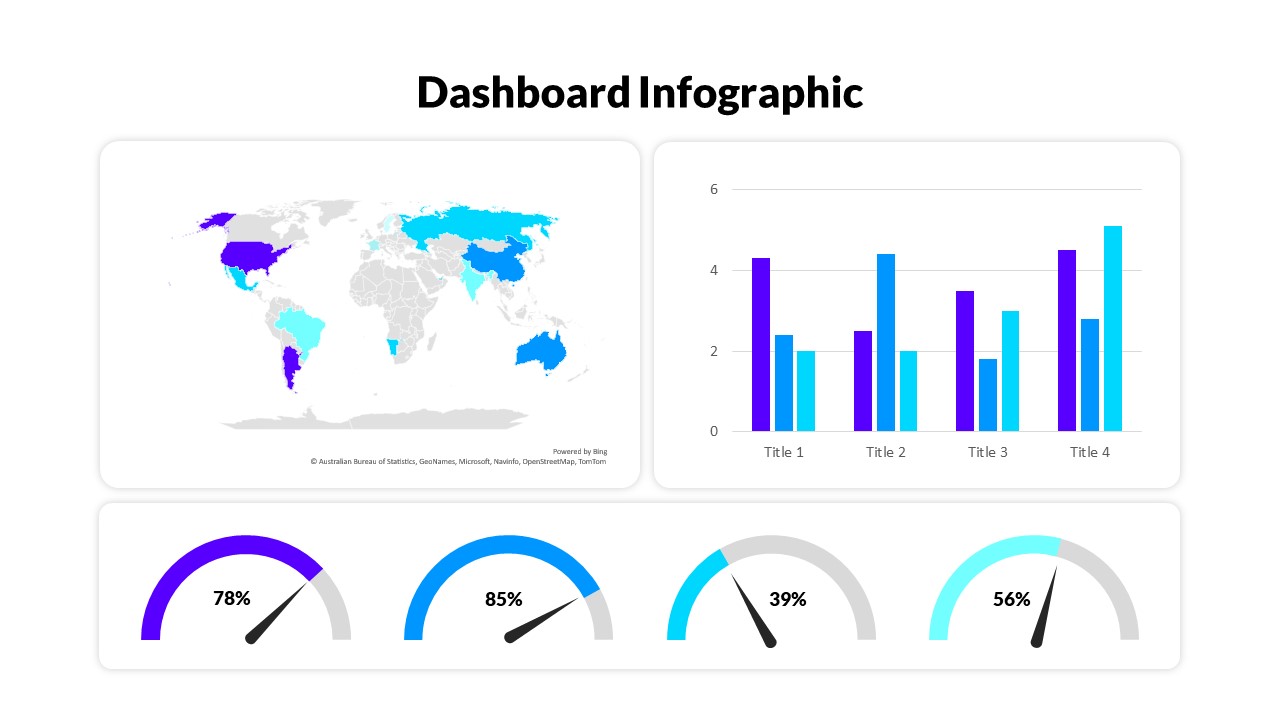
The KPI PowerPoint Slide Template is a versatile and visually impactful tool designed to present your business performance metrics in a clear, concise, and engaging manner. This KPI PPT template combines key performance indicators with intuitive infographic elements, making complex data more digestible and helping to drive impactful storytelling in your presentations. Featuring vibrant colors and clean layouts, it’s perfect for visually highlighting your key metrics such as sales, customer acquisition, and goal progress.
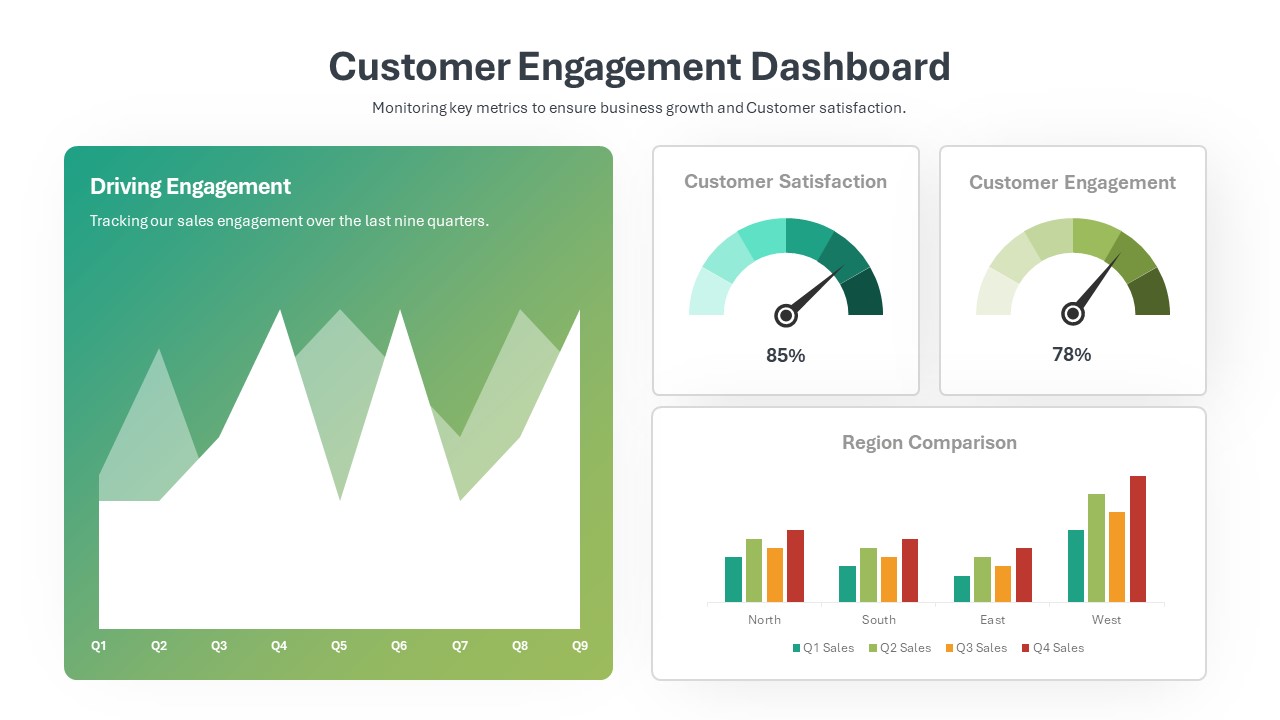
The top half of the template showcases four donut charts, each presenting critical KPIs, such as sales percentage, new customer rate, goal achievement, and average performance. The use of contrasting colors provides an at-a-glance view of each metric, making it easy for audiences to grasp the information quickly. Each percentage is bolded and prominently displayed to emphasize achievements or areas needing improvement. This template is ideal for business analysts, sales teams, project managers, or executives looking to present data-driven insights in a visually compelling format. Download the KPI PowerPoint slide now!
See more

Aspect Ratio
16:9Item ID
SKT00699
FAQs
You May Also Like These Presentation Templates


- Free
- Free
- Free
- Free
- Free

- Free

- Free

- Free
- Free
- Free