KPI Presentation Template

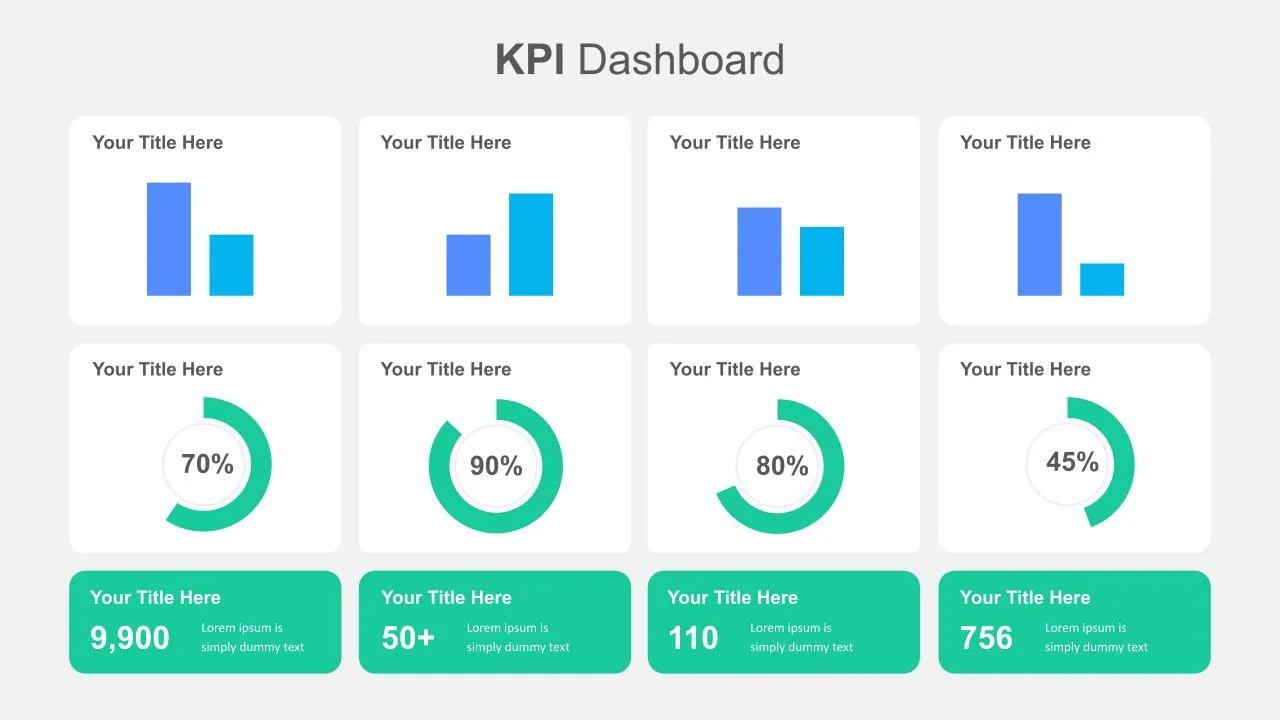
The KPI presentation is a professional google slides theme with two charts (a bar graph and a donut chart) in a data-driven template. It is useful for simple presentations related to low-density data. You can use these slides for the graphical presentation of annual sales, productivity, and profit. Viewers can easily understand quantitative data and performance statistics with the two-slide presentation template. The google slides will automatically adjust the design as per the change in numerical values. The four sets of bar charts and donut charts will delineate different values of the variable. The KPI presentation template lets users see succinct data sets in one slide view. Use attractive KPI dashboard templates now!
See more


