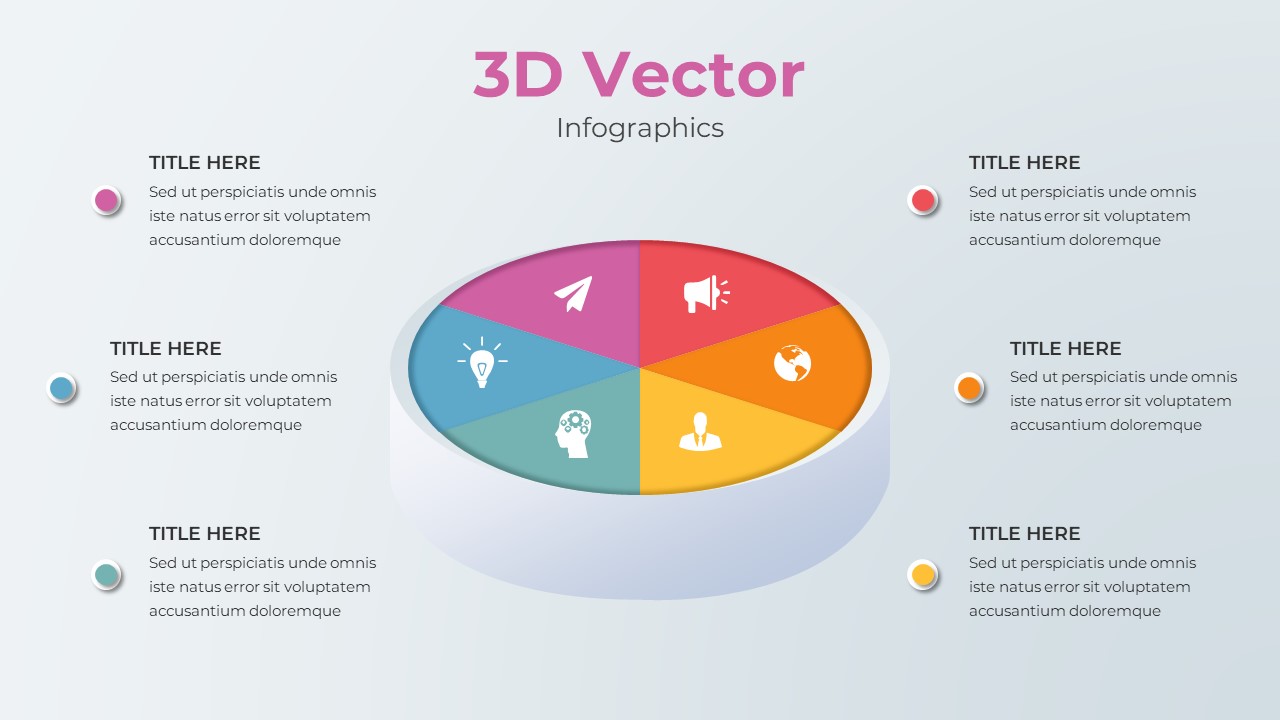
Modern 3D Pie Chart PowerPoint and Google Slides Template

The 3D Pie Chart PowerPoint Template is a modern and impactful tool for visually displaying data professionally and engagingly. Featuring a sleek 3D design, this 3d Pie Chart PowerPoint template allows users to present complex information in a clear, concise, and aesthetically pleasing format. The dimensional pie chart breaks data into color-coded segments, each customizable to represent different categories, making it ideal for business reports, financial overviews, or marketing analytics presentations.
With its dynamic design, the pie chart PPT template brings your data to life, helping your audience grasp key insights at a glance. The template includes placeholders for explanatory text to complement each segment of the pie, allowing you to provide detailed breakdowns and emphasize critical data points. It is an excellent choice for professionals across various sectors, including business analysts, marketers, consultants, and educators, who need to communicate numerical data with clarity and precision.
Available in both PowerPoint and Google Slides formats, this infographic slide template is fully customizable, enabling you to adjust colors, text, and labels to suit your presentation’s specific needs. The 3D effect adds depth to the data visualization, making the content more memorable and engaging for your audience. Whether presenting quarterly financial results, survey data, or project outcomes, this 3D Pie Chart Template enhances both the visual appeal and understanding of your presentation.
See more

Aspect Ratio
16:9Item ID
SKT01592
Features of this template
Other Use Cases of the Template:
Financial reports, project status updates, marketing campaign analytics, product comparison analysis, sales performance tracking, customer survey results, budget allocation presentations, business forecasts, competitive analysis, operational efficiency reviews.FAQs
You May Also Like These Presentation Templates


- Free
- Free
- Free


- Free
- Free

- Free
- Free
- Free
- Free

- Free