Monthly Financial Dashboard Template for PowerPoint and Google Slides

Gain a comprehensive overview of your monthly financial performance with this visually engaging Financial Dashboard Template. Designed for PowerPoint and Google Slides, this template provides a clear and concise snapshot of your income, expenses, profitability, and key financial metrics.
Key Features:
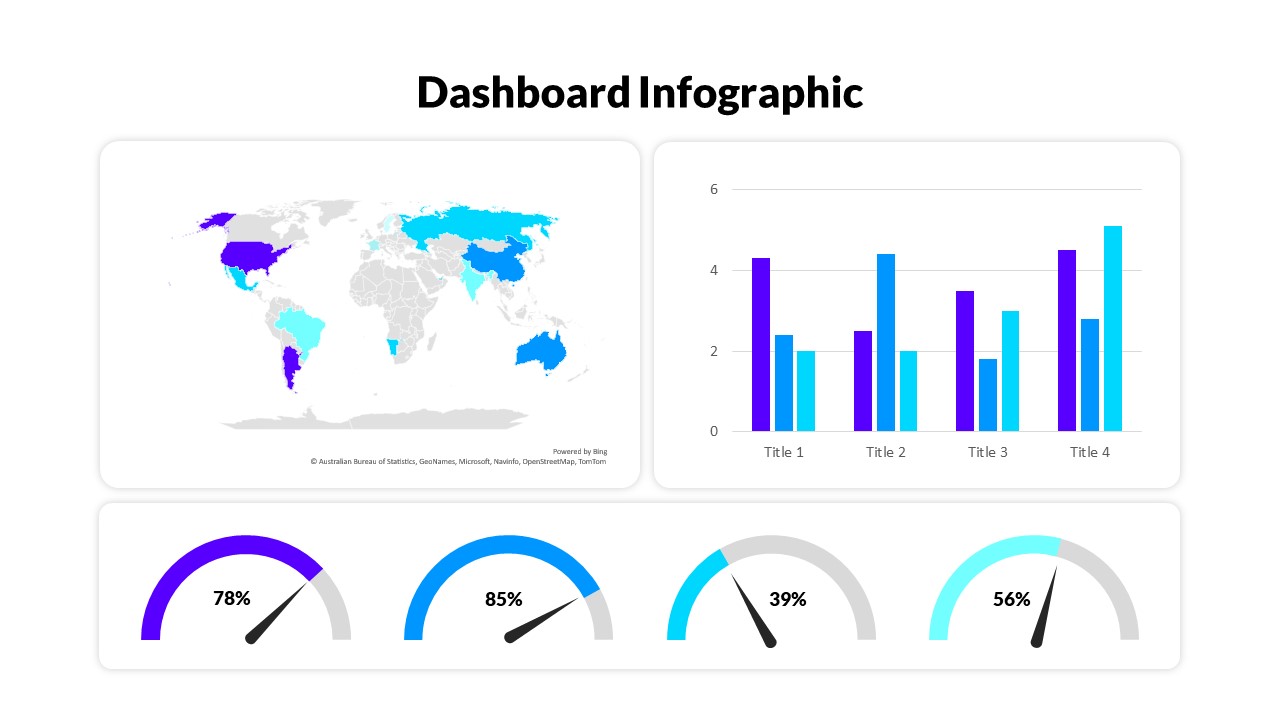
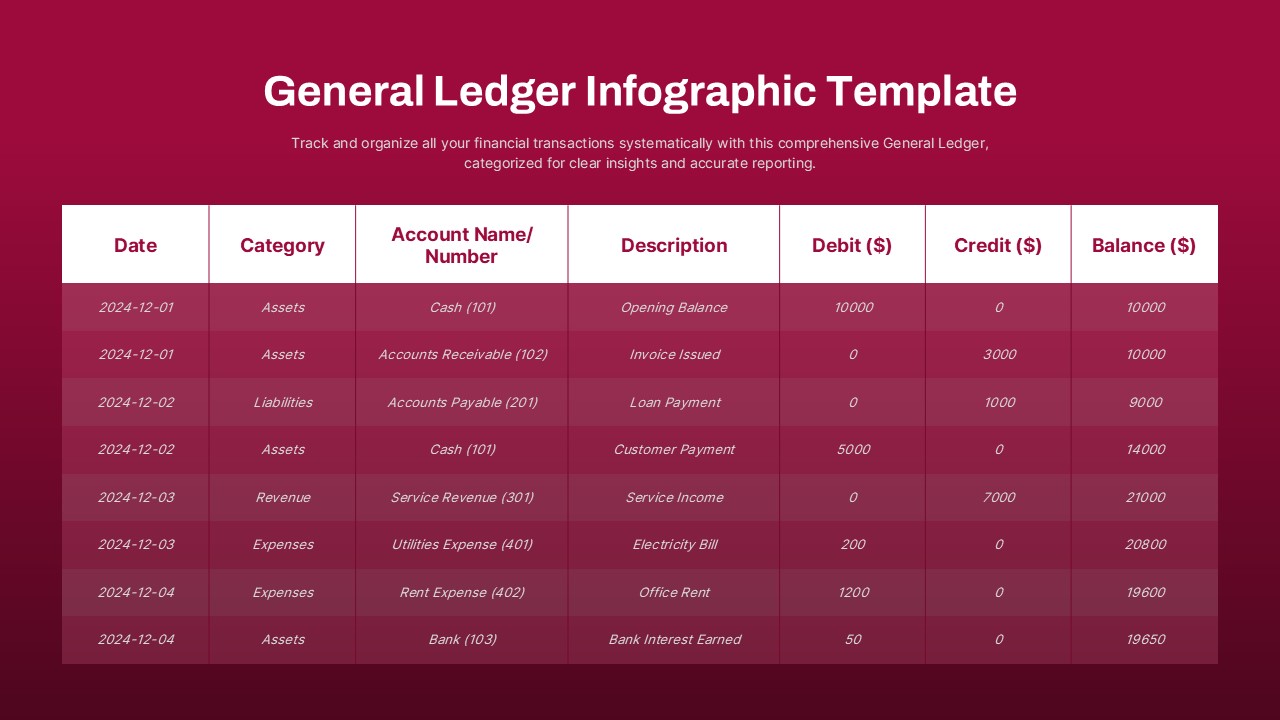
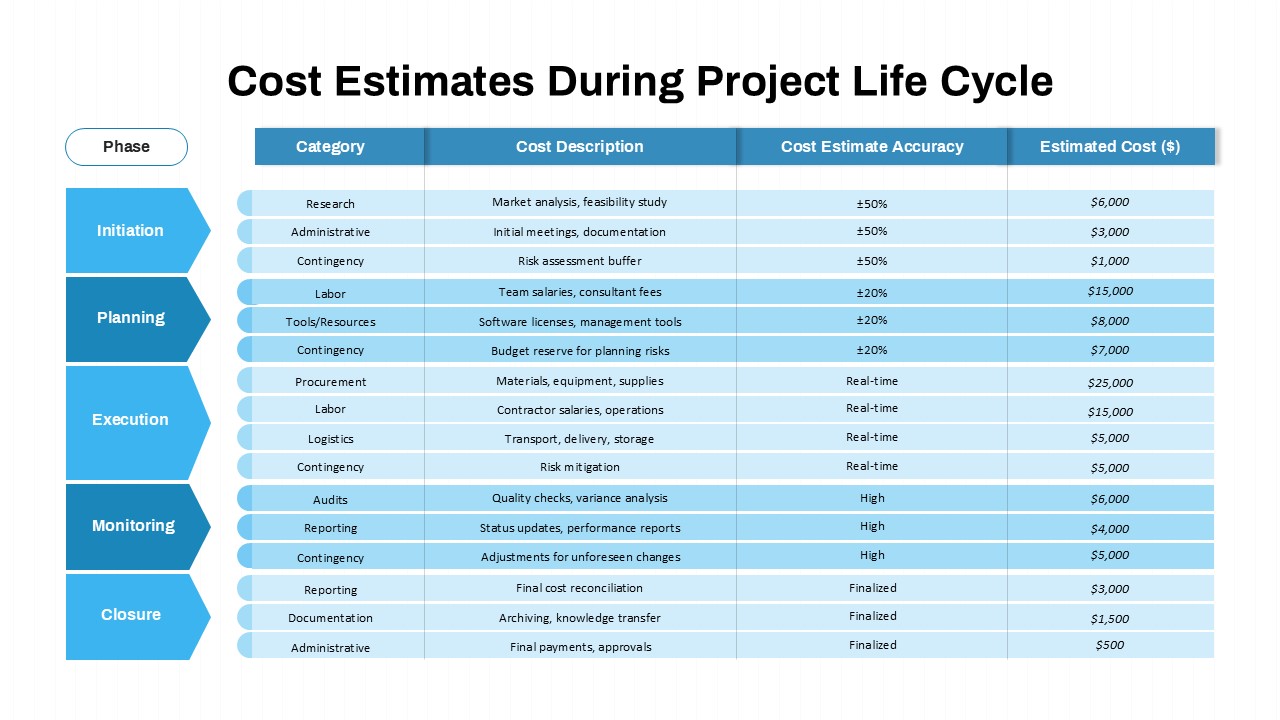
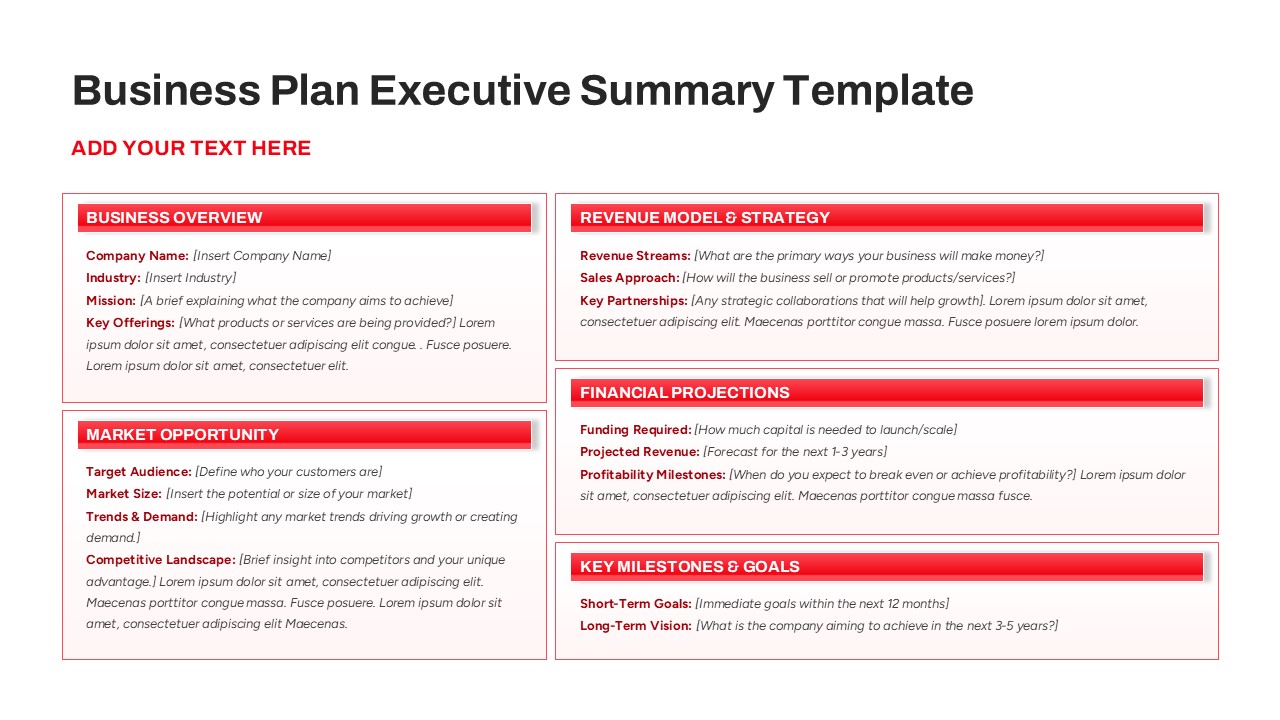
- Comprehensive Financial Overview: Presents key financial data in a single, easy-to-understand dashboard, including total income, expenses, net profit, profit margin, and key ratios.
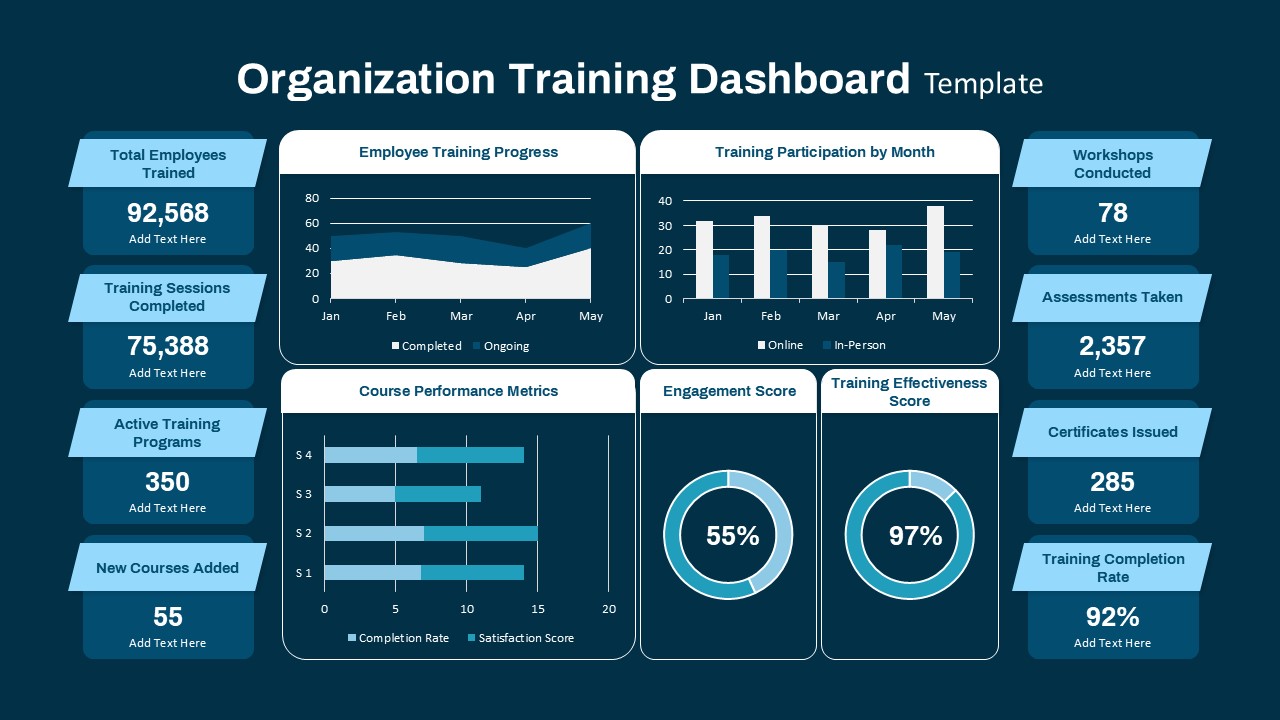
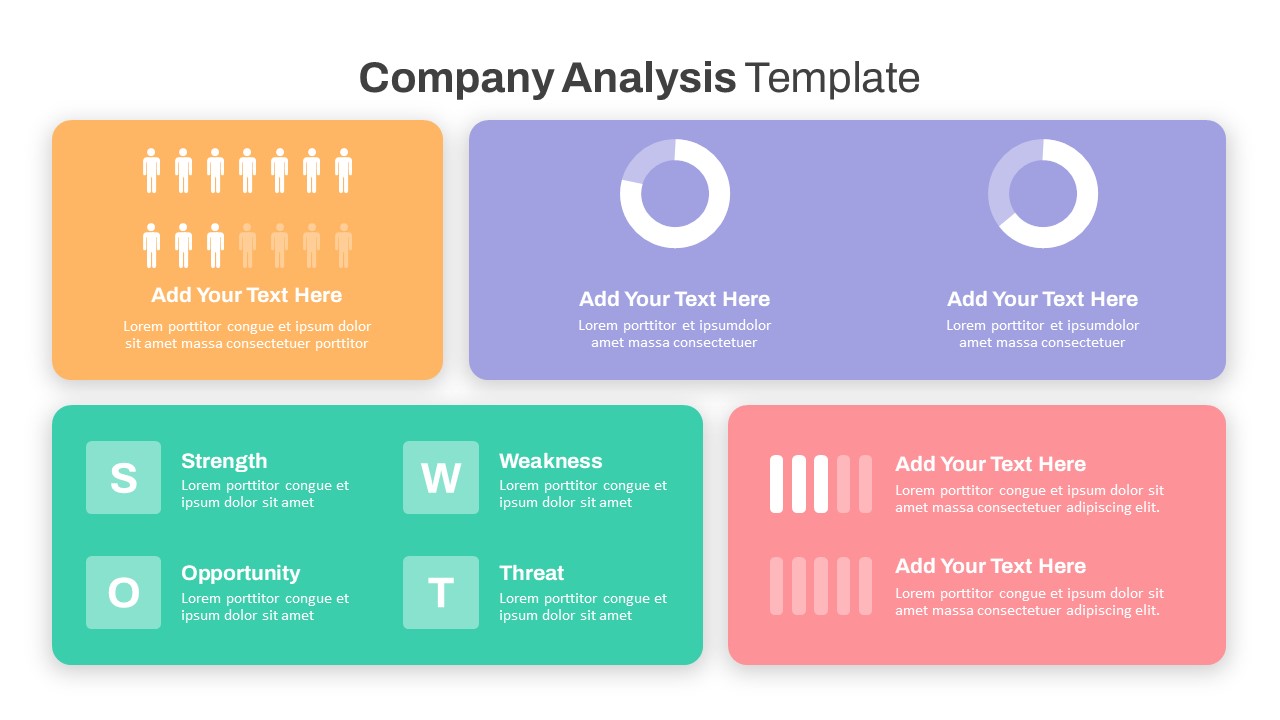
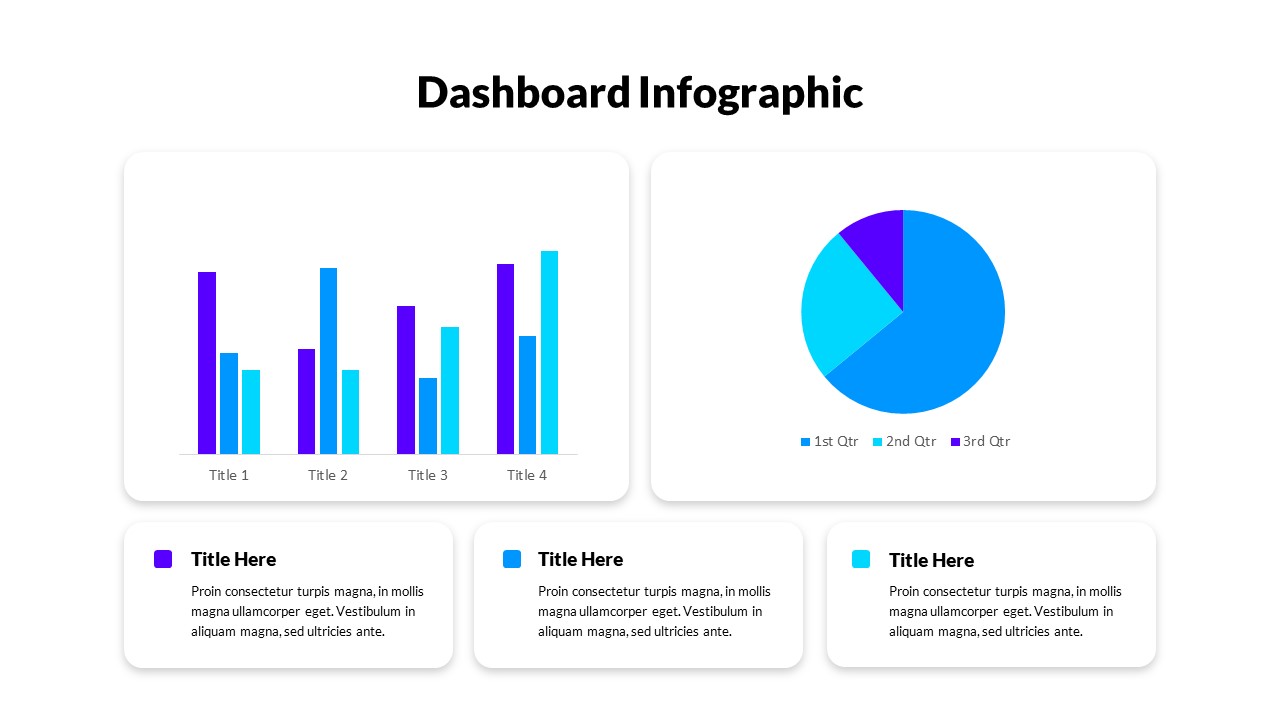
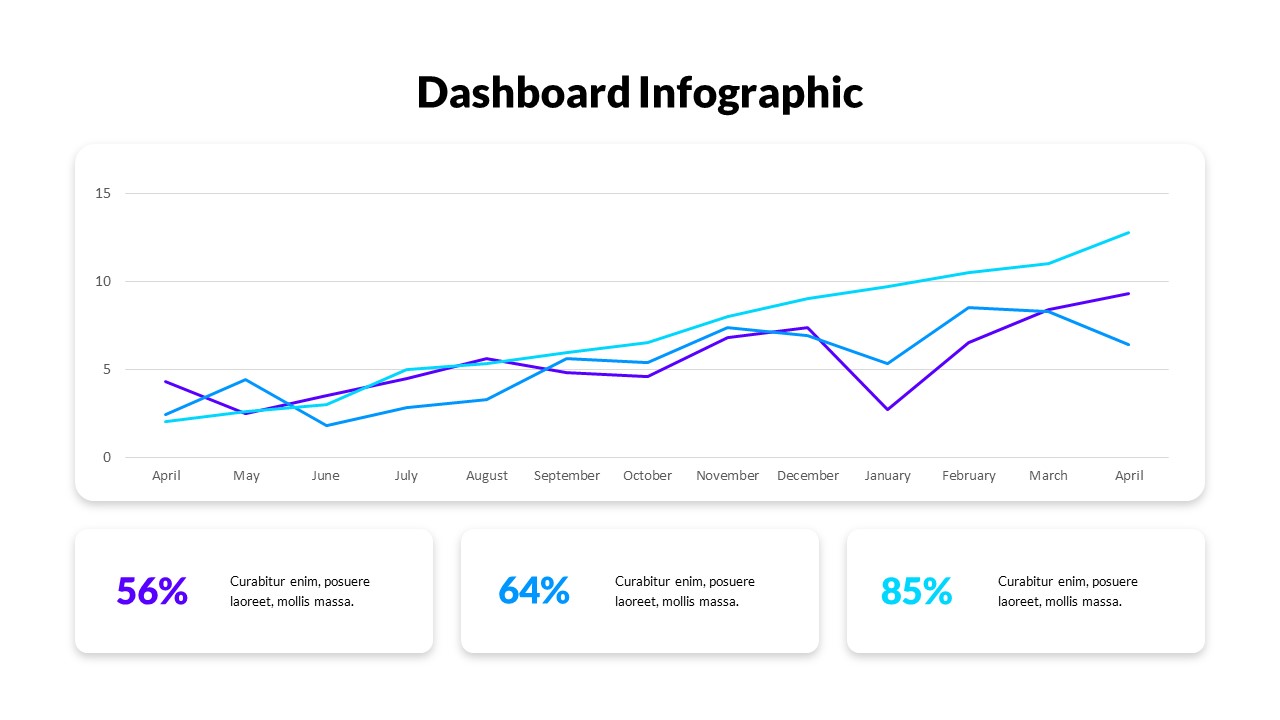
- Visual Data Representation: Utilizes charts, graphs, and circular progress indicators to effectively visualize financial data, enhancing comprehension and analysis.
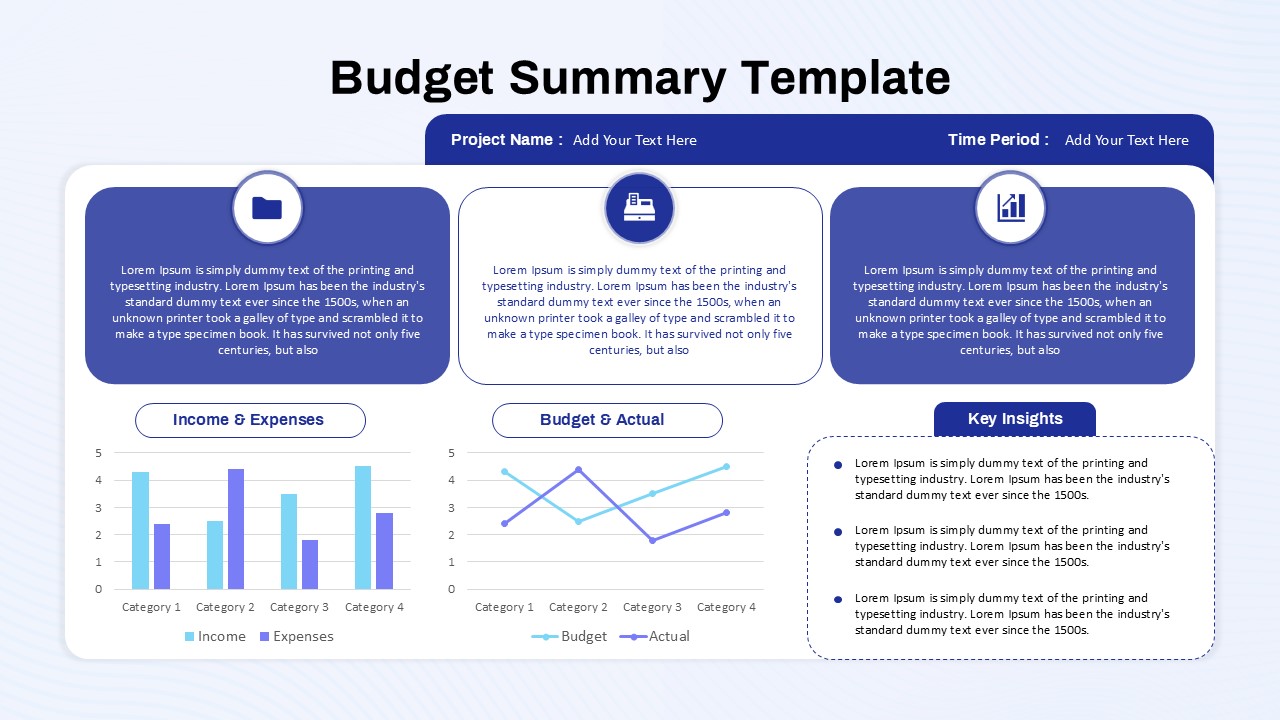
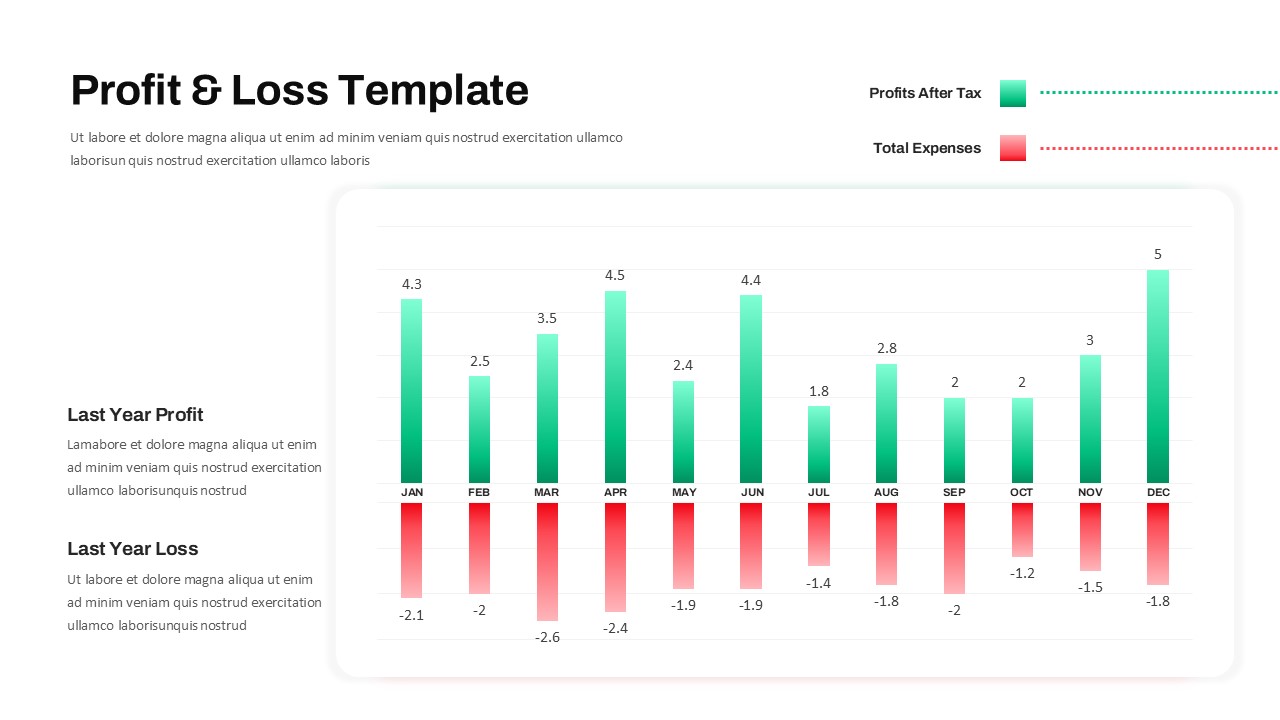
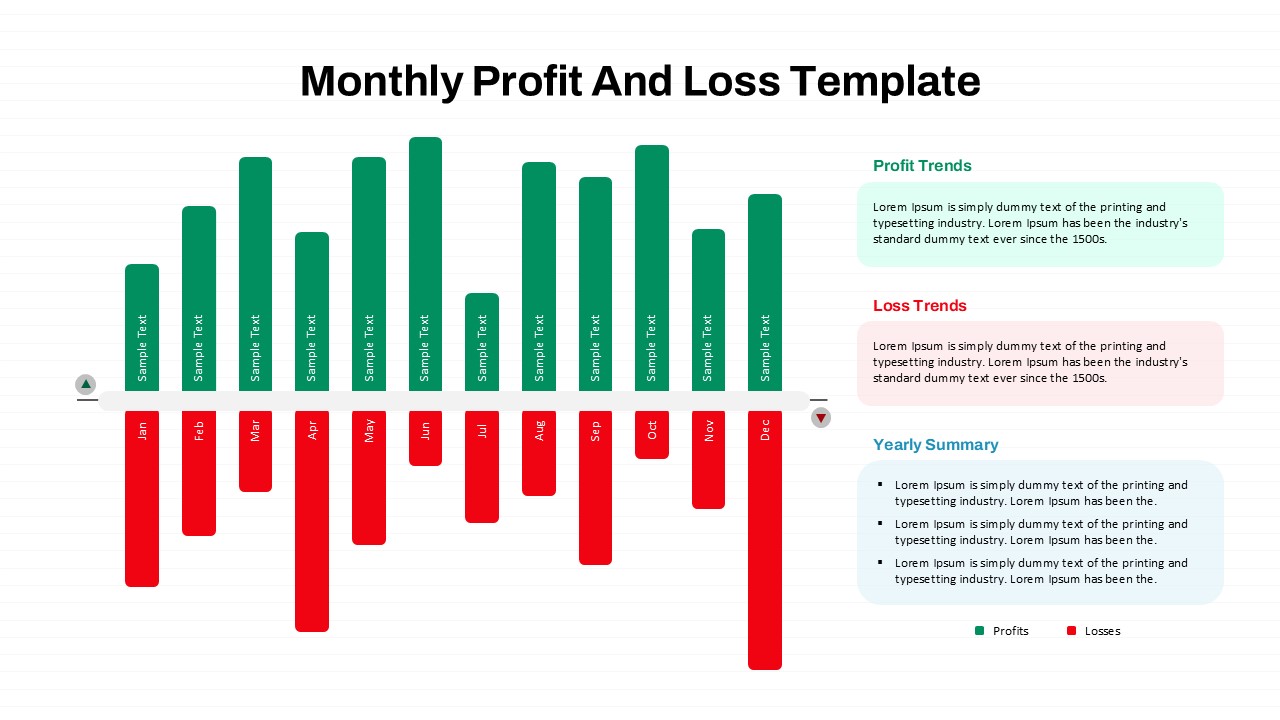
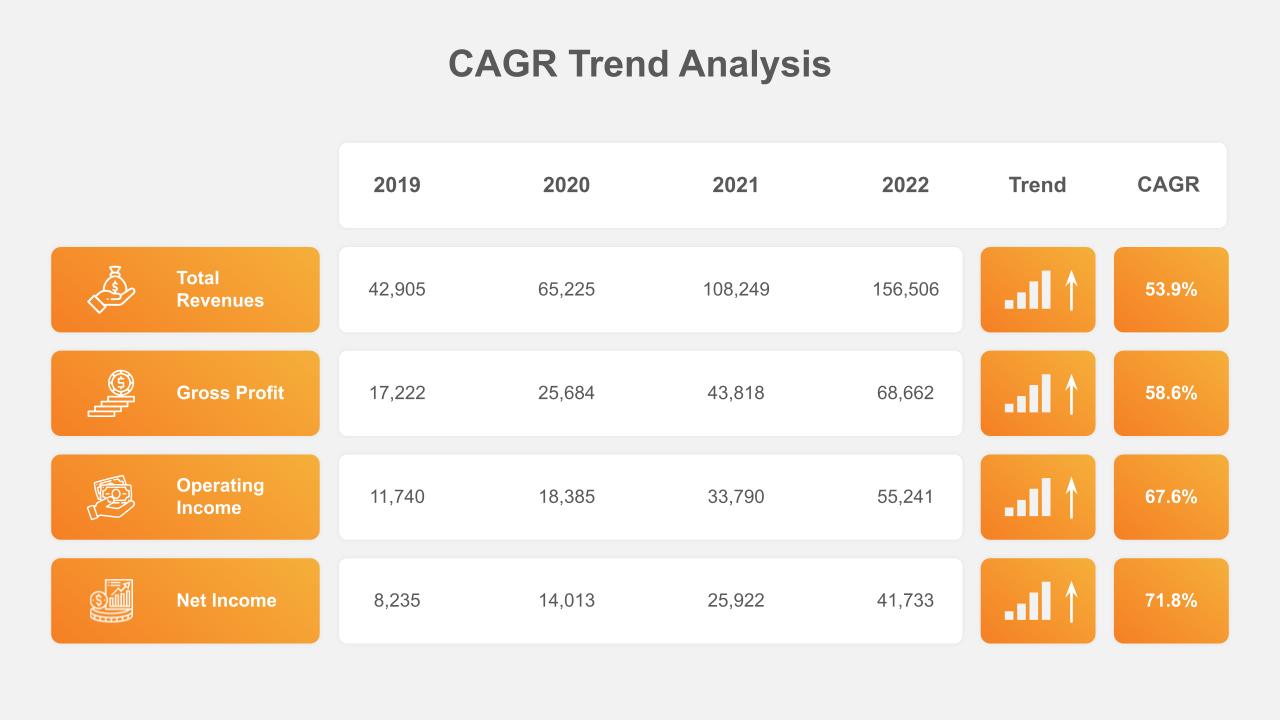
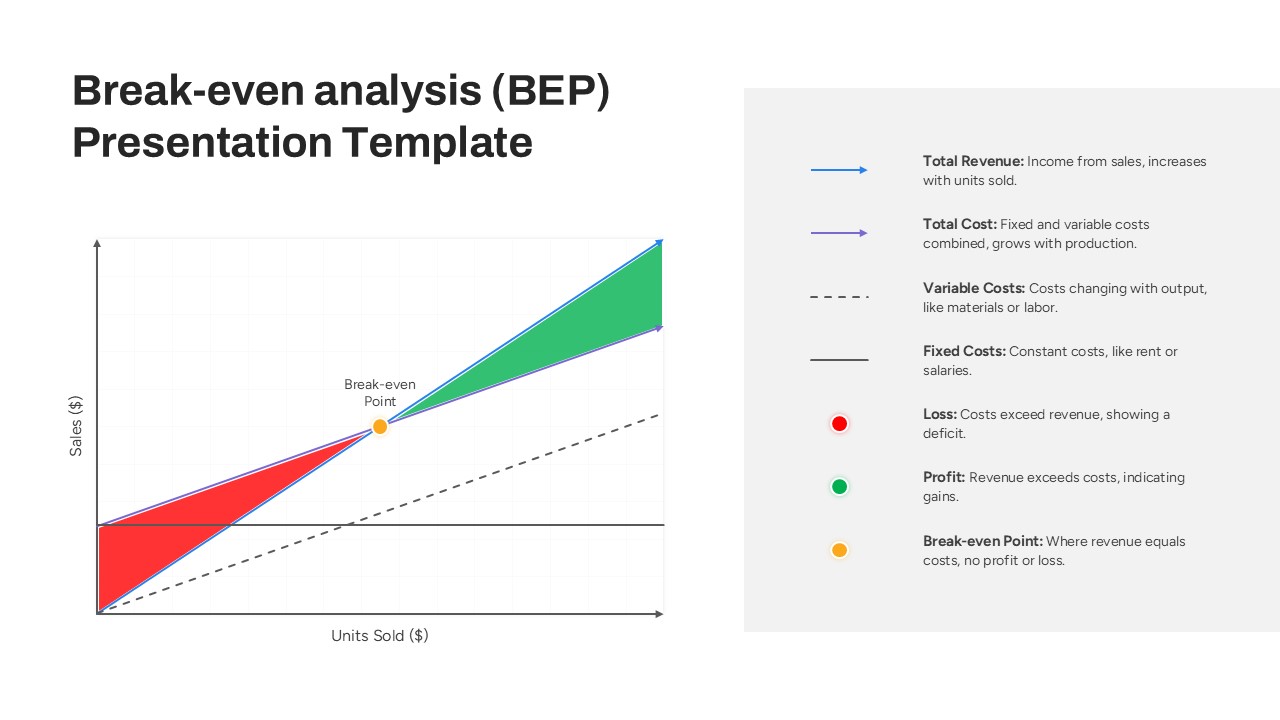
- Profit & Loss Trend Analysis: Provides a line graph to track income and expenses over time, allowing for easy identification of trends and patterns.
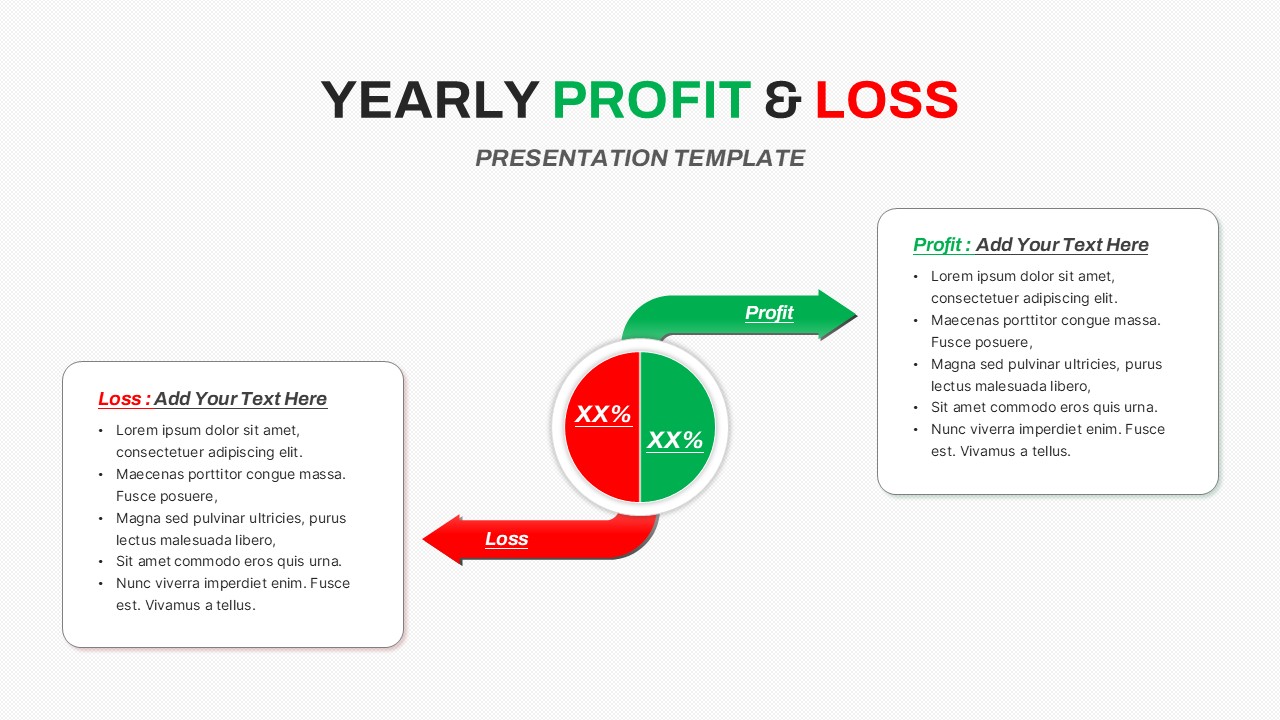
- Revenue and Expense Breakdown: Shows the composition of revenue and expenses using pie charts, providing insights into key contributors and cost drivers.
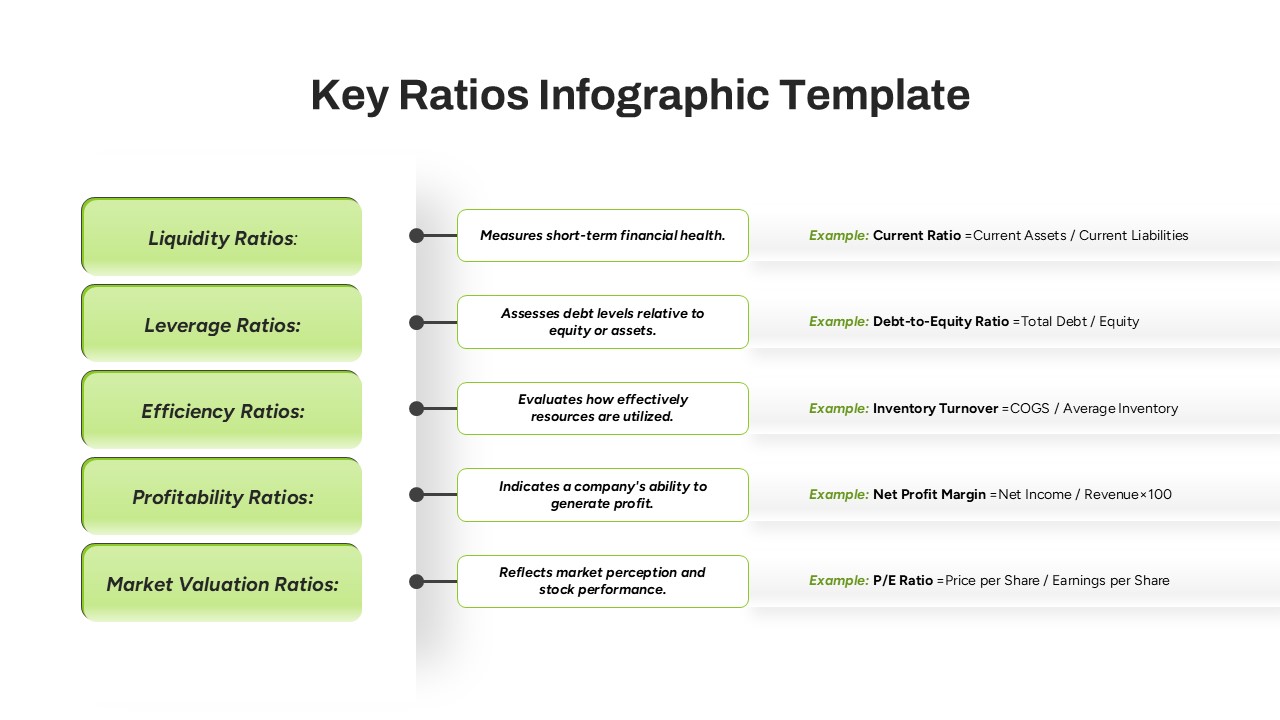
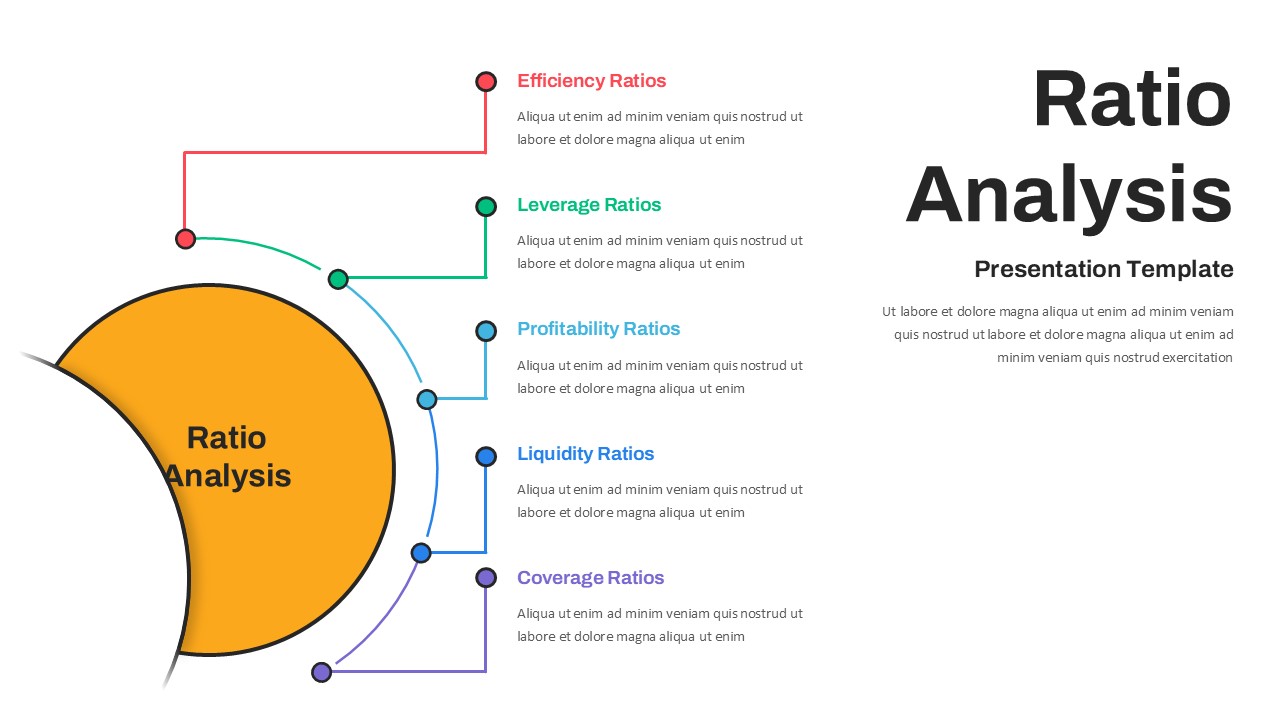
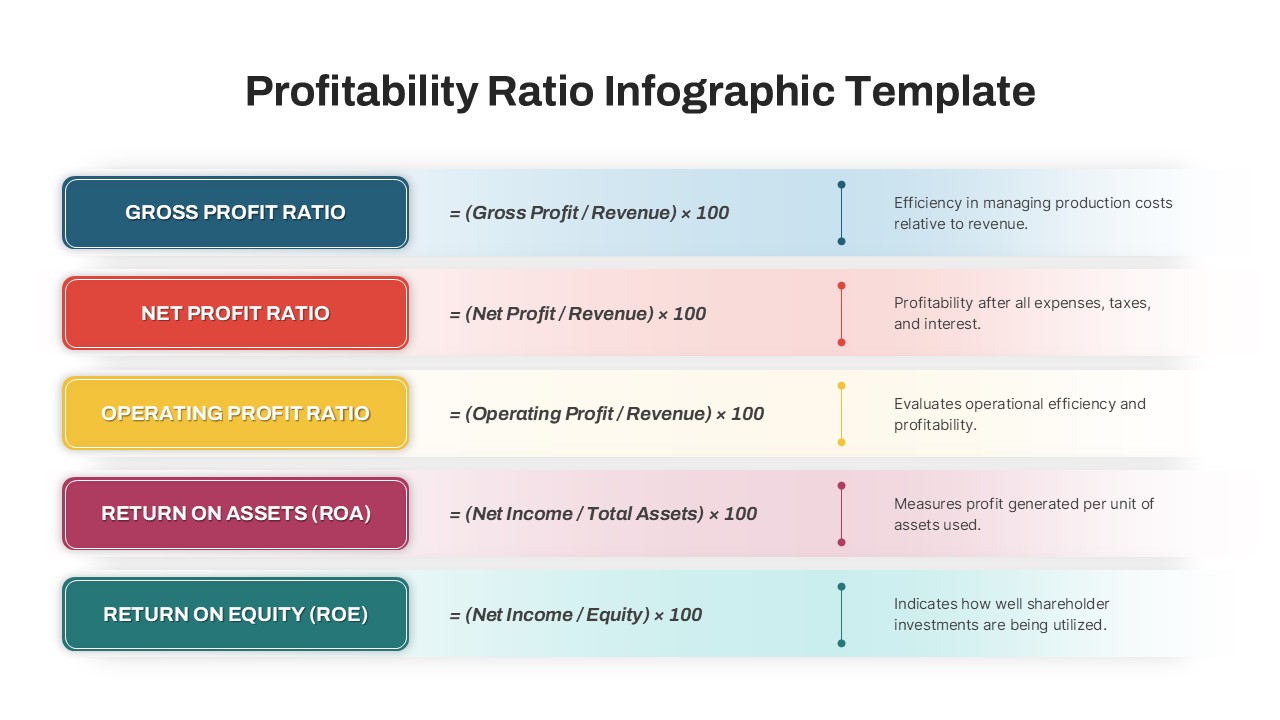
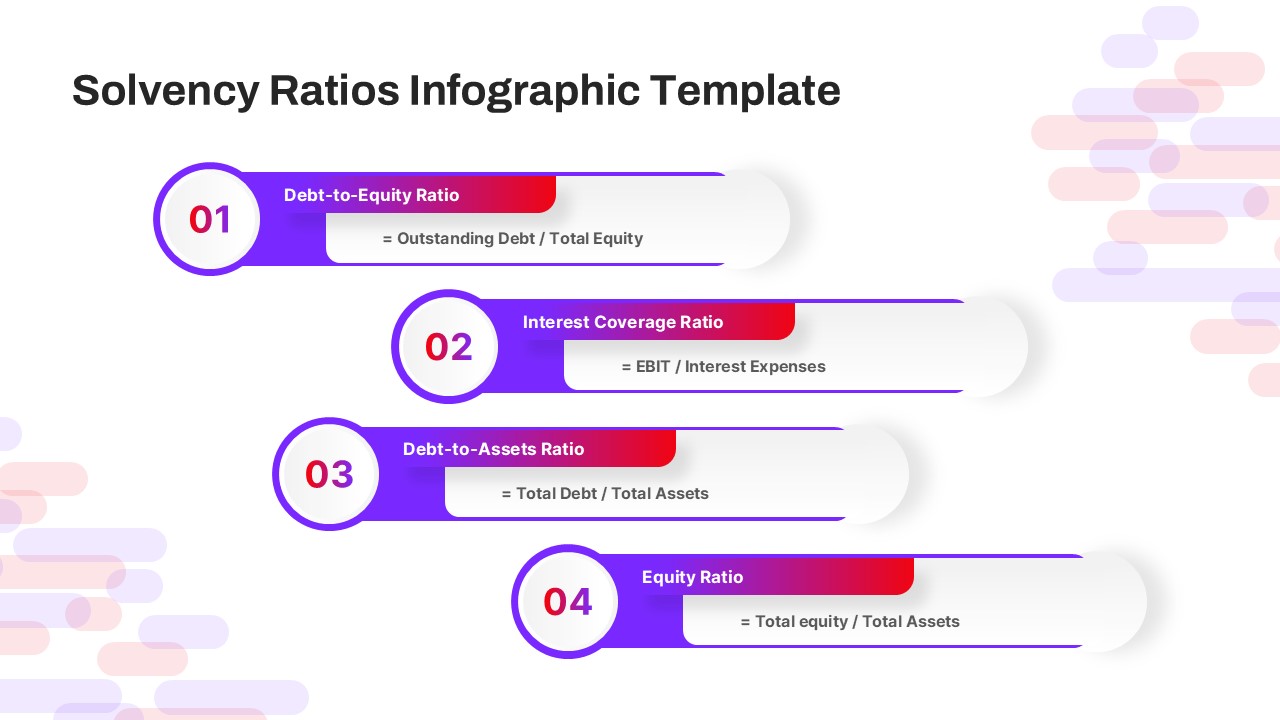
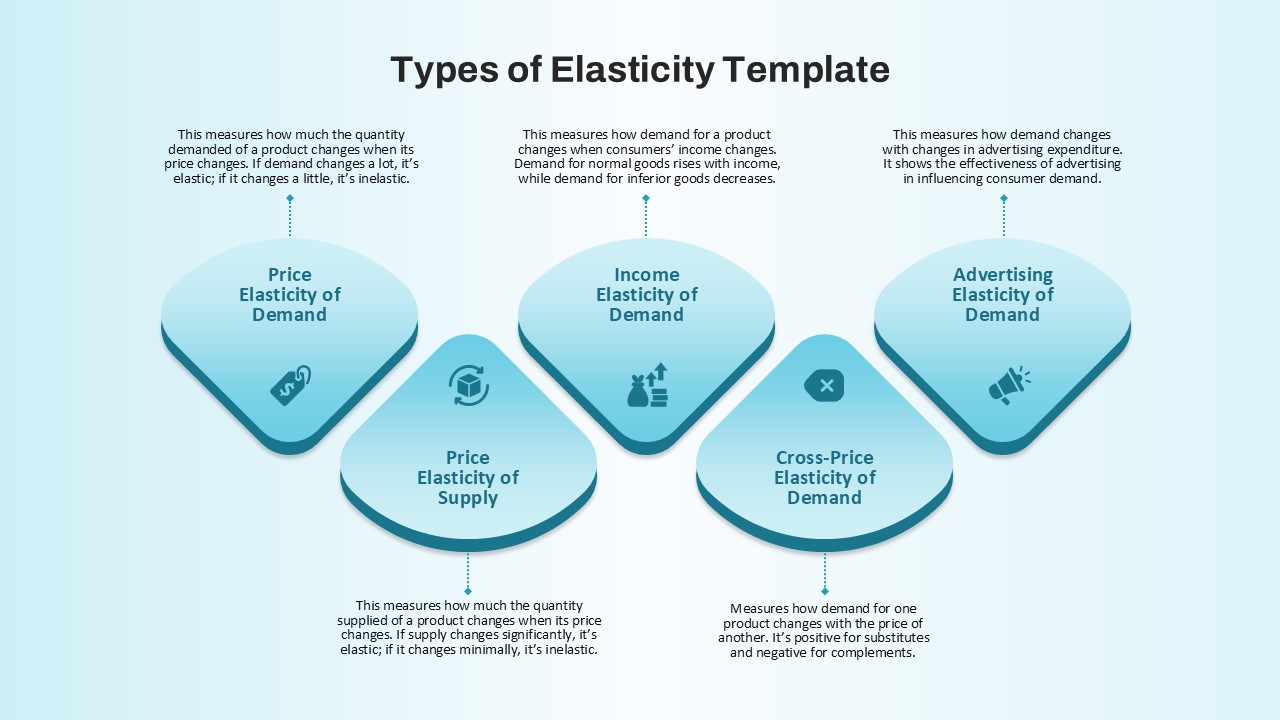
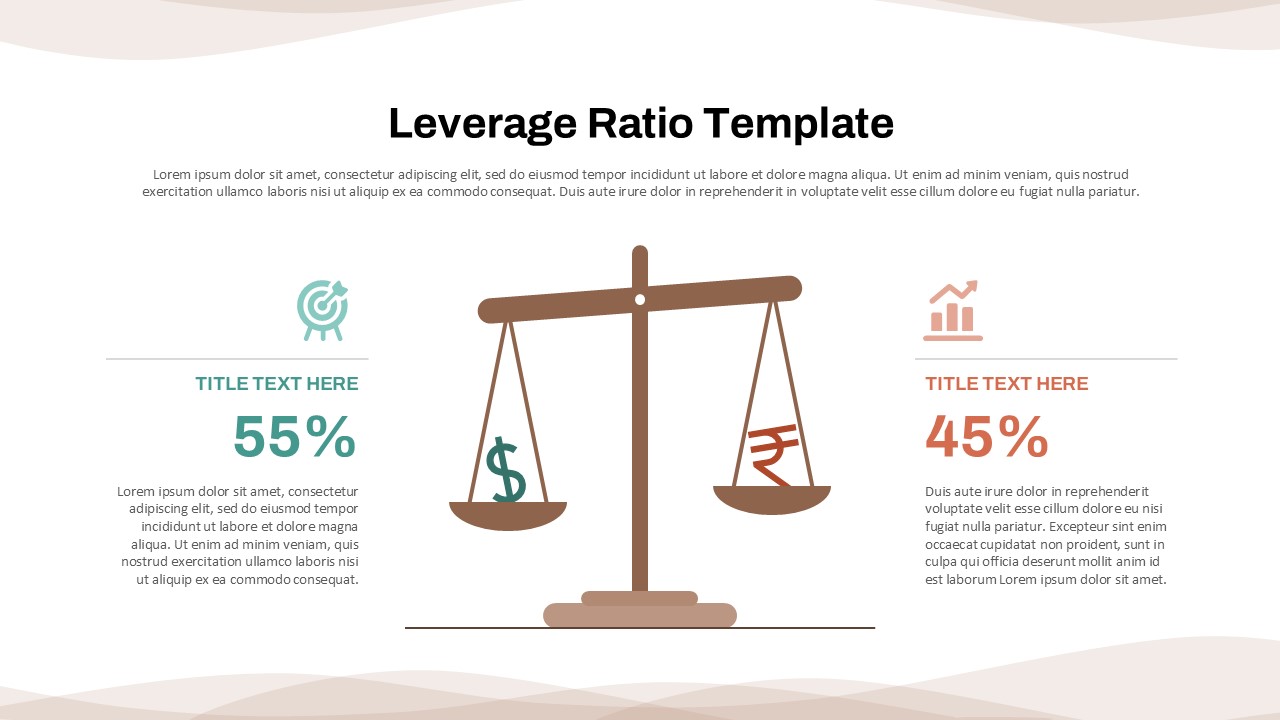
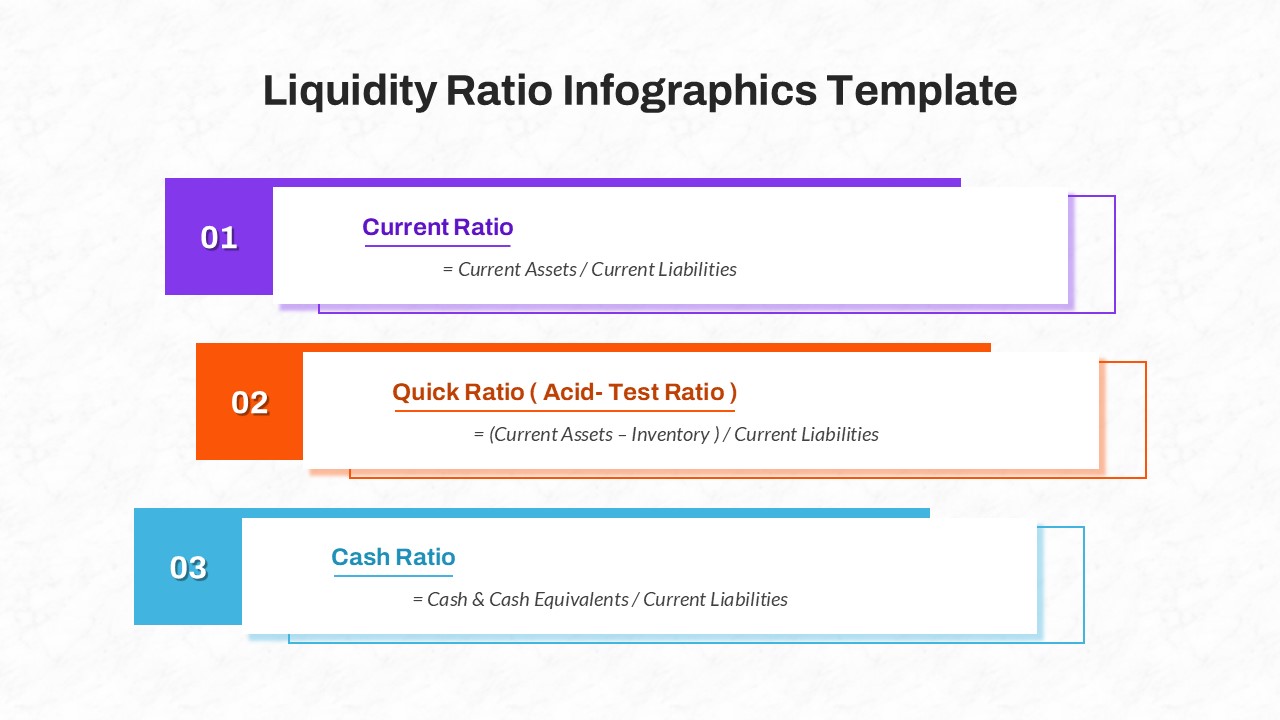
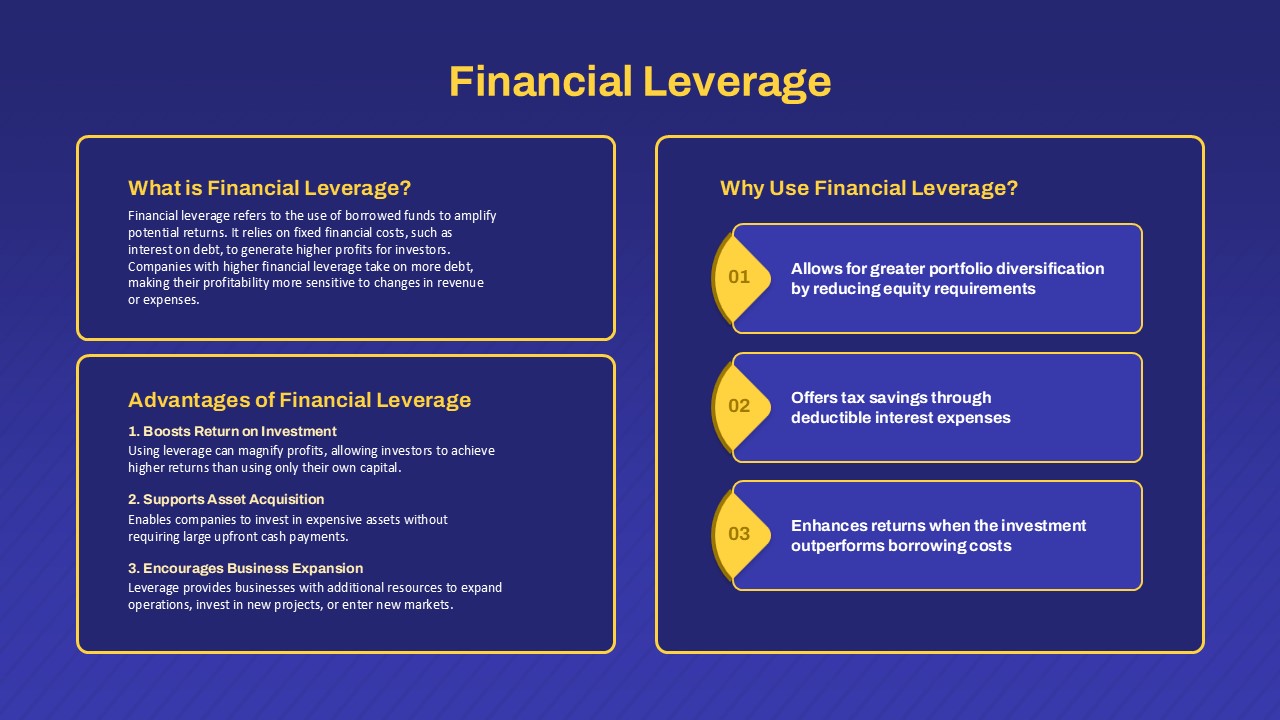
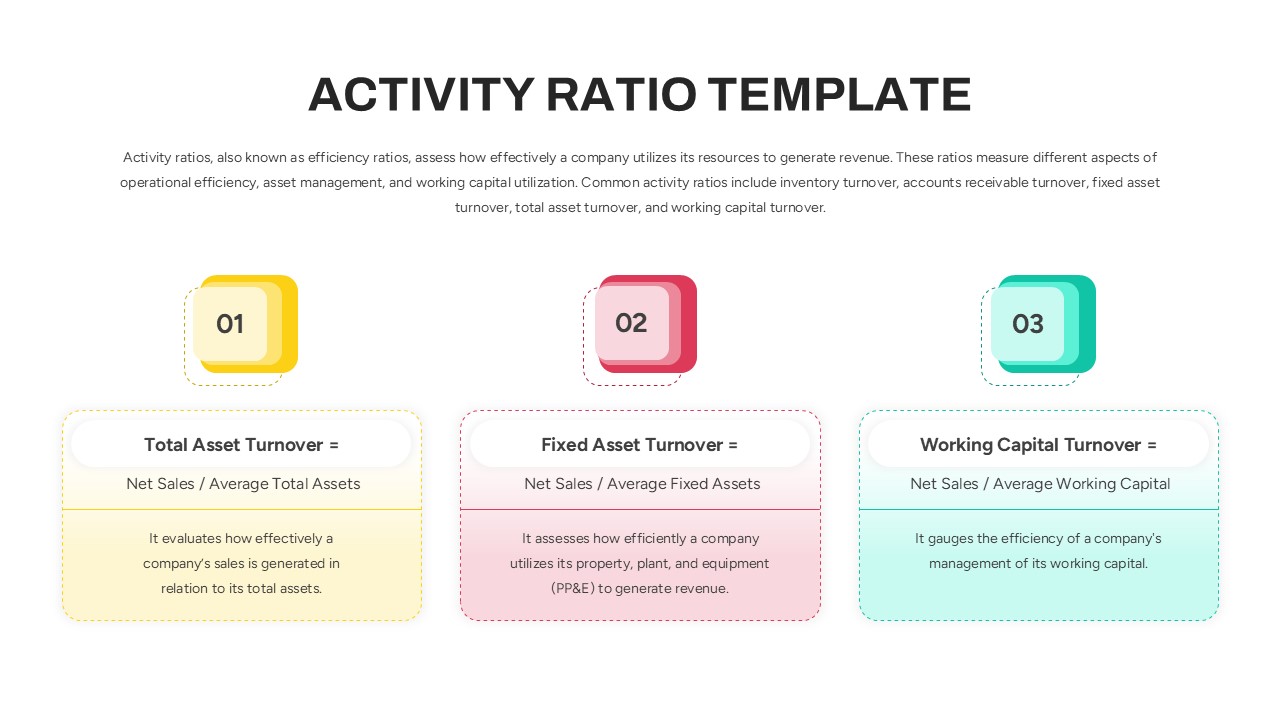
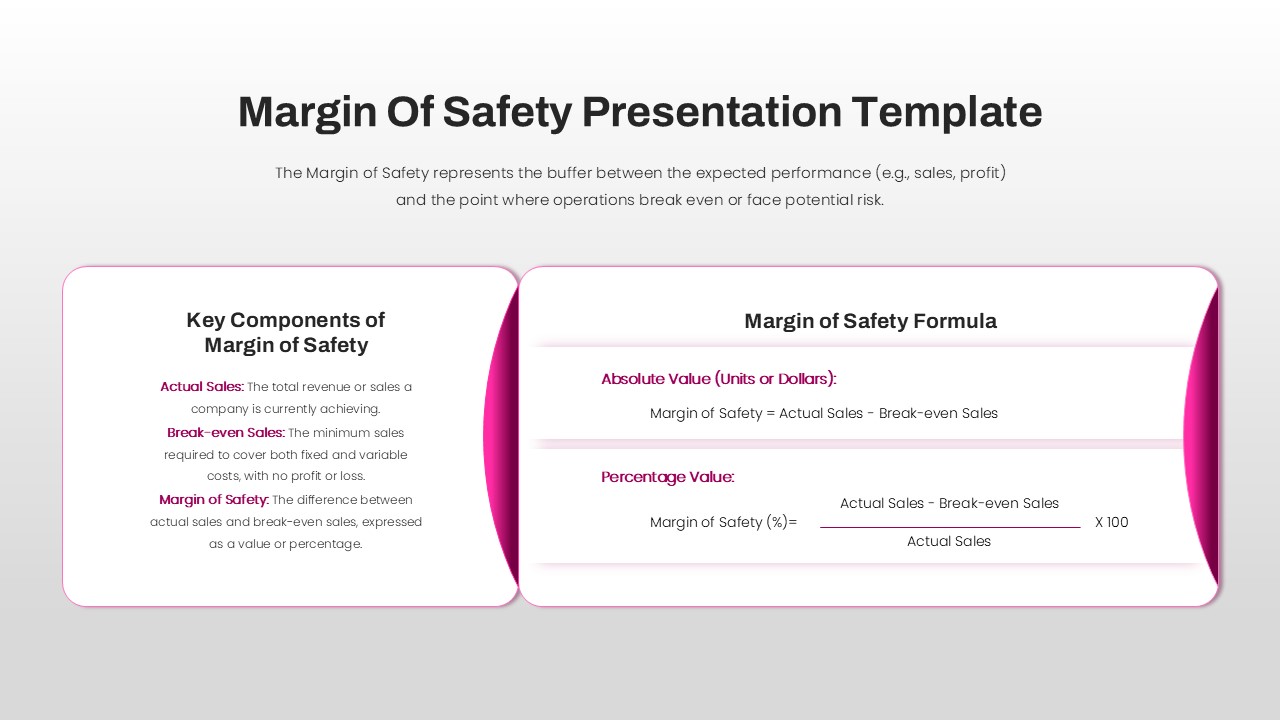
- Key Financial Ratios: Displays essential financial ratios, such as current ratio and debt-to-equity ratio, offering insights into liquidity and leverage.
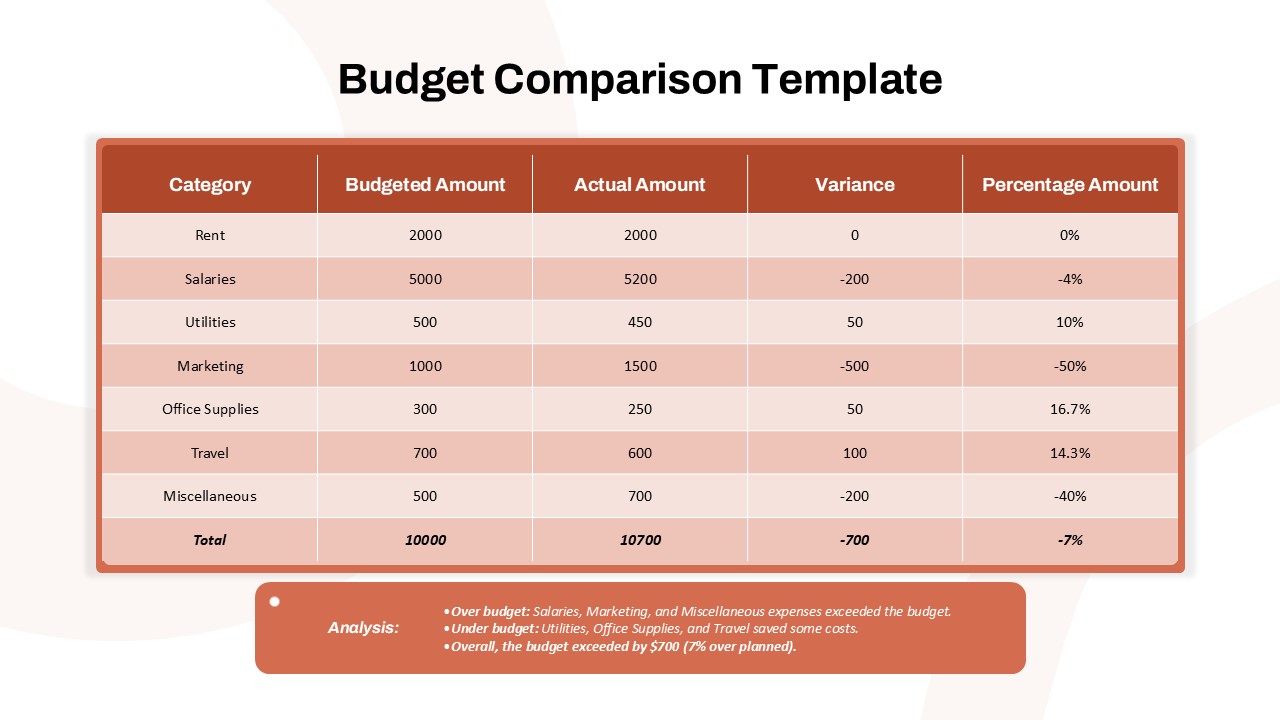
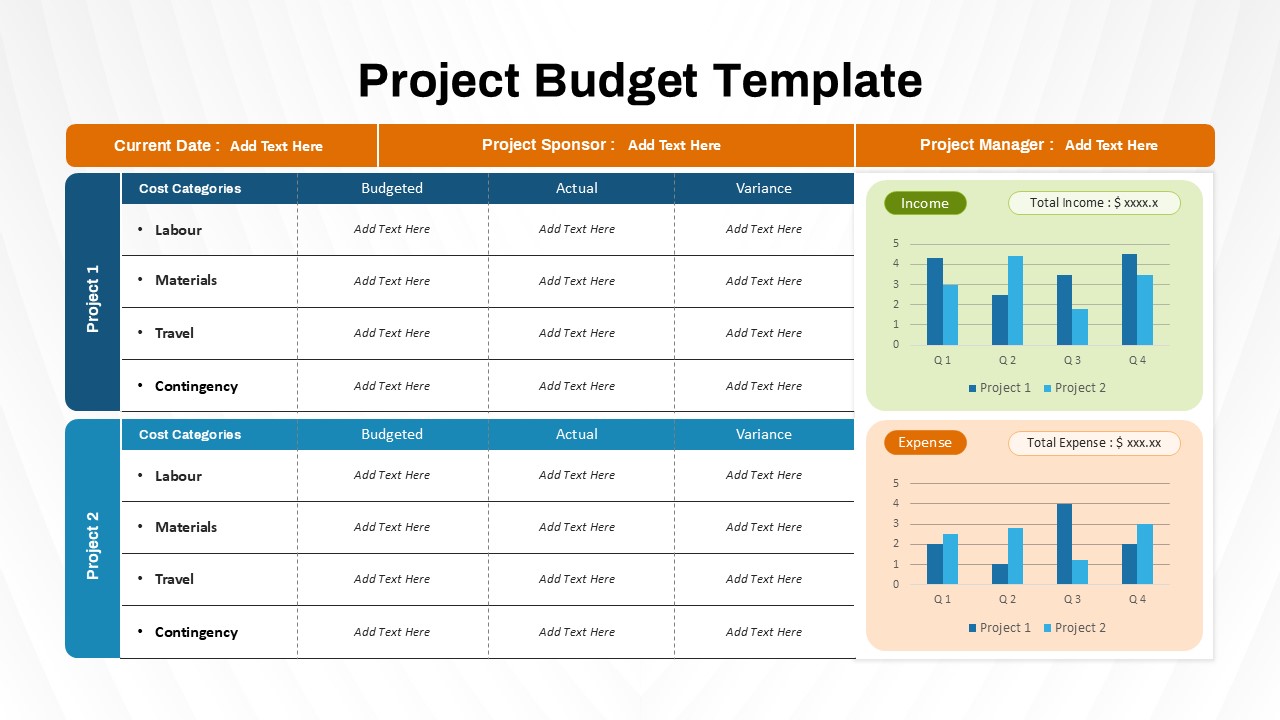
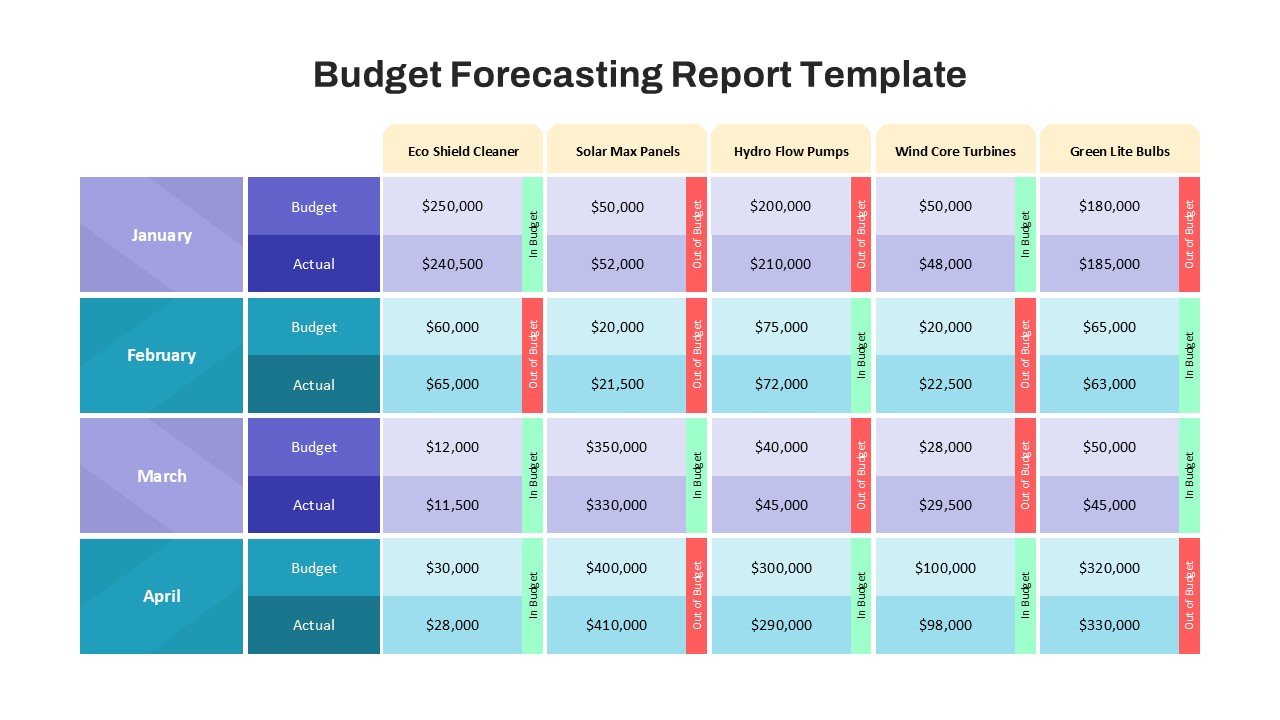
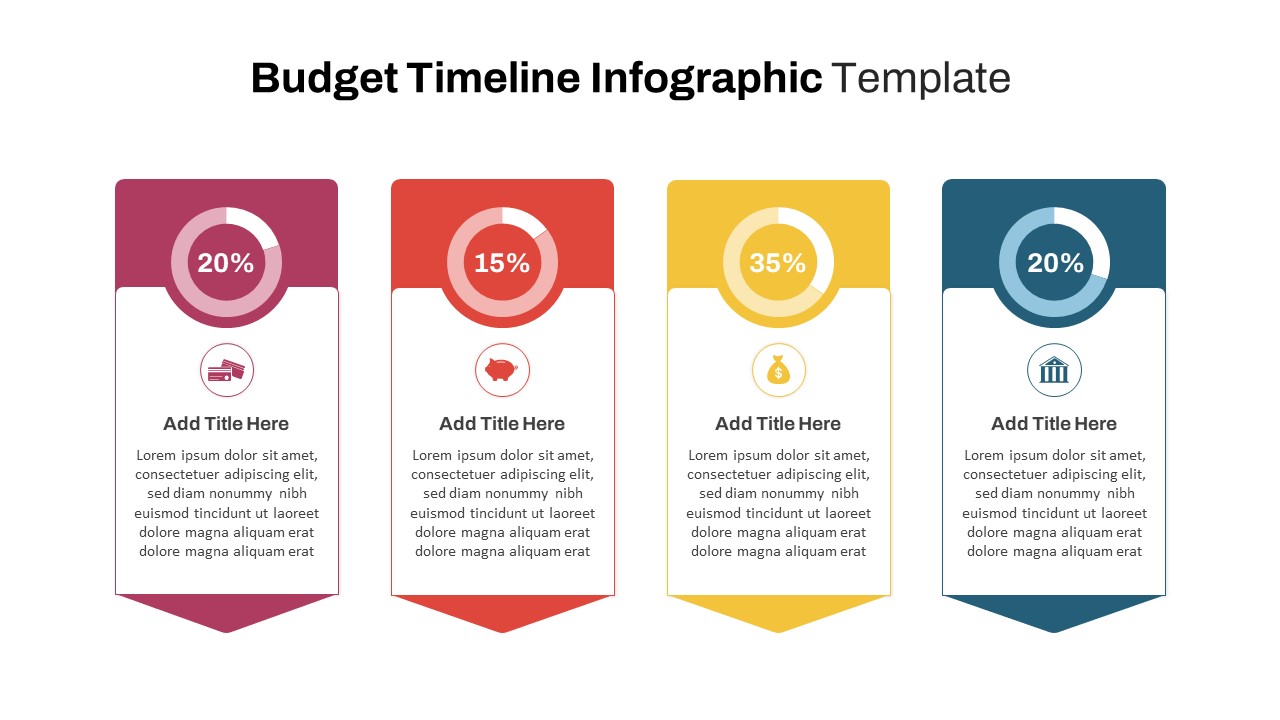
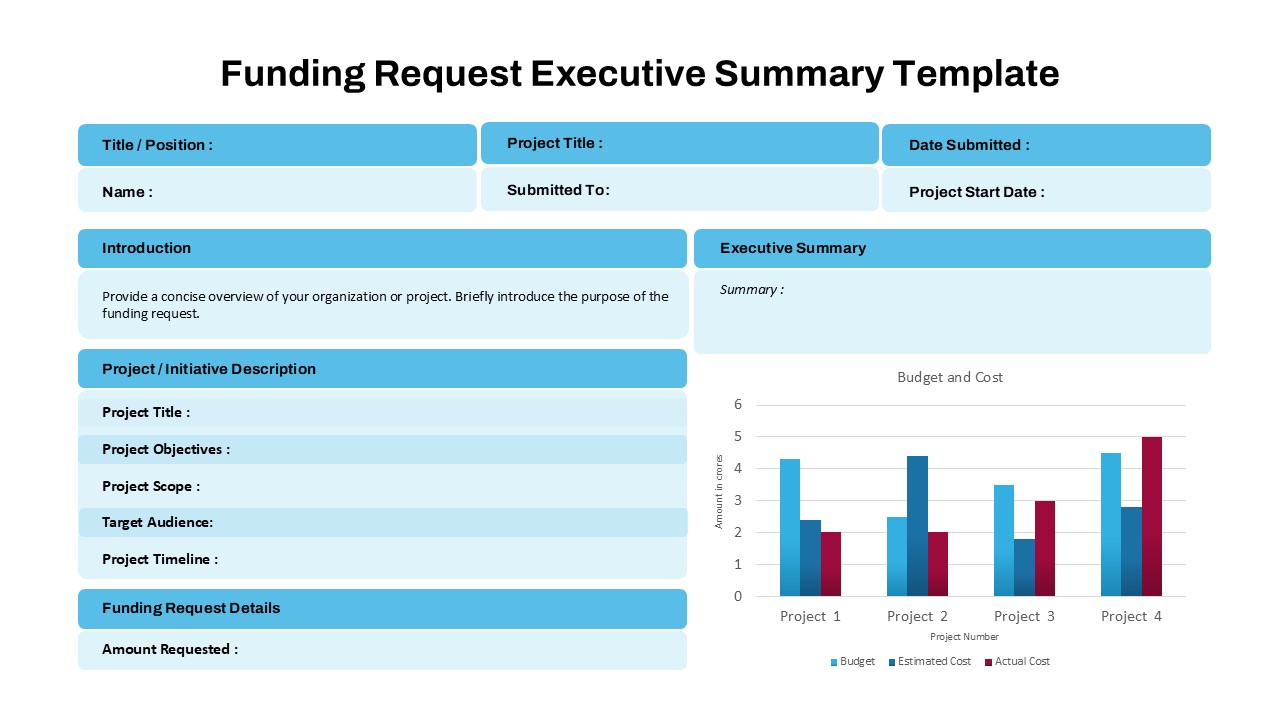
- Budget vs. Actual Performance: Compares budgeted figures with actual performance, highlighting variances and areas for improvement.
- Modern and Professional Design: Features a clean and contemporary aesthetic suitable for financial presentations and reporting.
- Fully Customizable: Easily adjust colors, fonts, and data to match your specific financial information and branding.
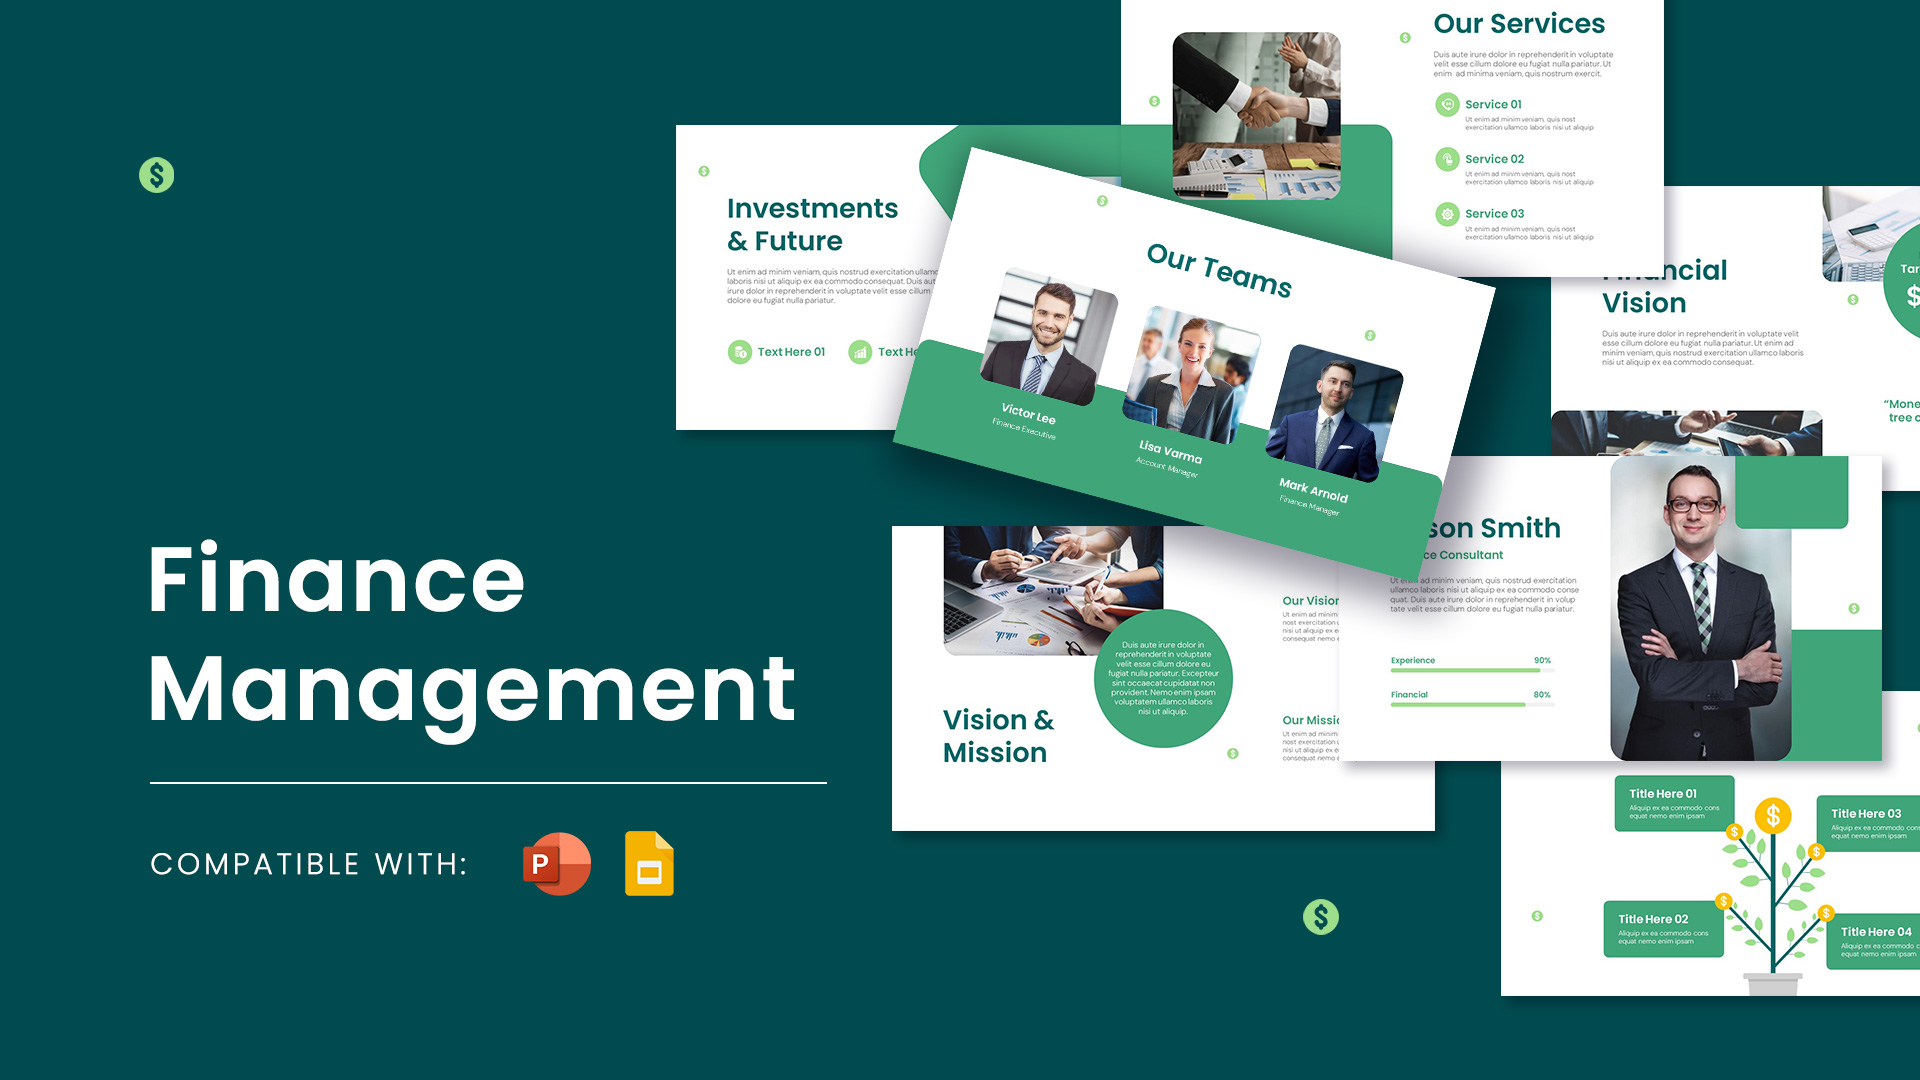
- Compatible with PowerPoint and Google Slides: Work seamlessly across both platforms for easy sharing and collaboration.
Benefits:
- Enhance Financial Reporting: Present financial data in a clear and visually appealing way, improving communication and understanding.
- Streamline Financial Analysis: Quickly identify key trends and insights, supporting informed decision-making.
- Improve Financial Transparency: Provide clear visibility into financial performance for your team and stakeholders.
- Save Time and Effort: Skip the hassle of building financial dashboards from scratch with a ready-to-use template.
See more

Aspect Ratio
16:9Item ID
SKT03244
Features of this template
Other Use Cases of the Template:
Business performance analysis, budget forecasting, revenue and expense tracking, financial risk assessment, investor presentations, company earnings reports, CFO financial reviews, startup financial planning, corporate financial strategy, operational cost analysis.
FAQs
You May Also Like These Presentation Templates


- Free

- Free
- Free

- Free
- Free
- Free

- Free
- Free

- Free
- Free