North Star Slide Template
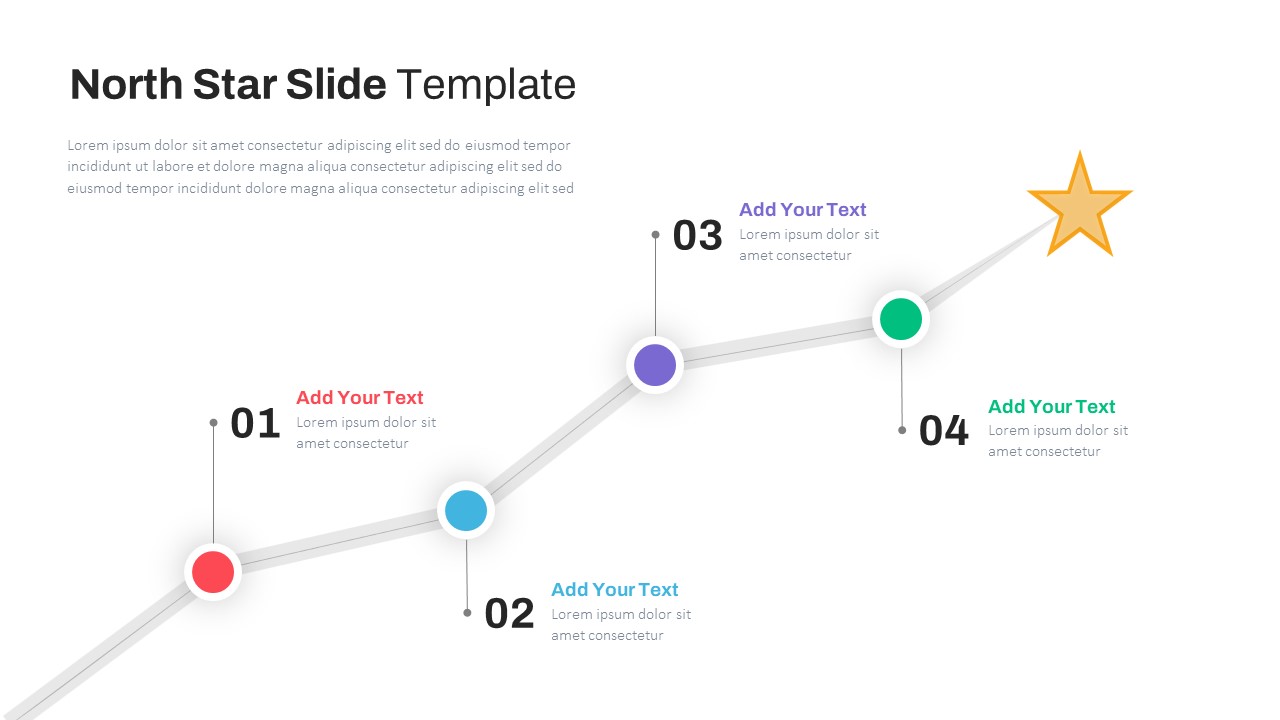
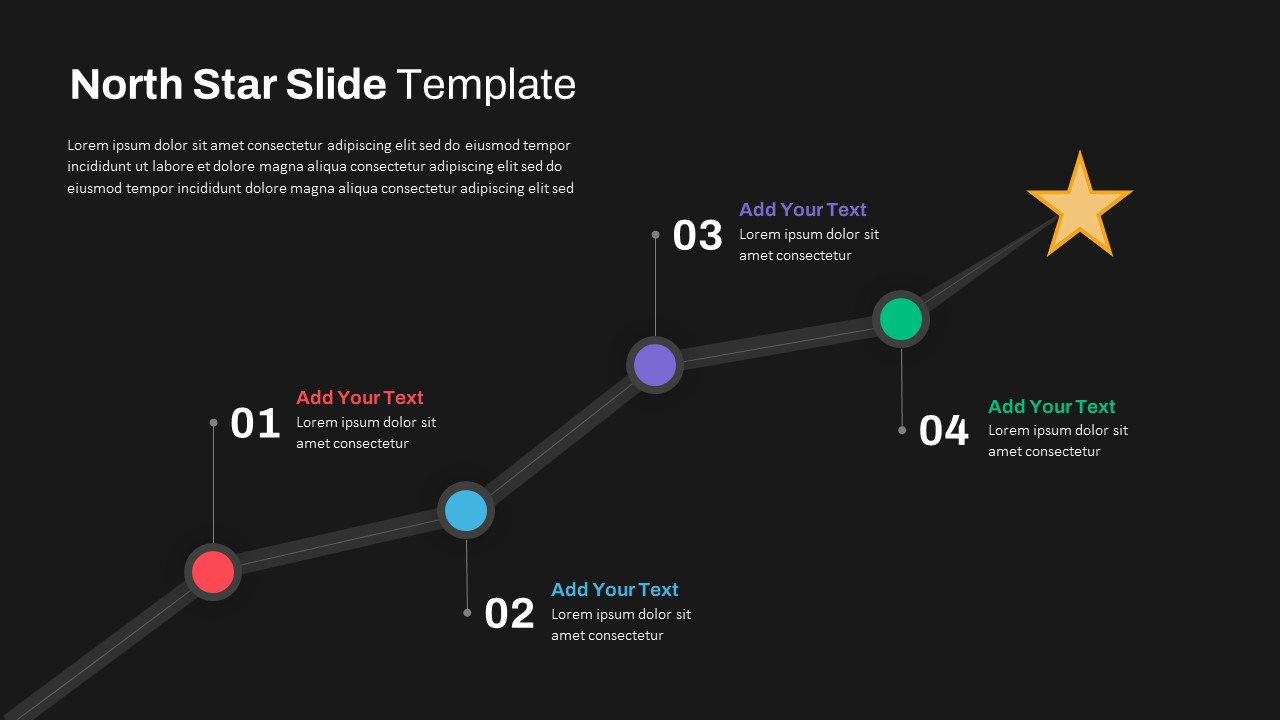


North Star Slide Template offers your business metric slideshow with an upward line graph. North metric is a business indicator that focuses on an organization’s growth. It is a key performance metric that aligns all efforts towards a central goal, representing the fundamental value a company delivers to its customers. So, you can show the key performance indicators by using the North Star Metric Slide.
This data-driven chart for Google Slide presentation can be used to illustrate growth strategies, track performance, and align your entire organization toward a common goal. The North Star Metric Template has four touchpoints wherein you can add your data. At the end, there is a star in yellow that represents the organizational goal. The presenters can add any data using this statistical template. Get it now!
See more

Aspect Ratio
16:9Item ID
SKT00798
You May Also Like These Presentation Templates


- Free
- Free
- Free
- Free
- Free
- Free