Paraguay Map Template
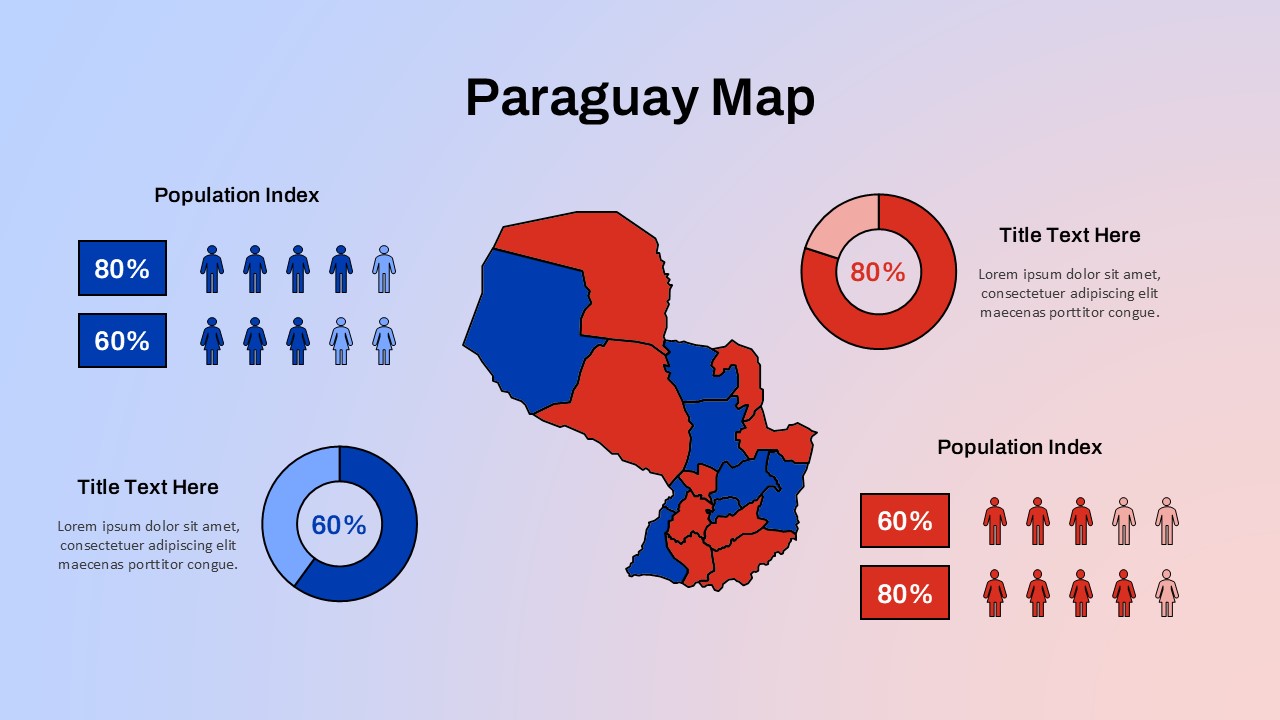
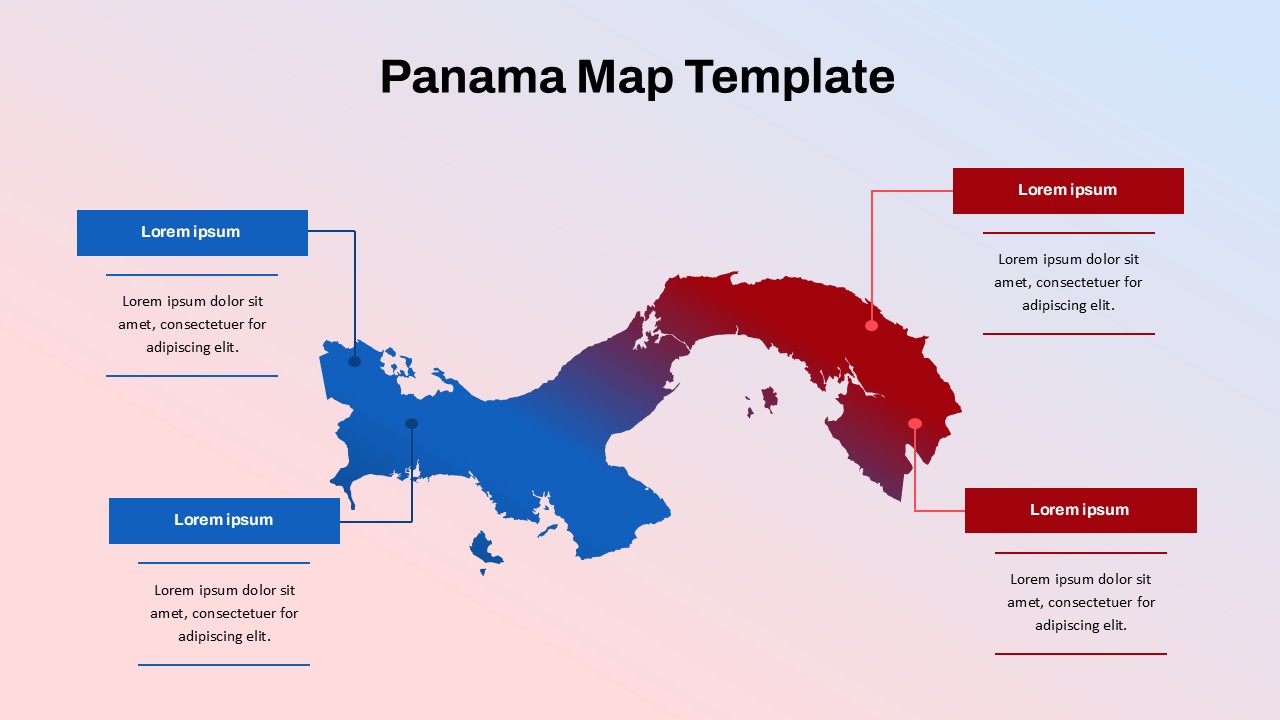
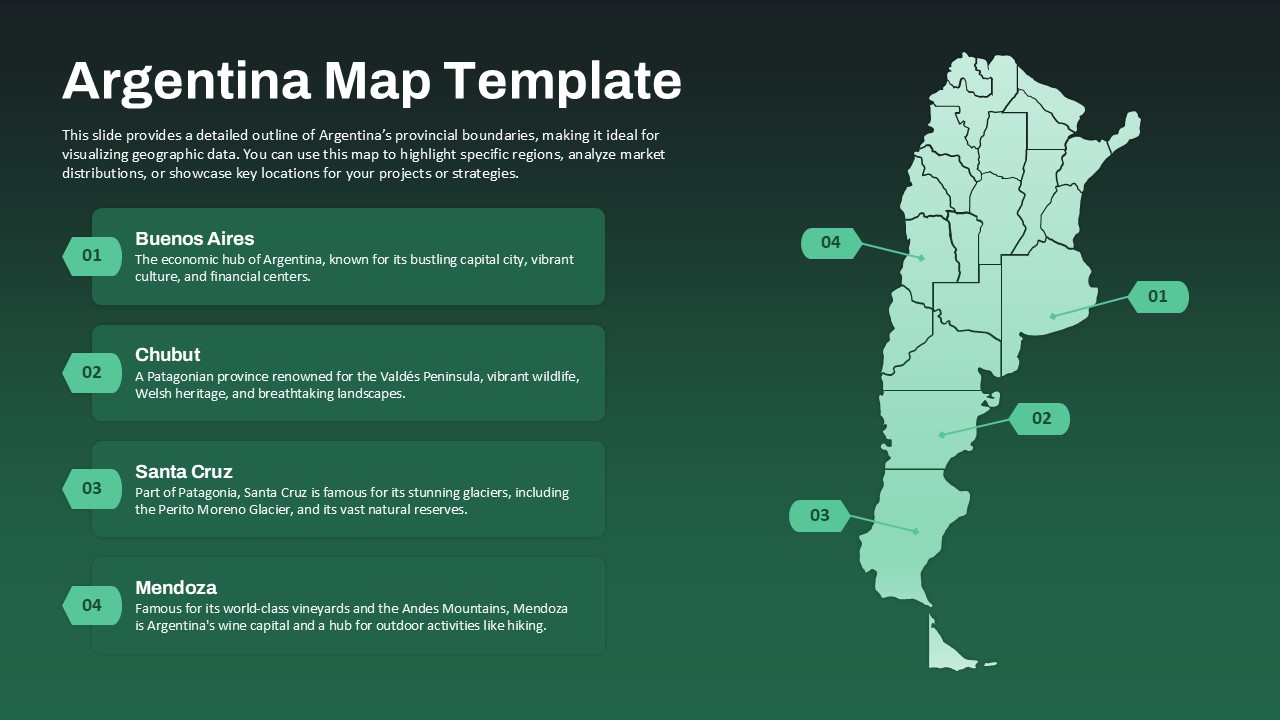
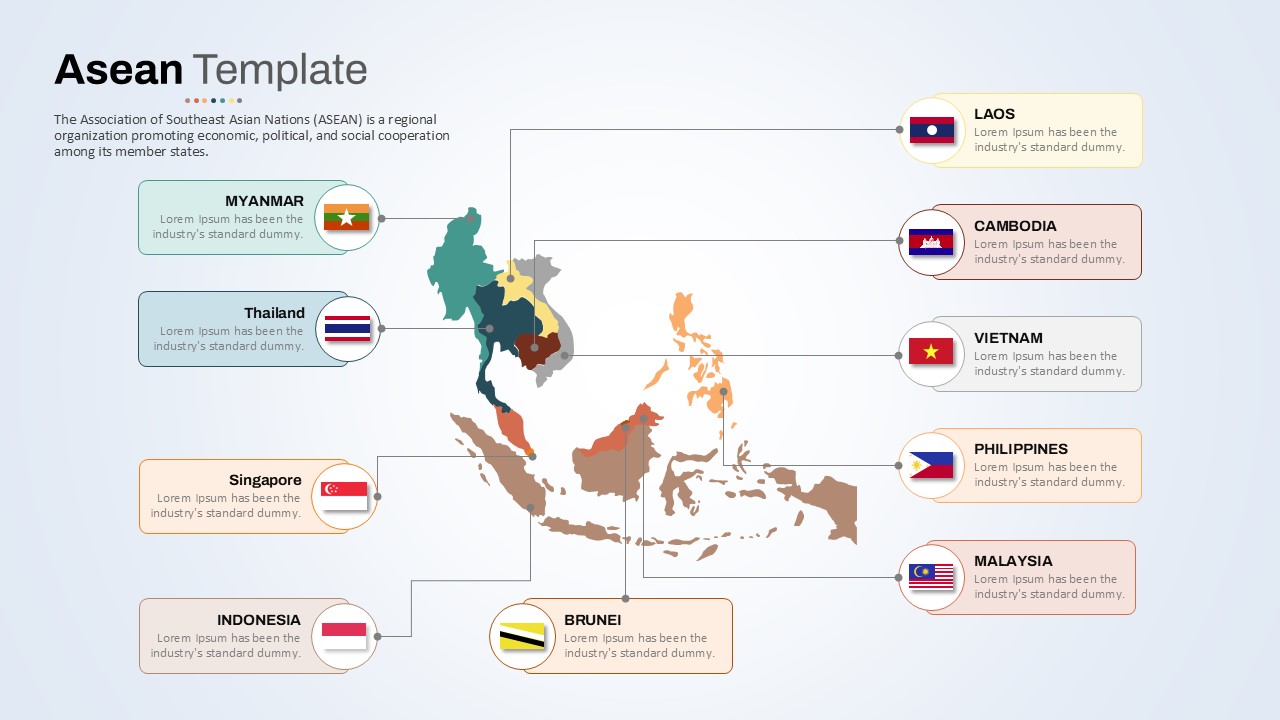
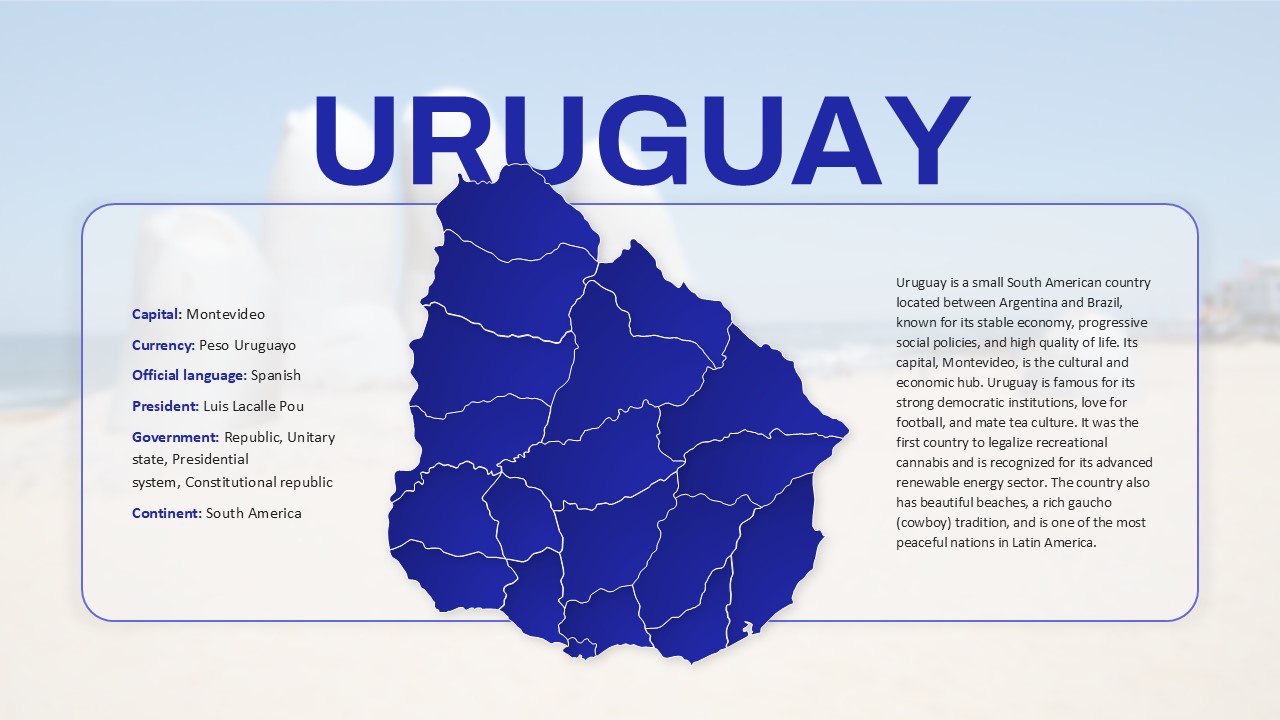
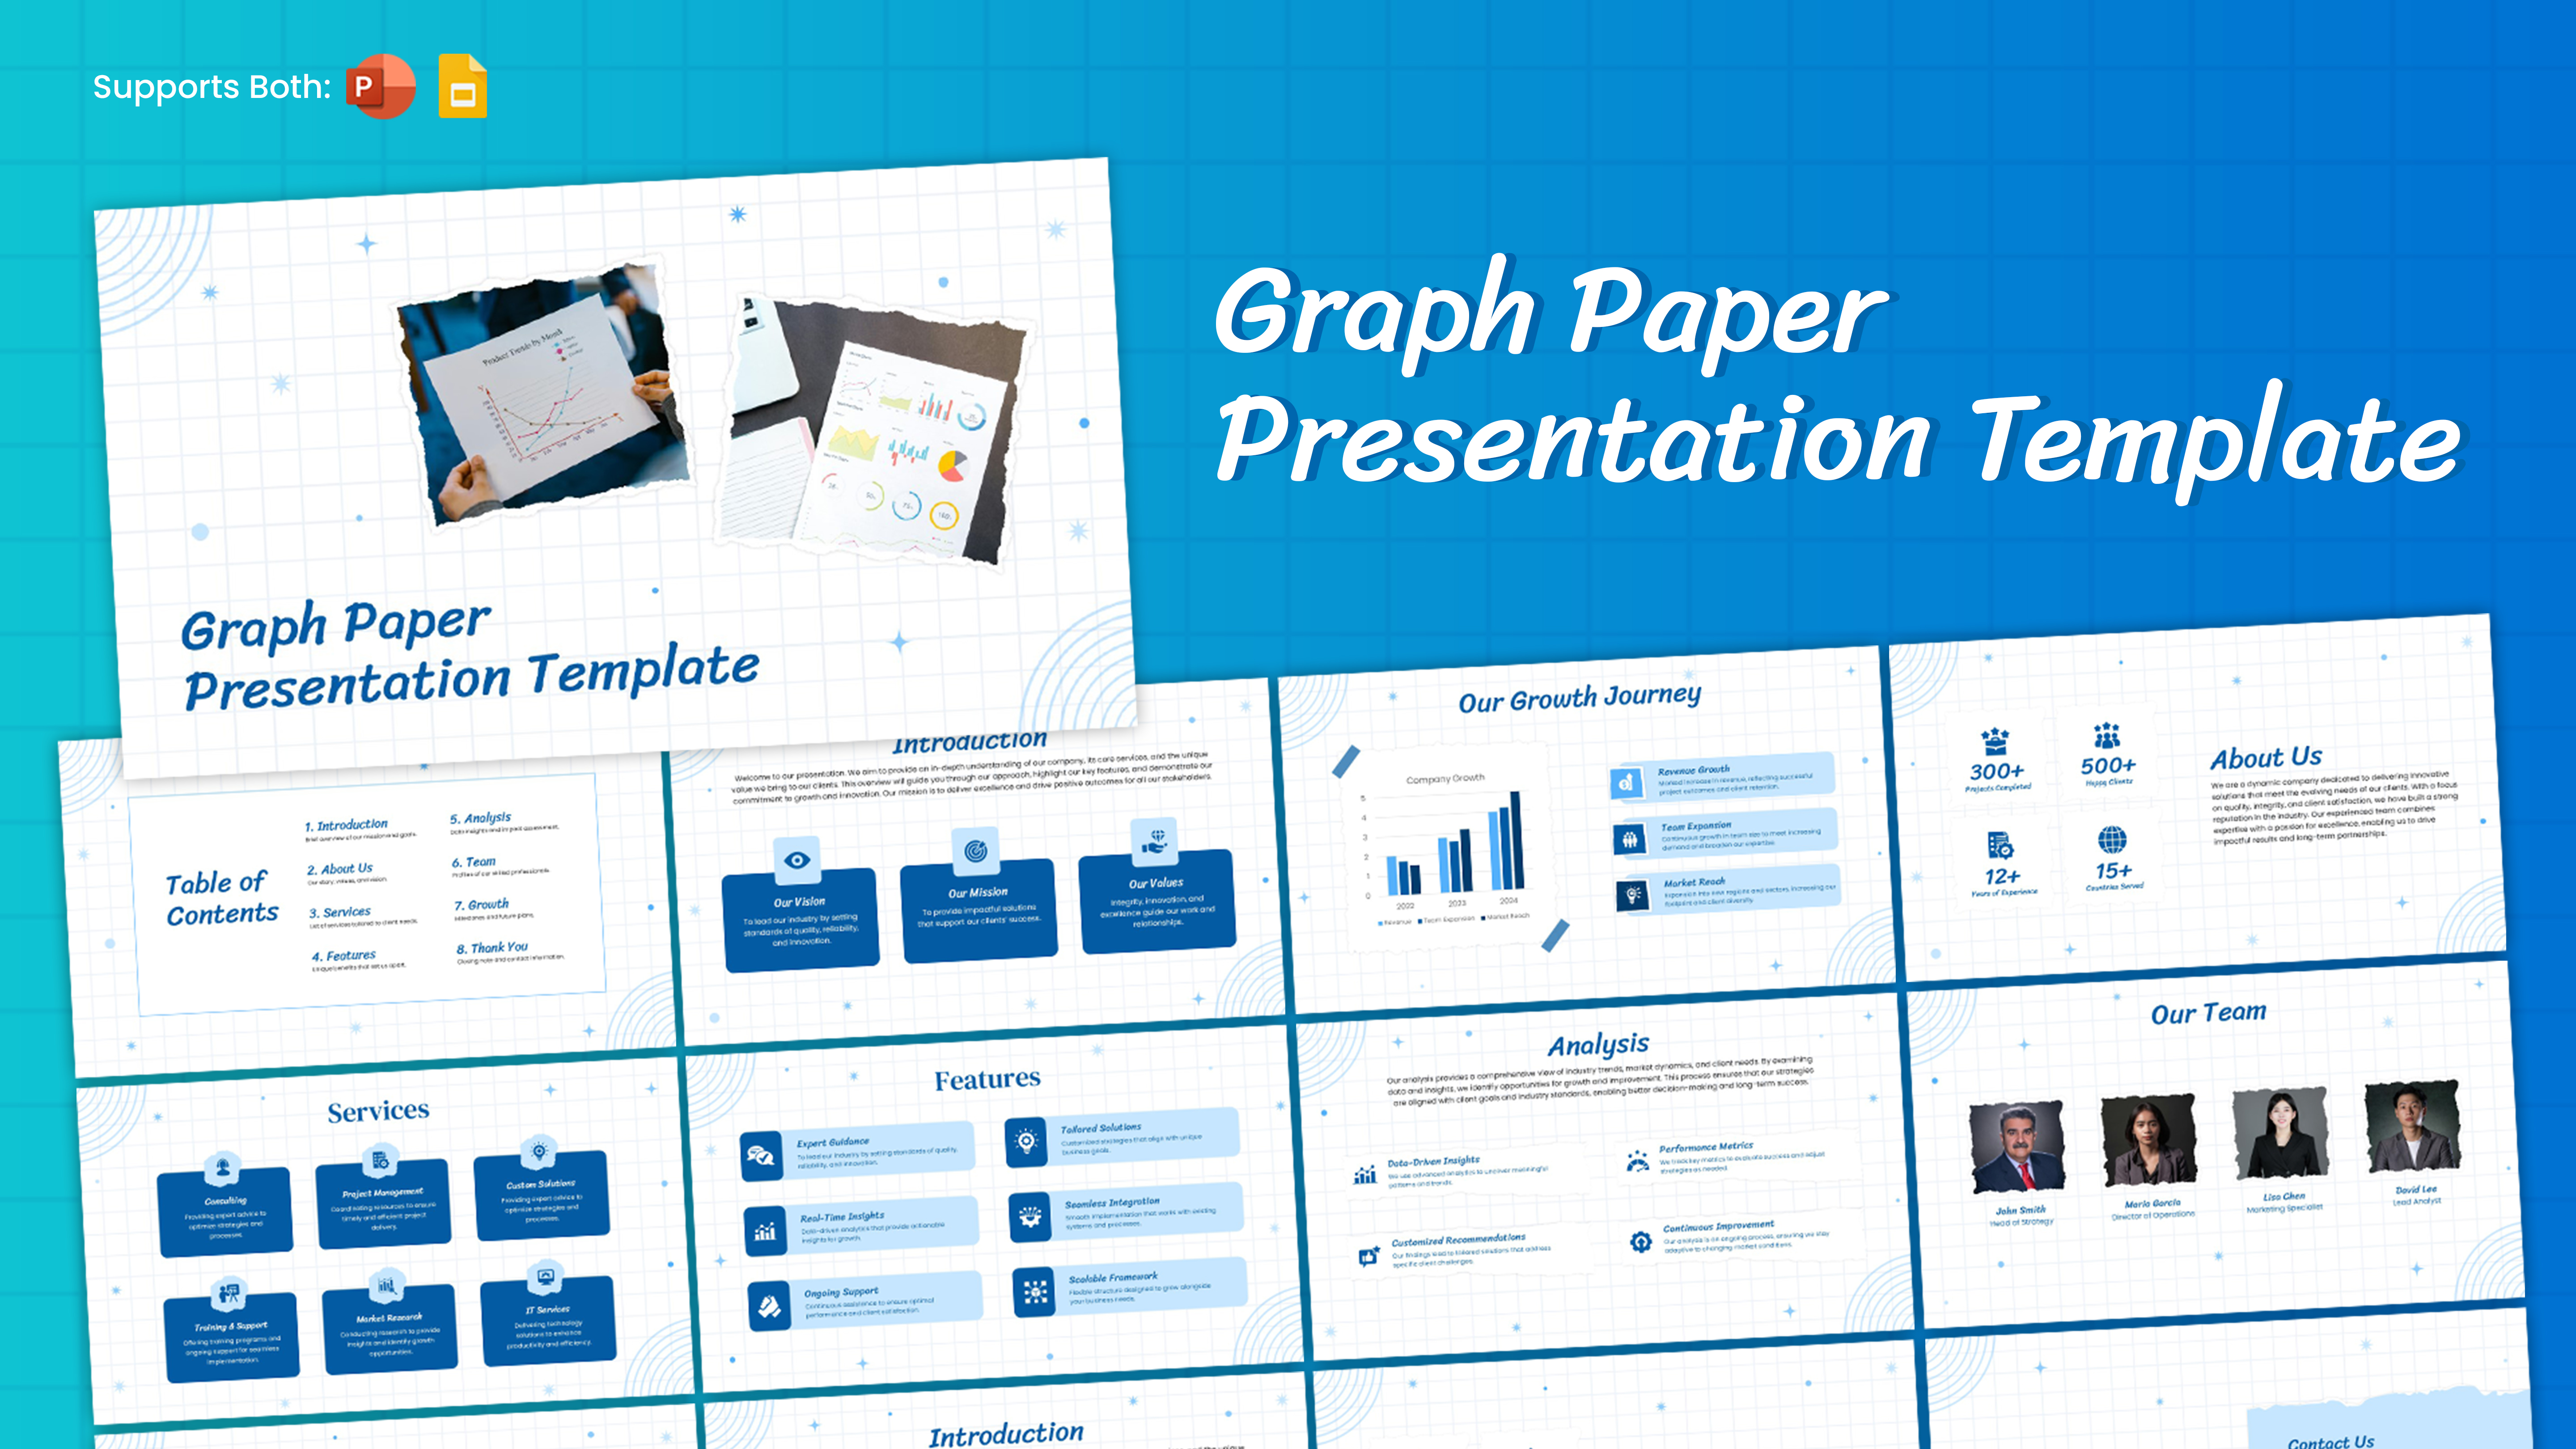
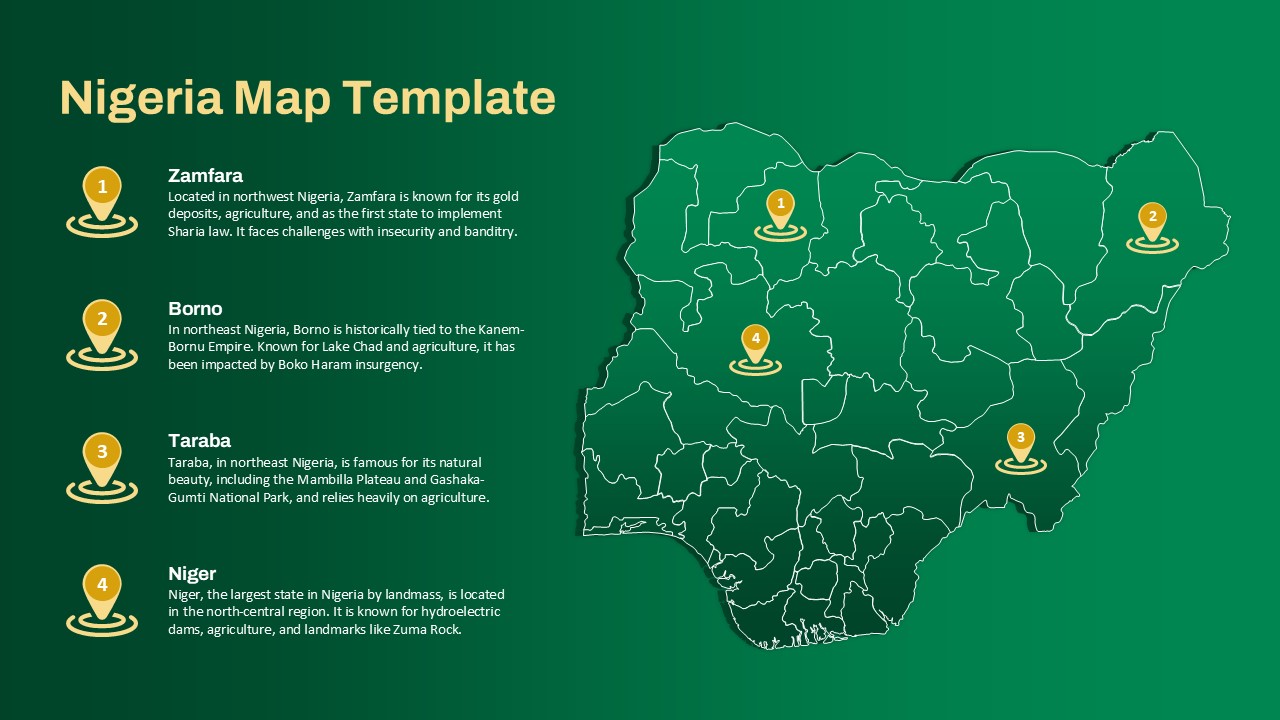
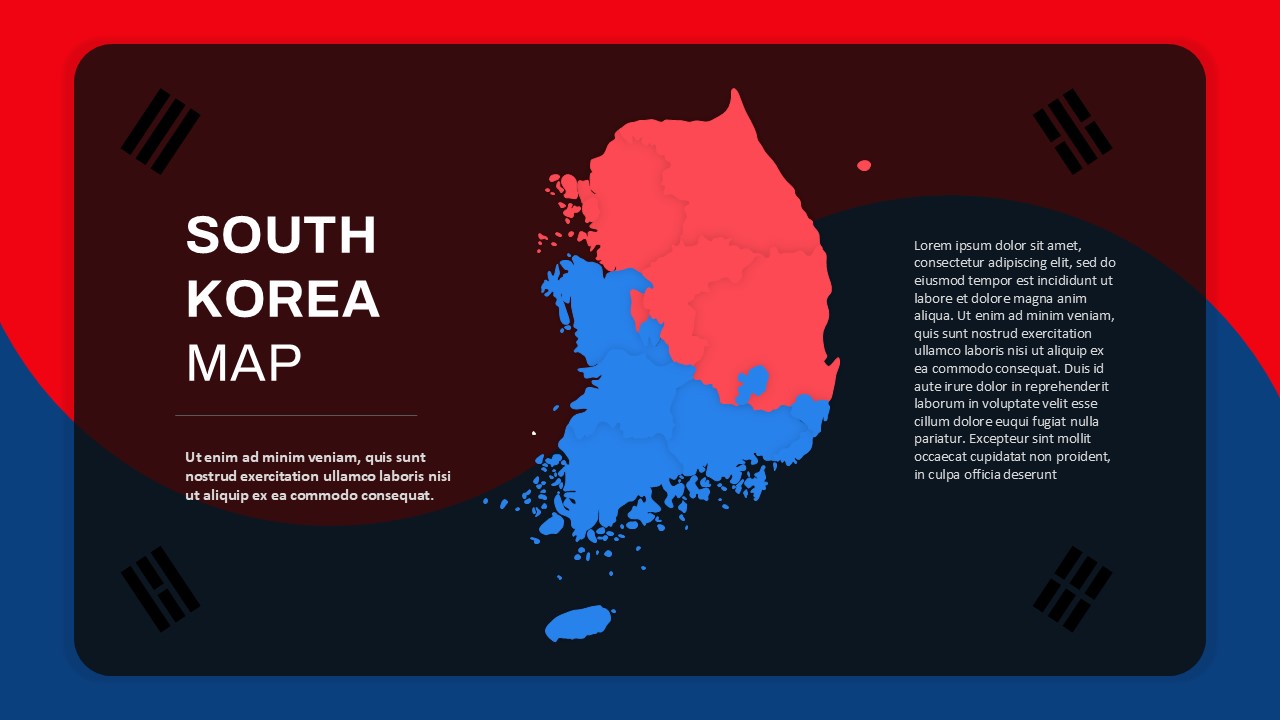
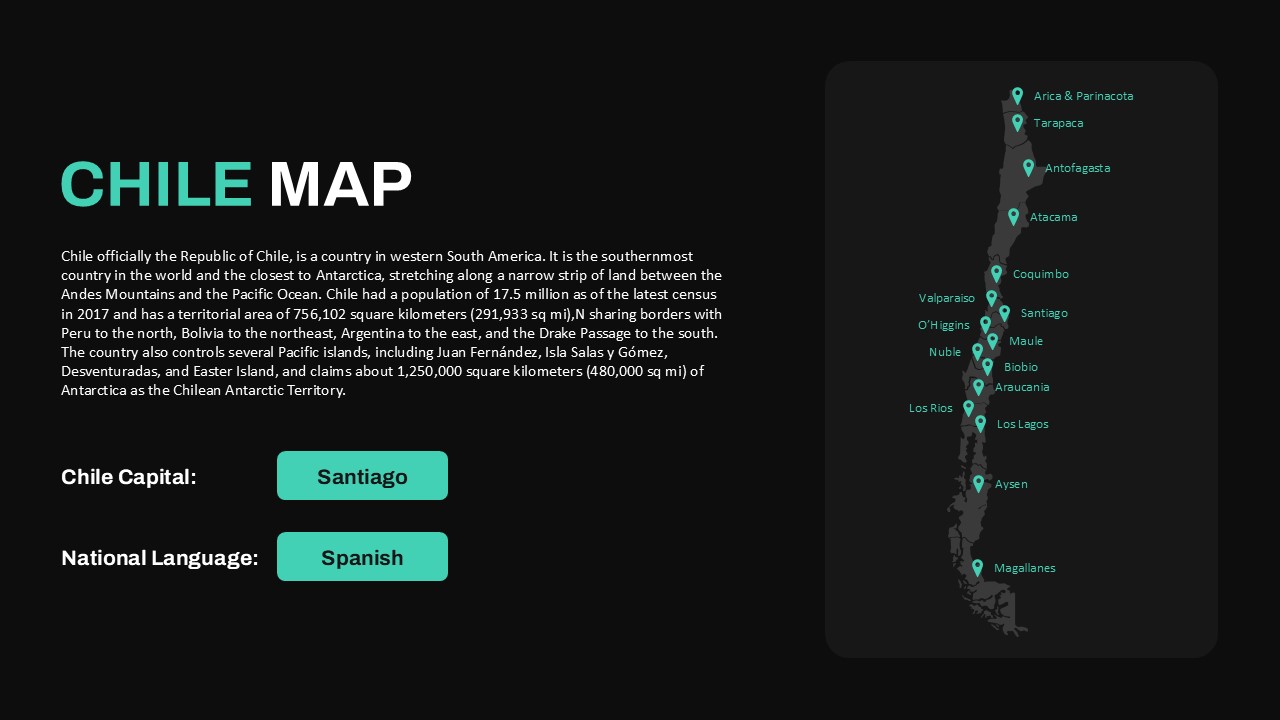
The Paraguay Map Infographic Template for PowerPoint and Google Slides is a dynamic and informative presentation design, ideal for visualizing demographic data, regional statistics, and geographic insights related to Paraguay. Featuring a detailed map of the country, highlighted with contrasting red and blue colors, this template is perfect for researchers, business analysts, government officials, and educators.
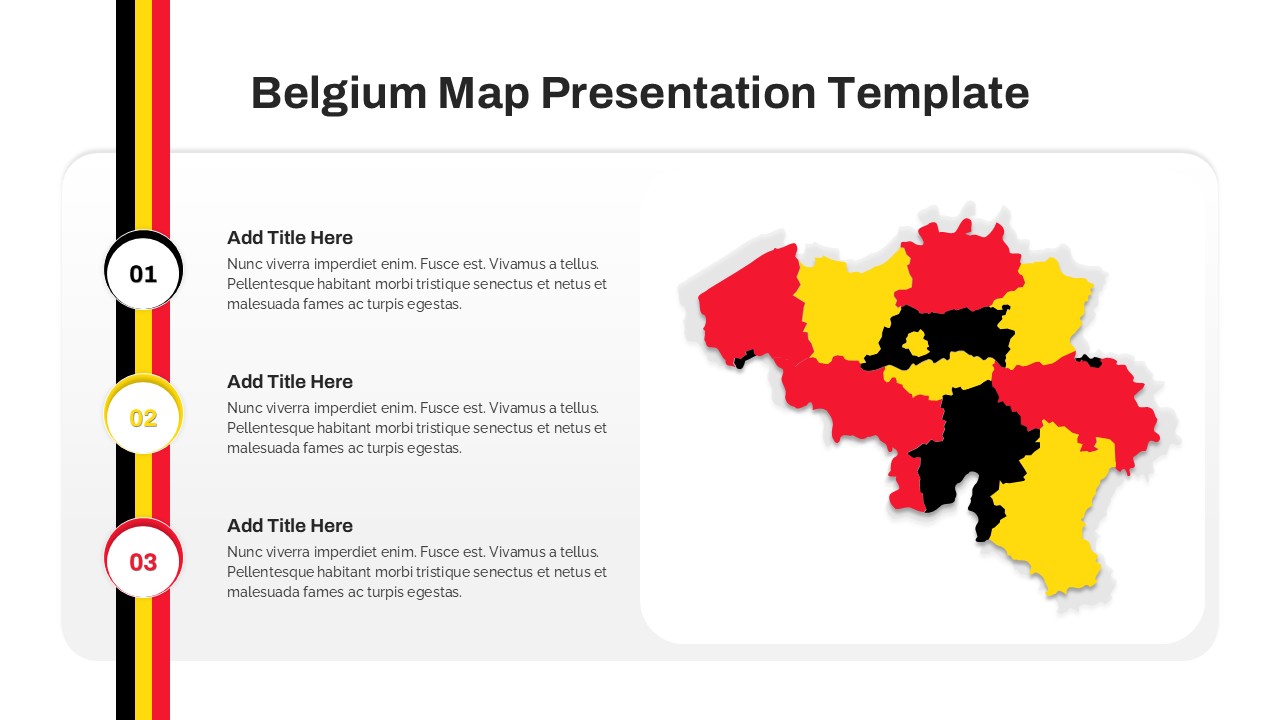
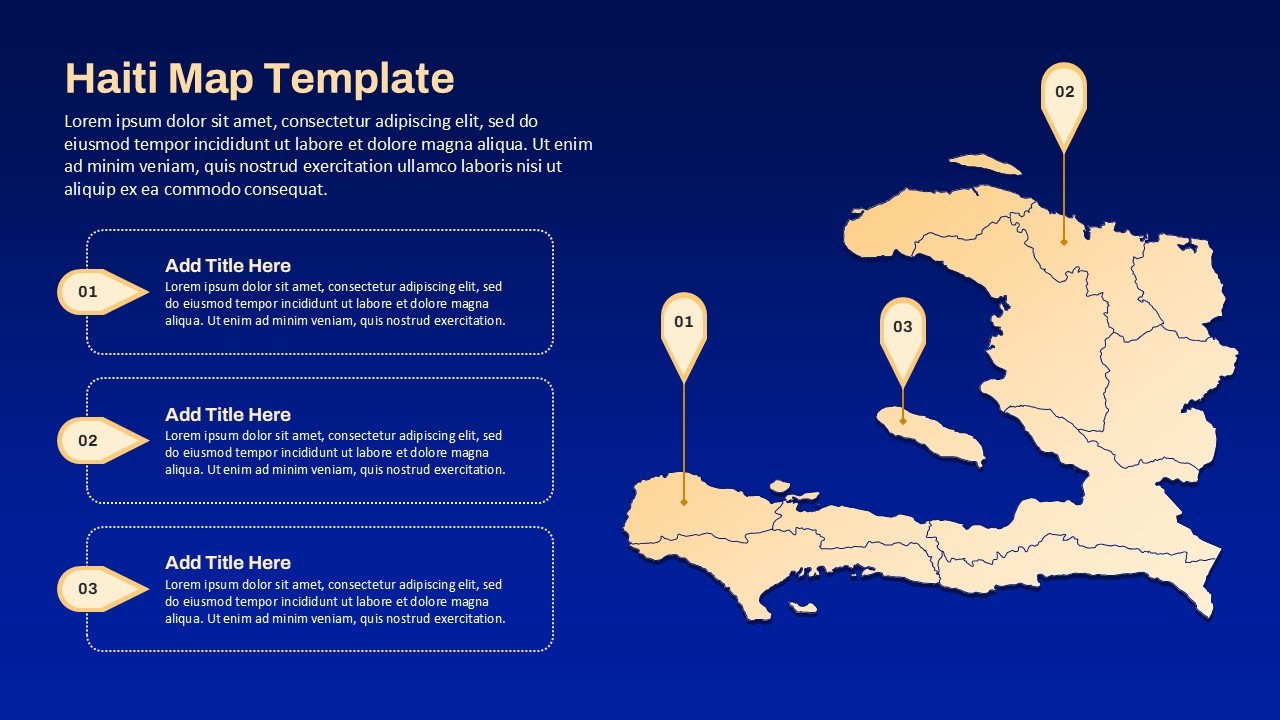
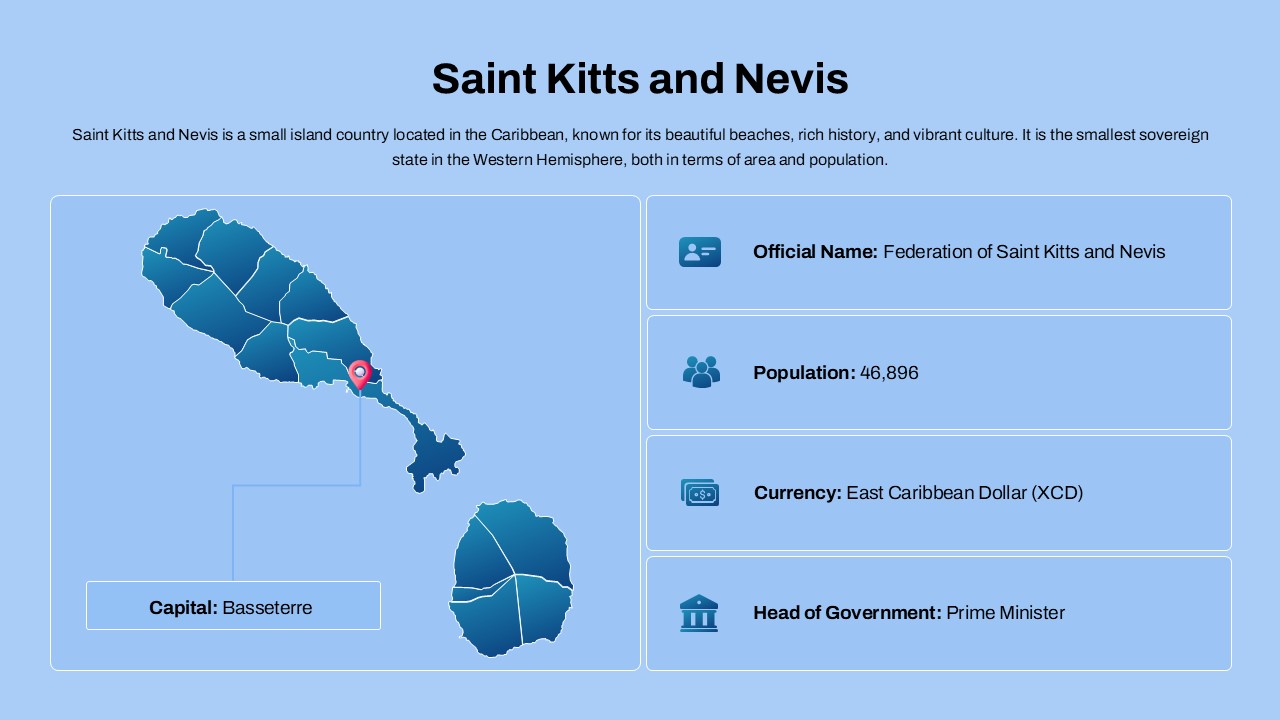
The layout includes:
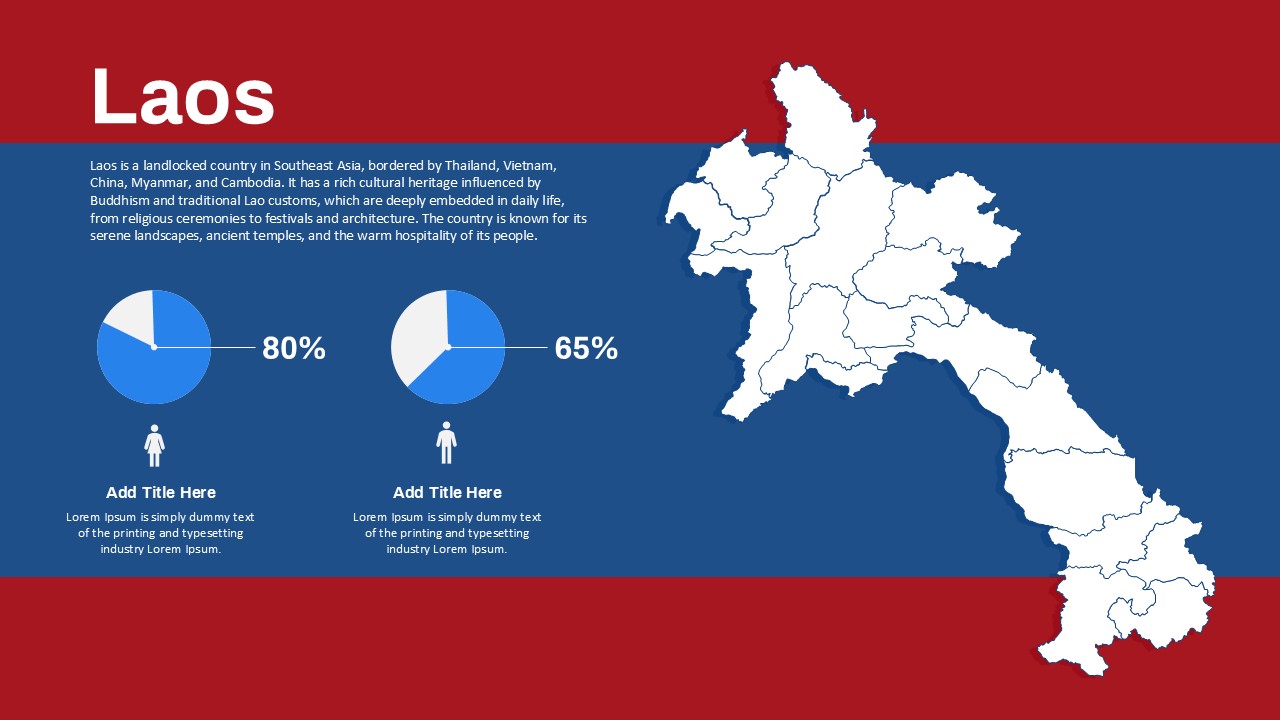
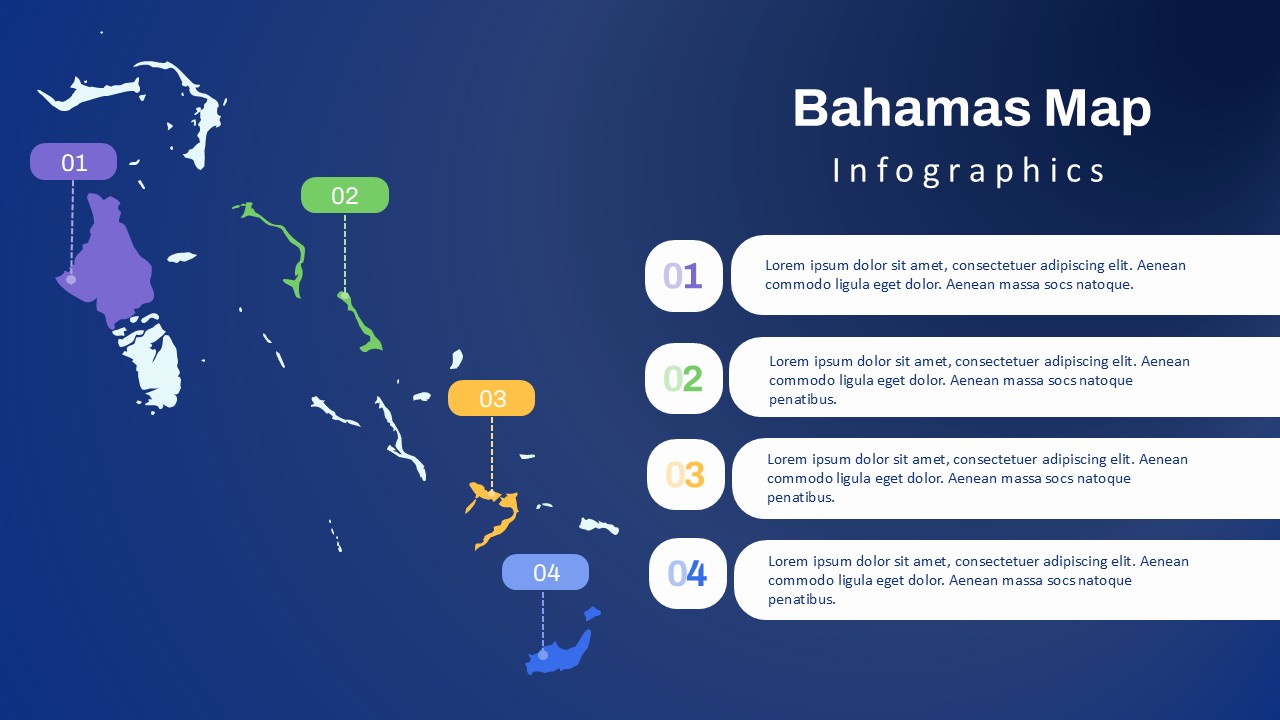
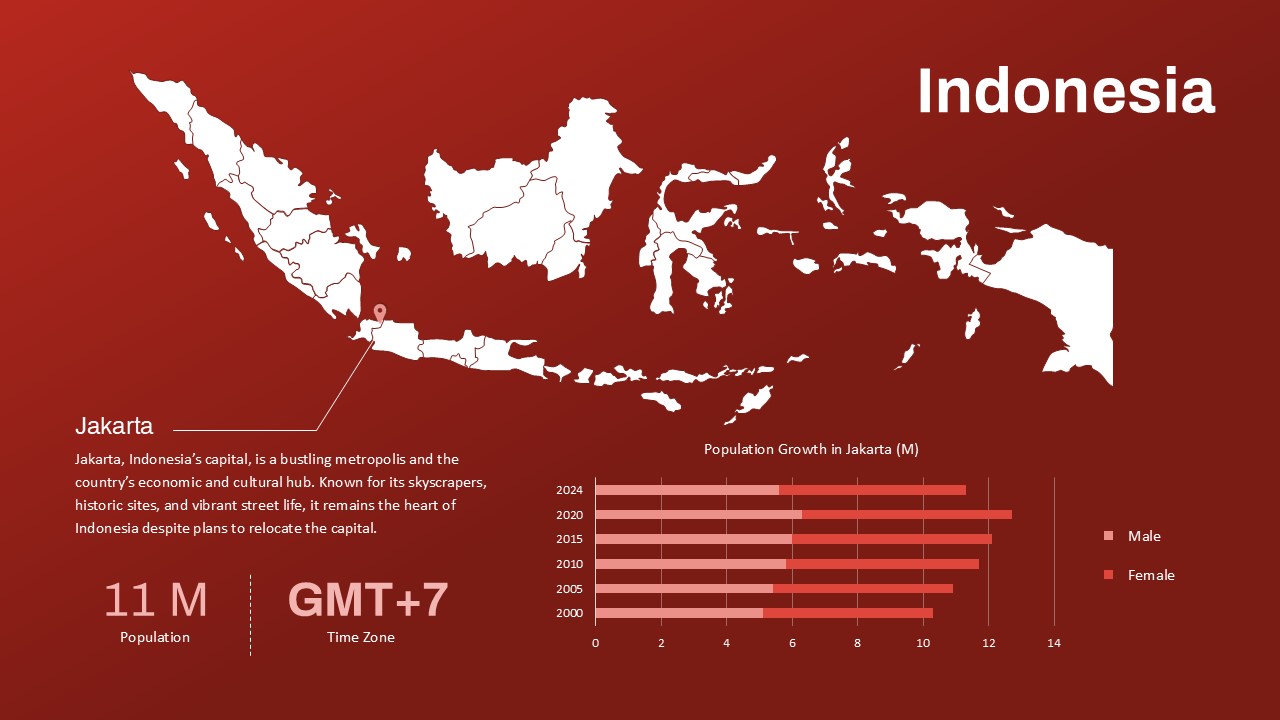
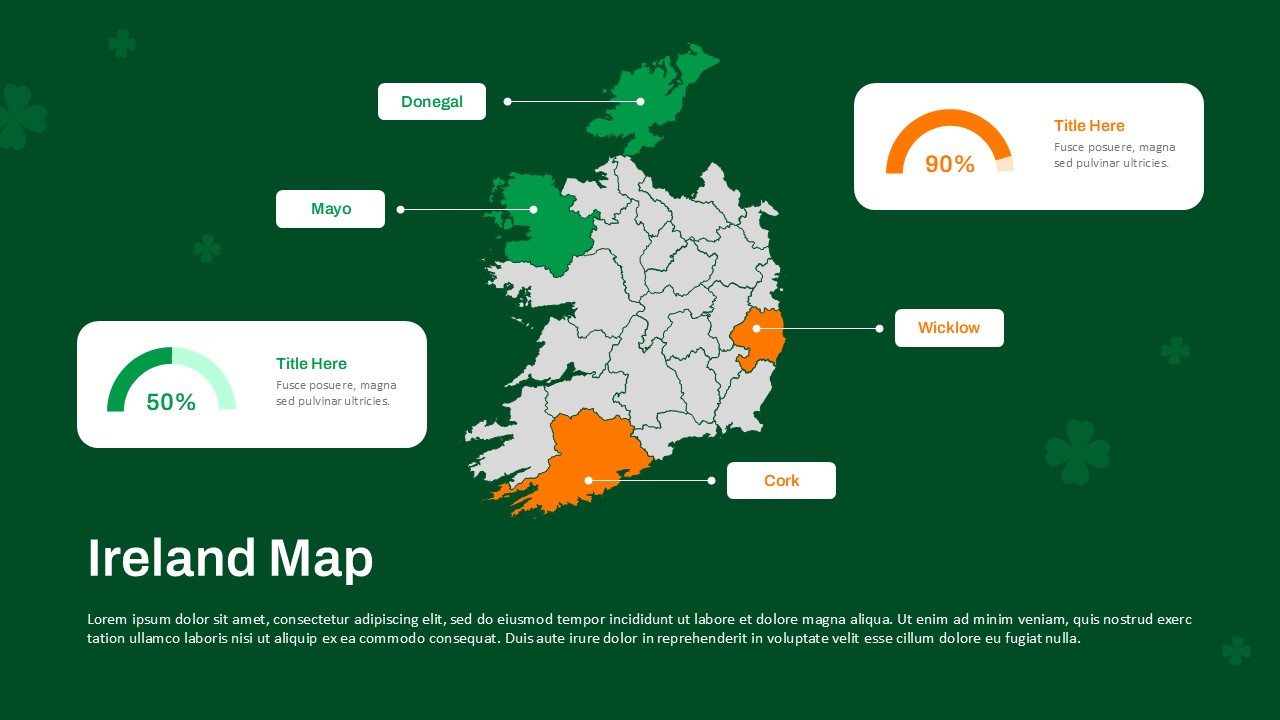
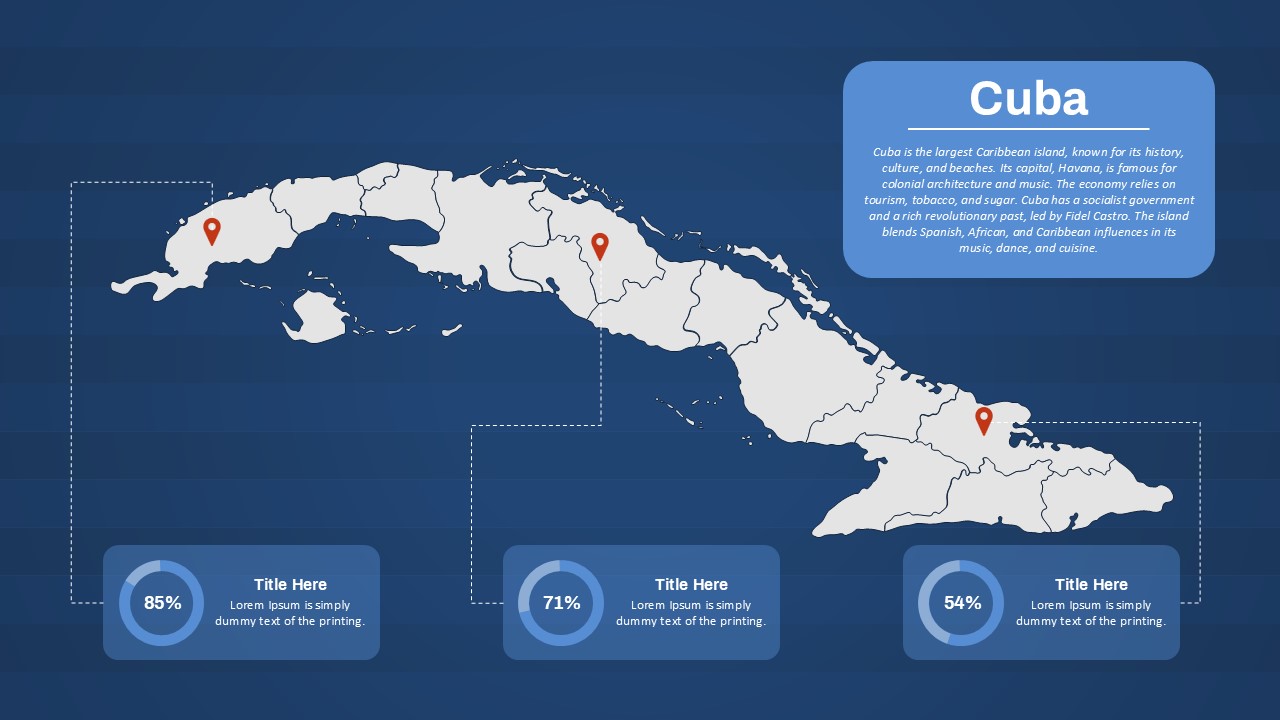
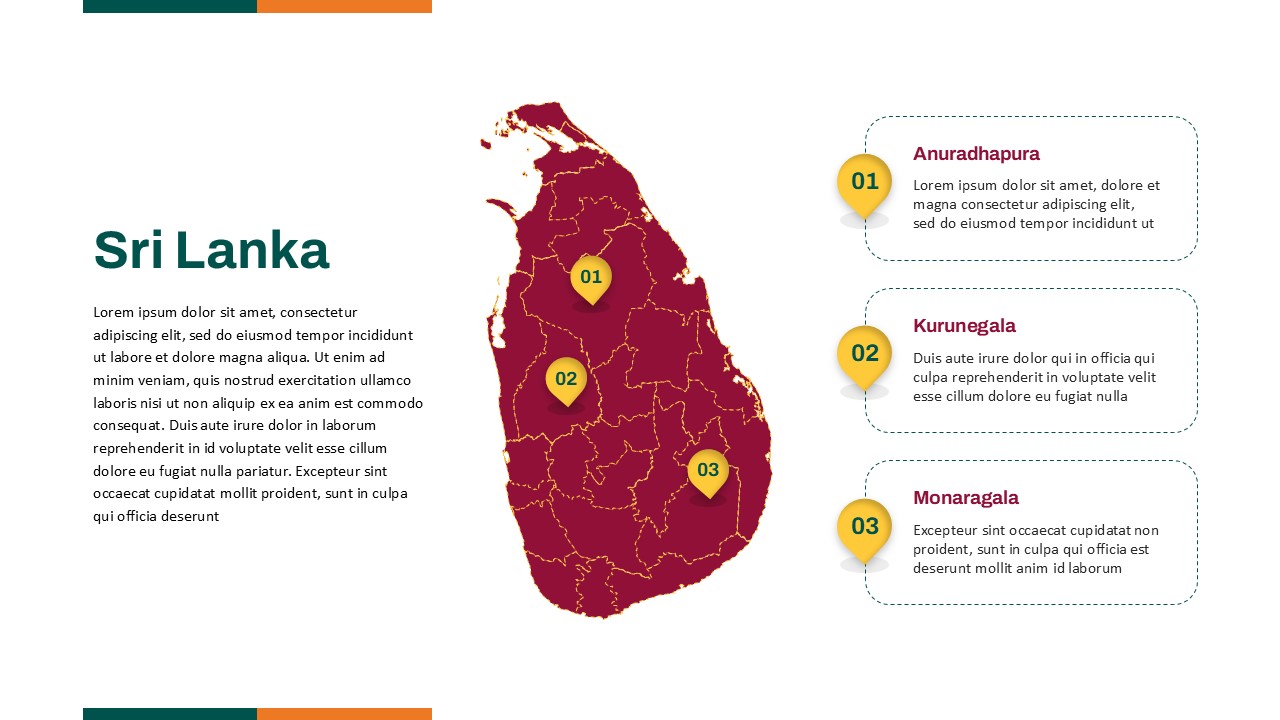
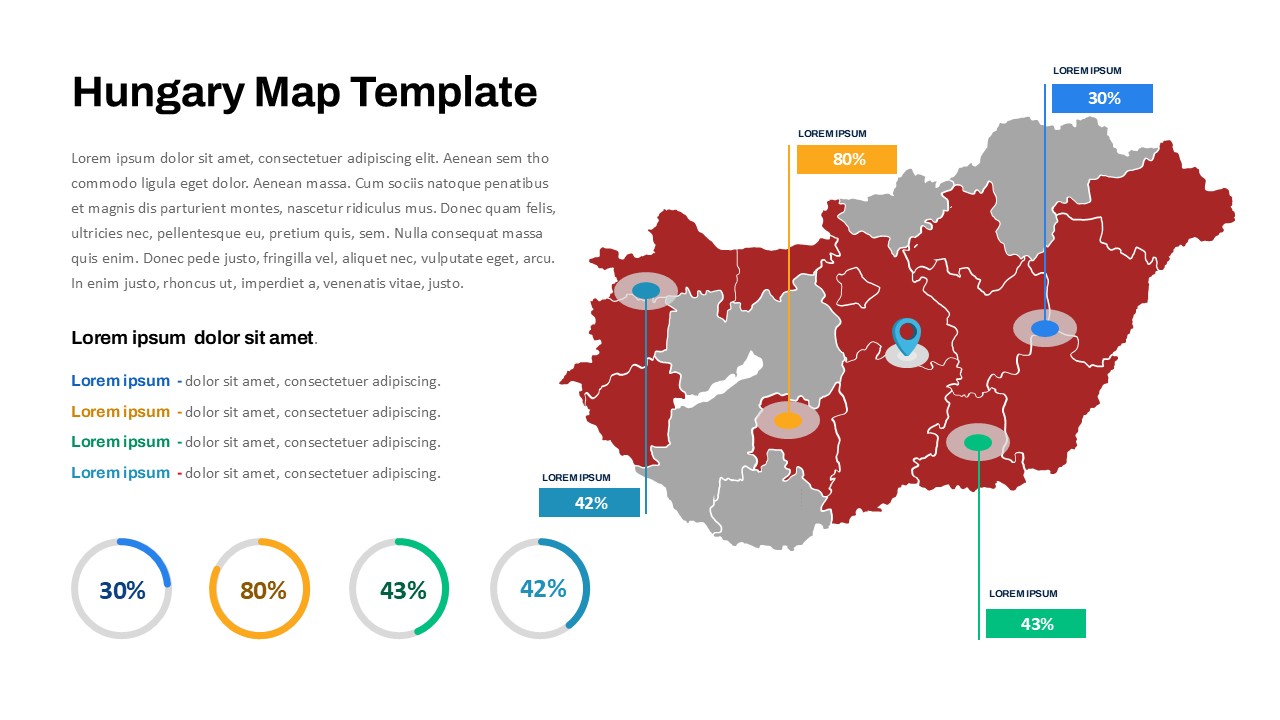
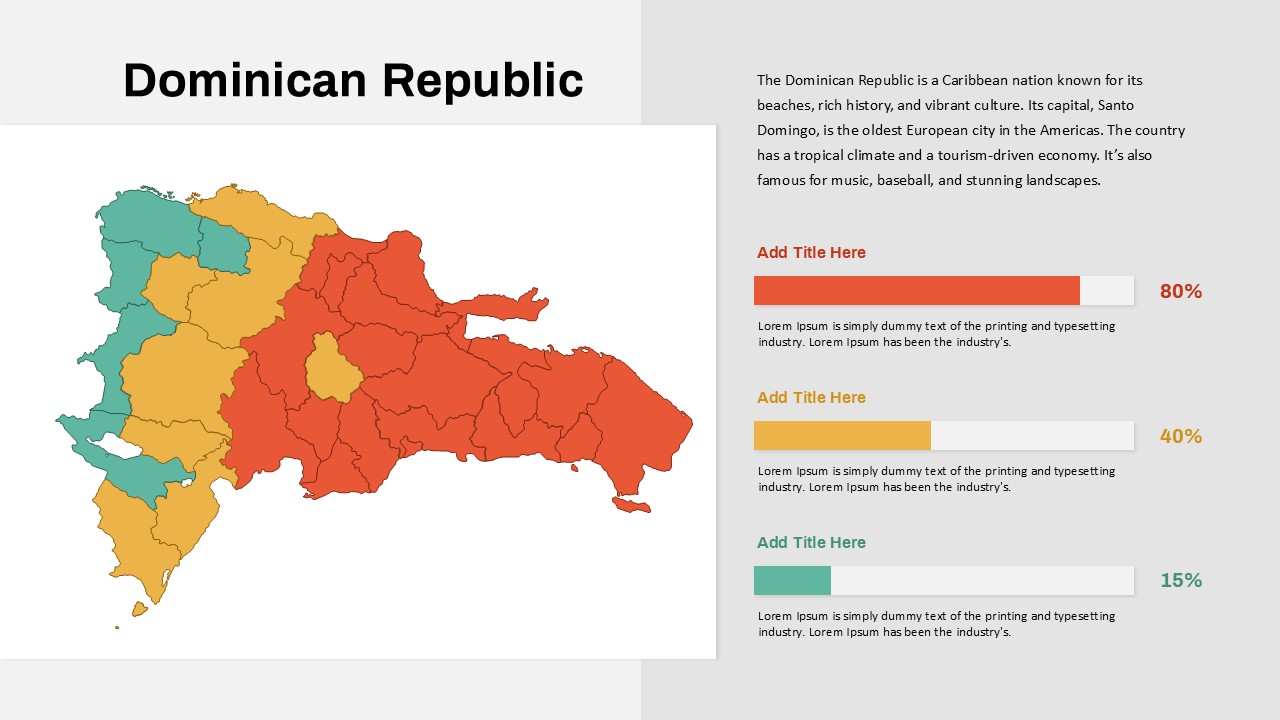
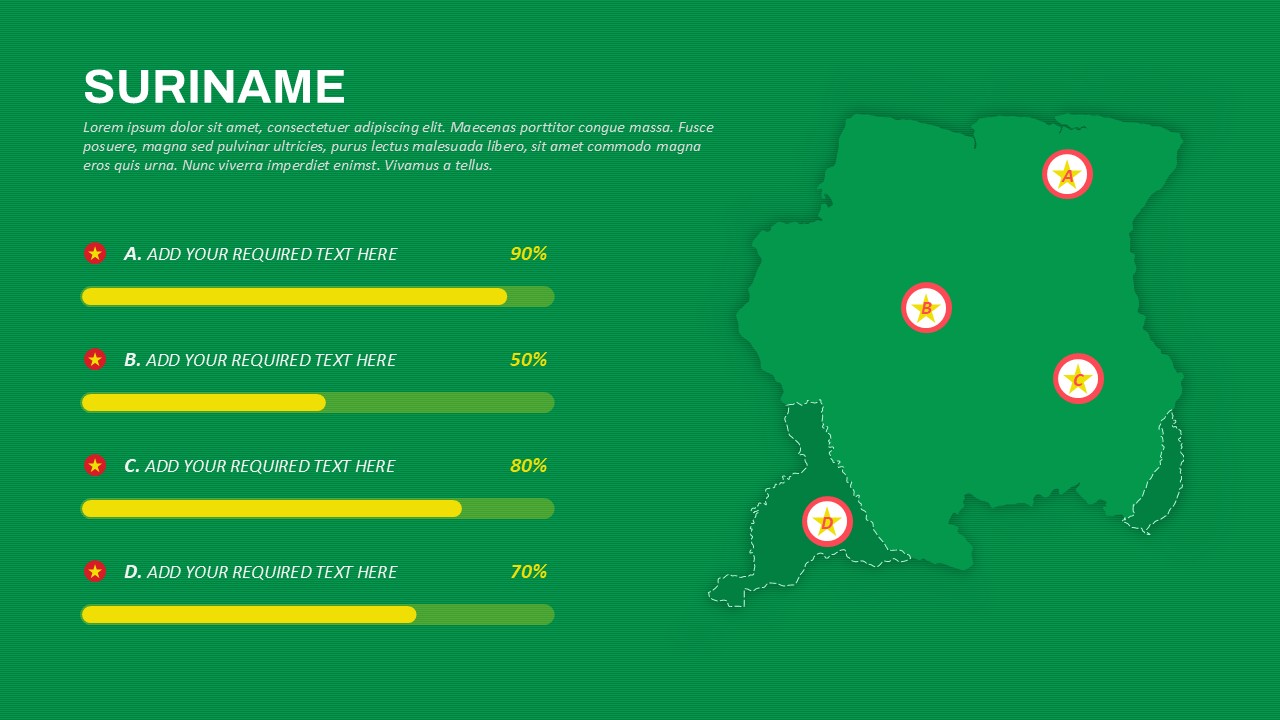
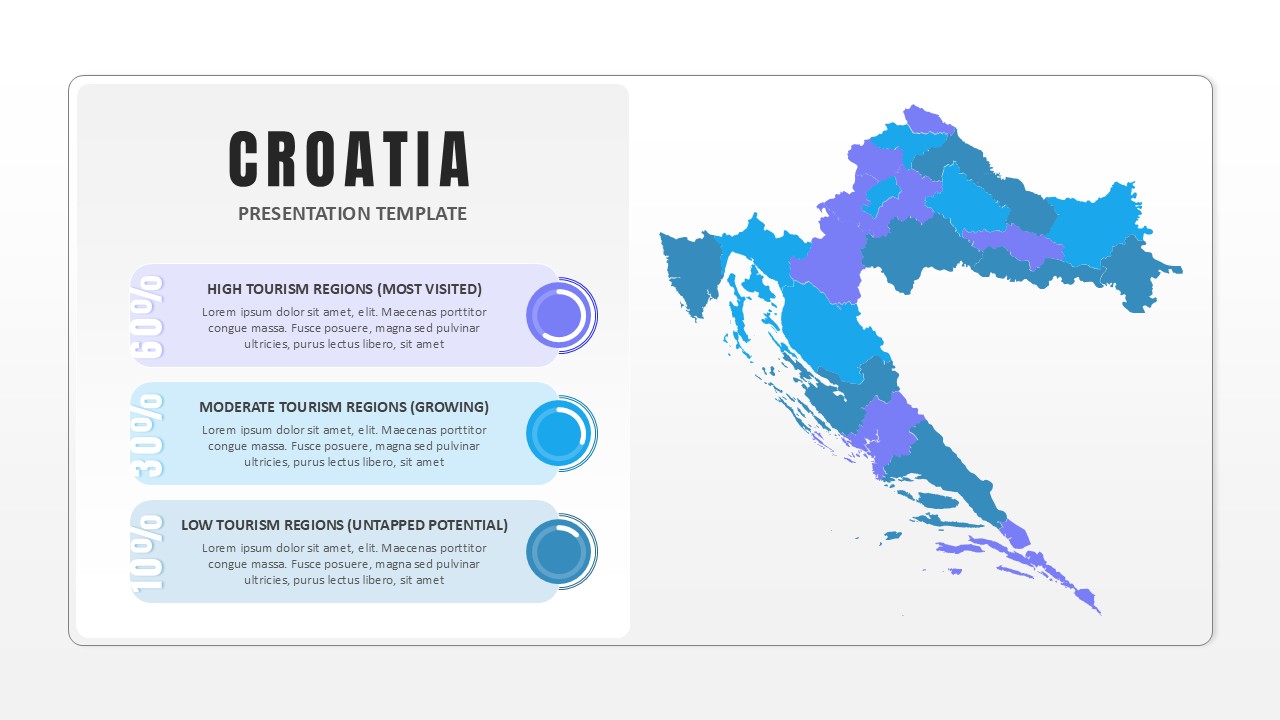
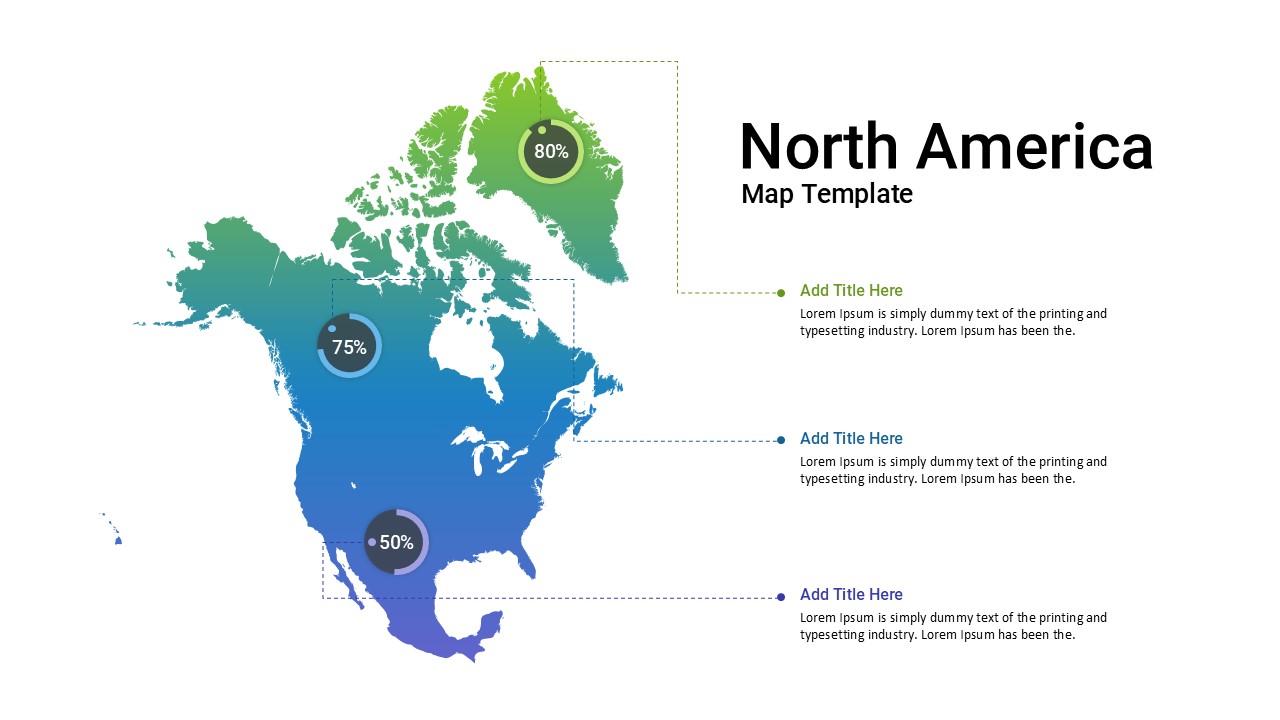
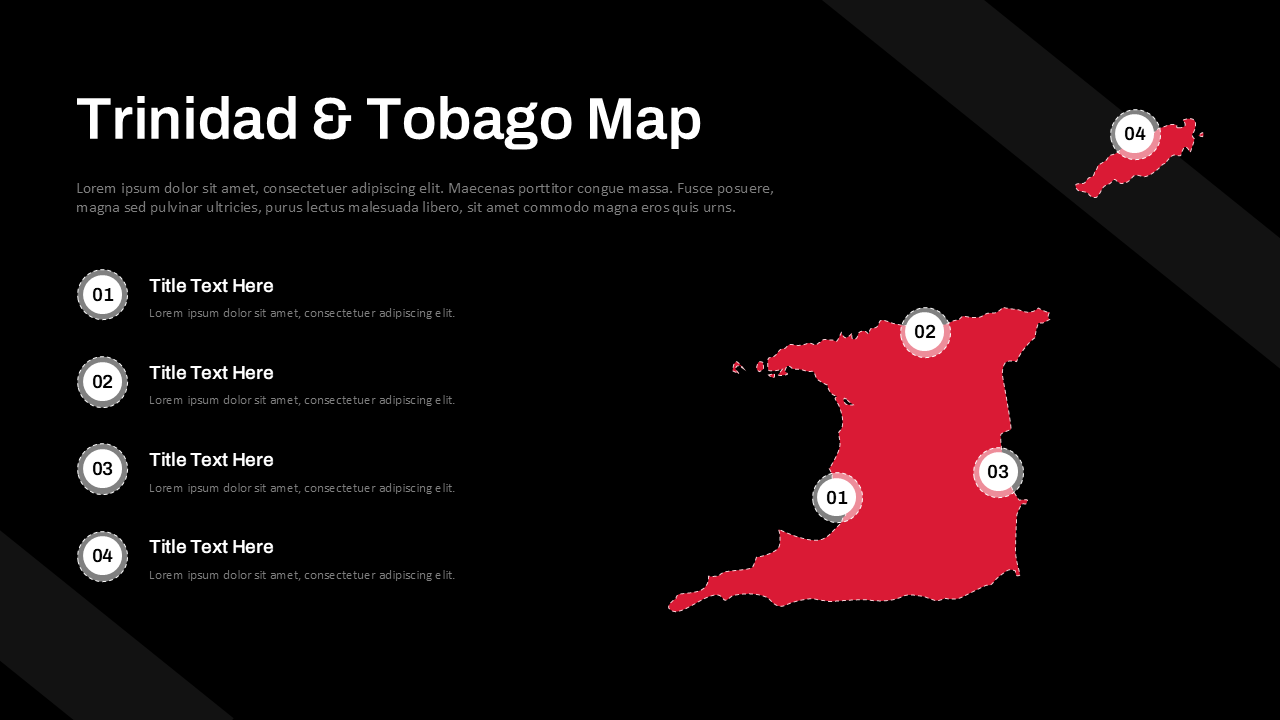
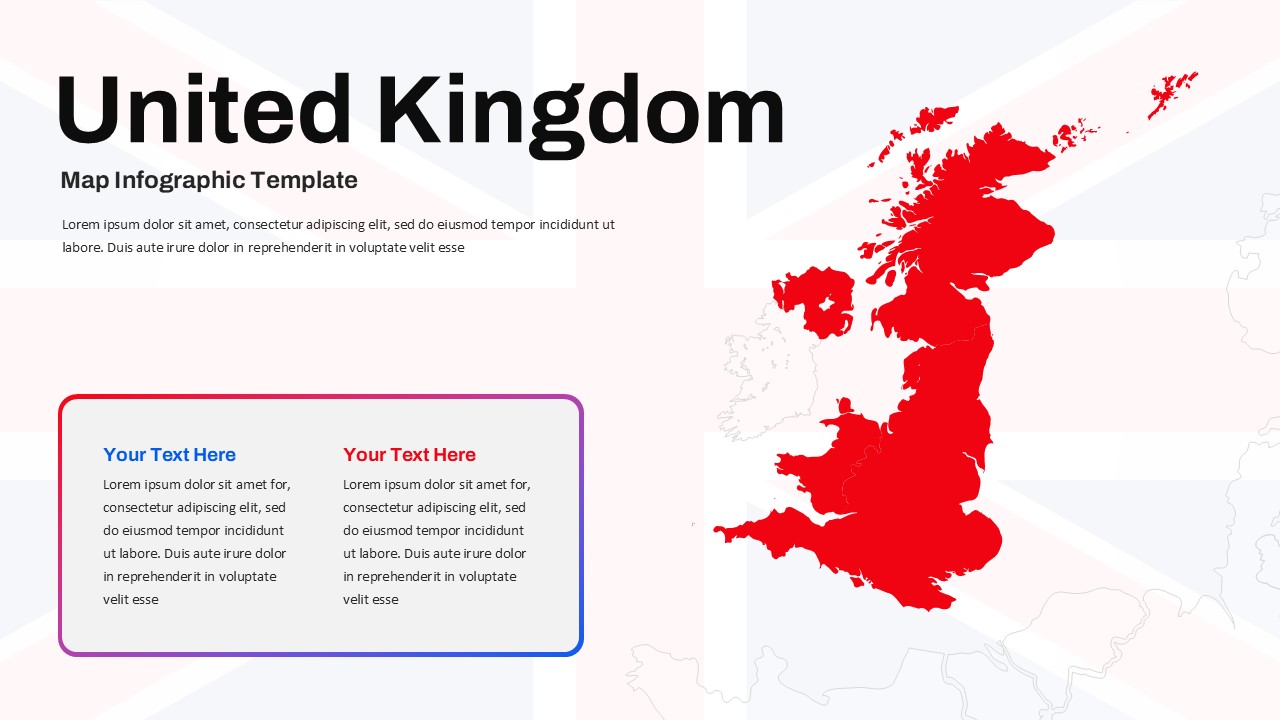
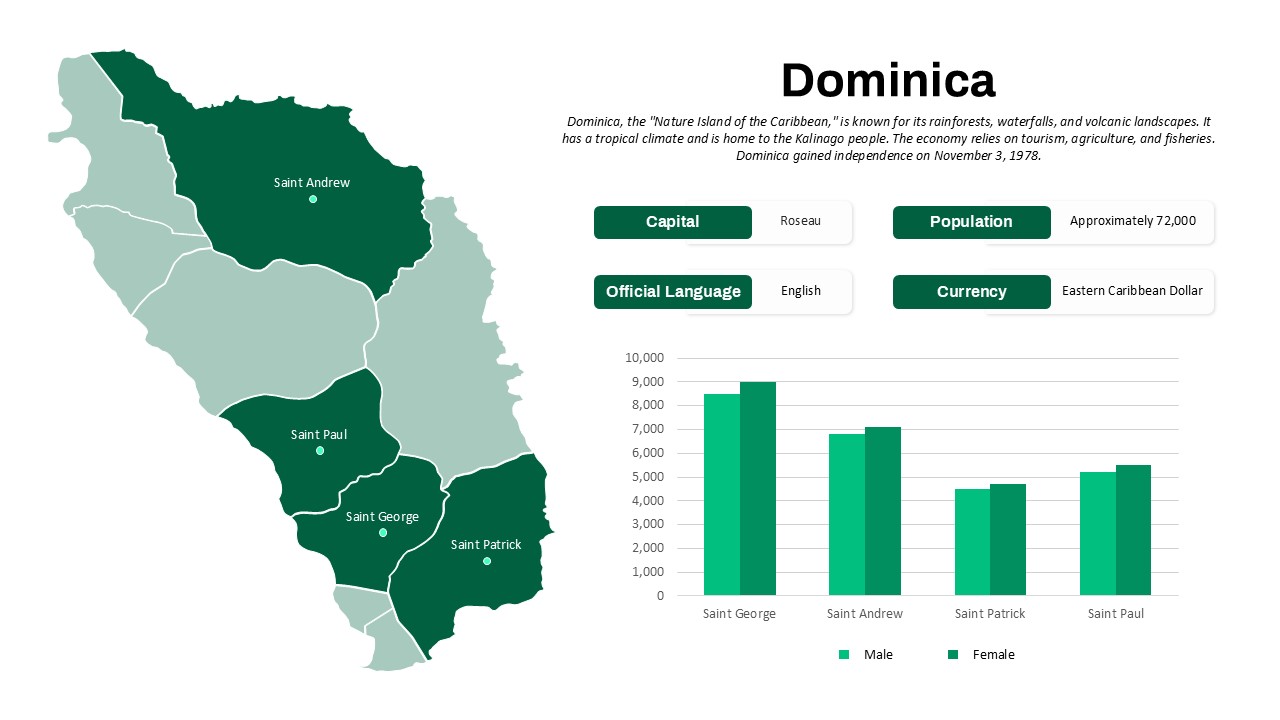
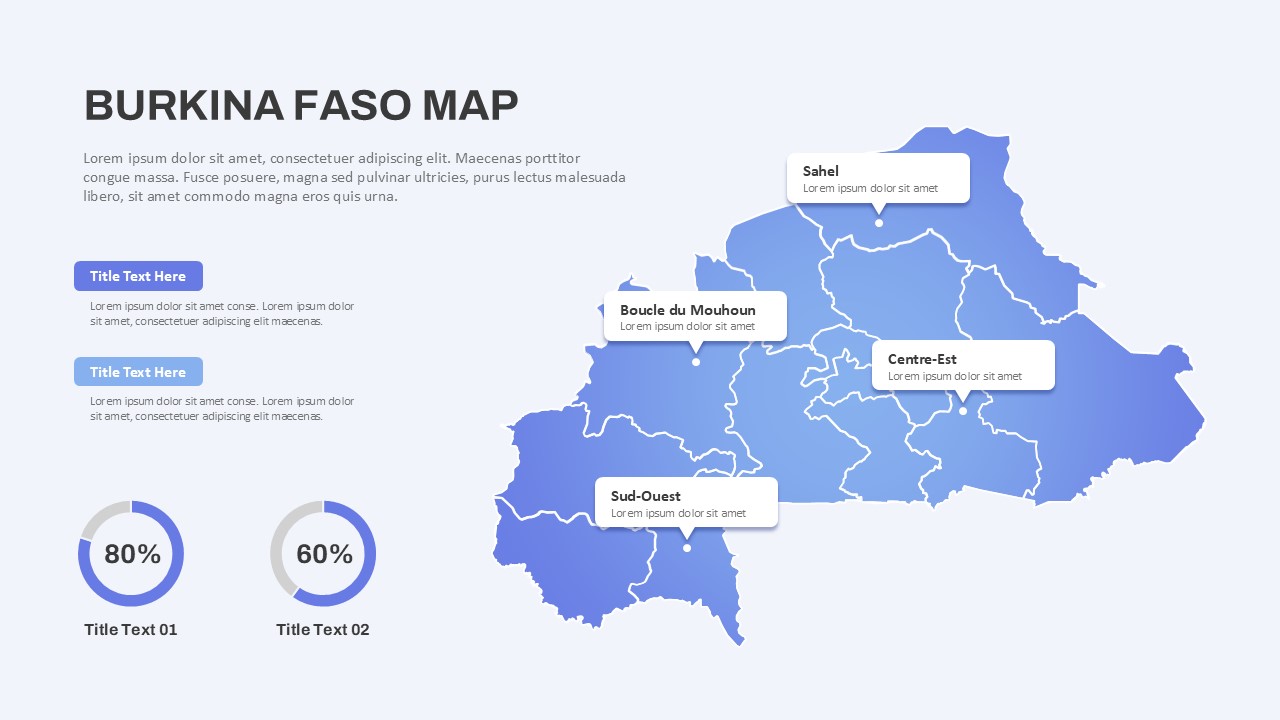
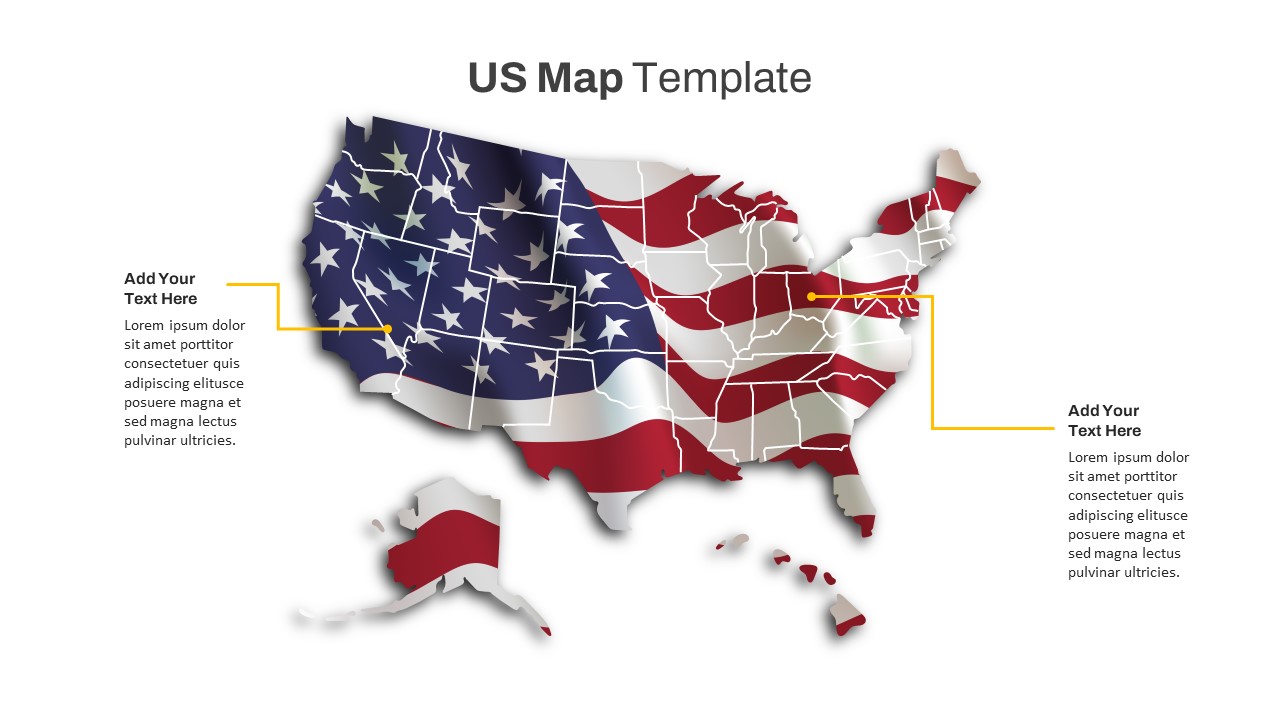
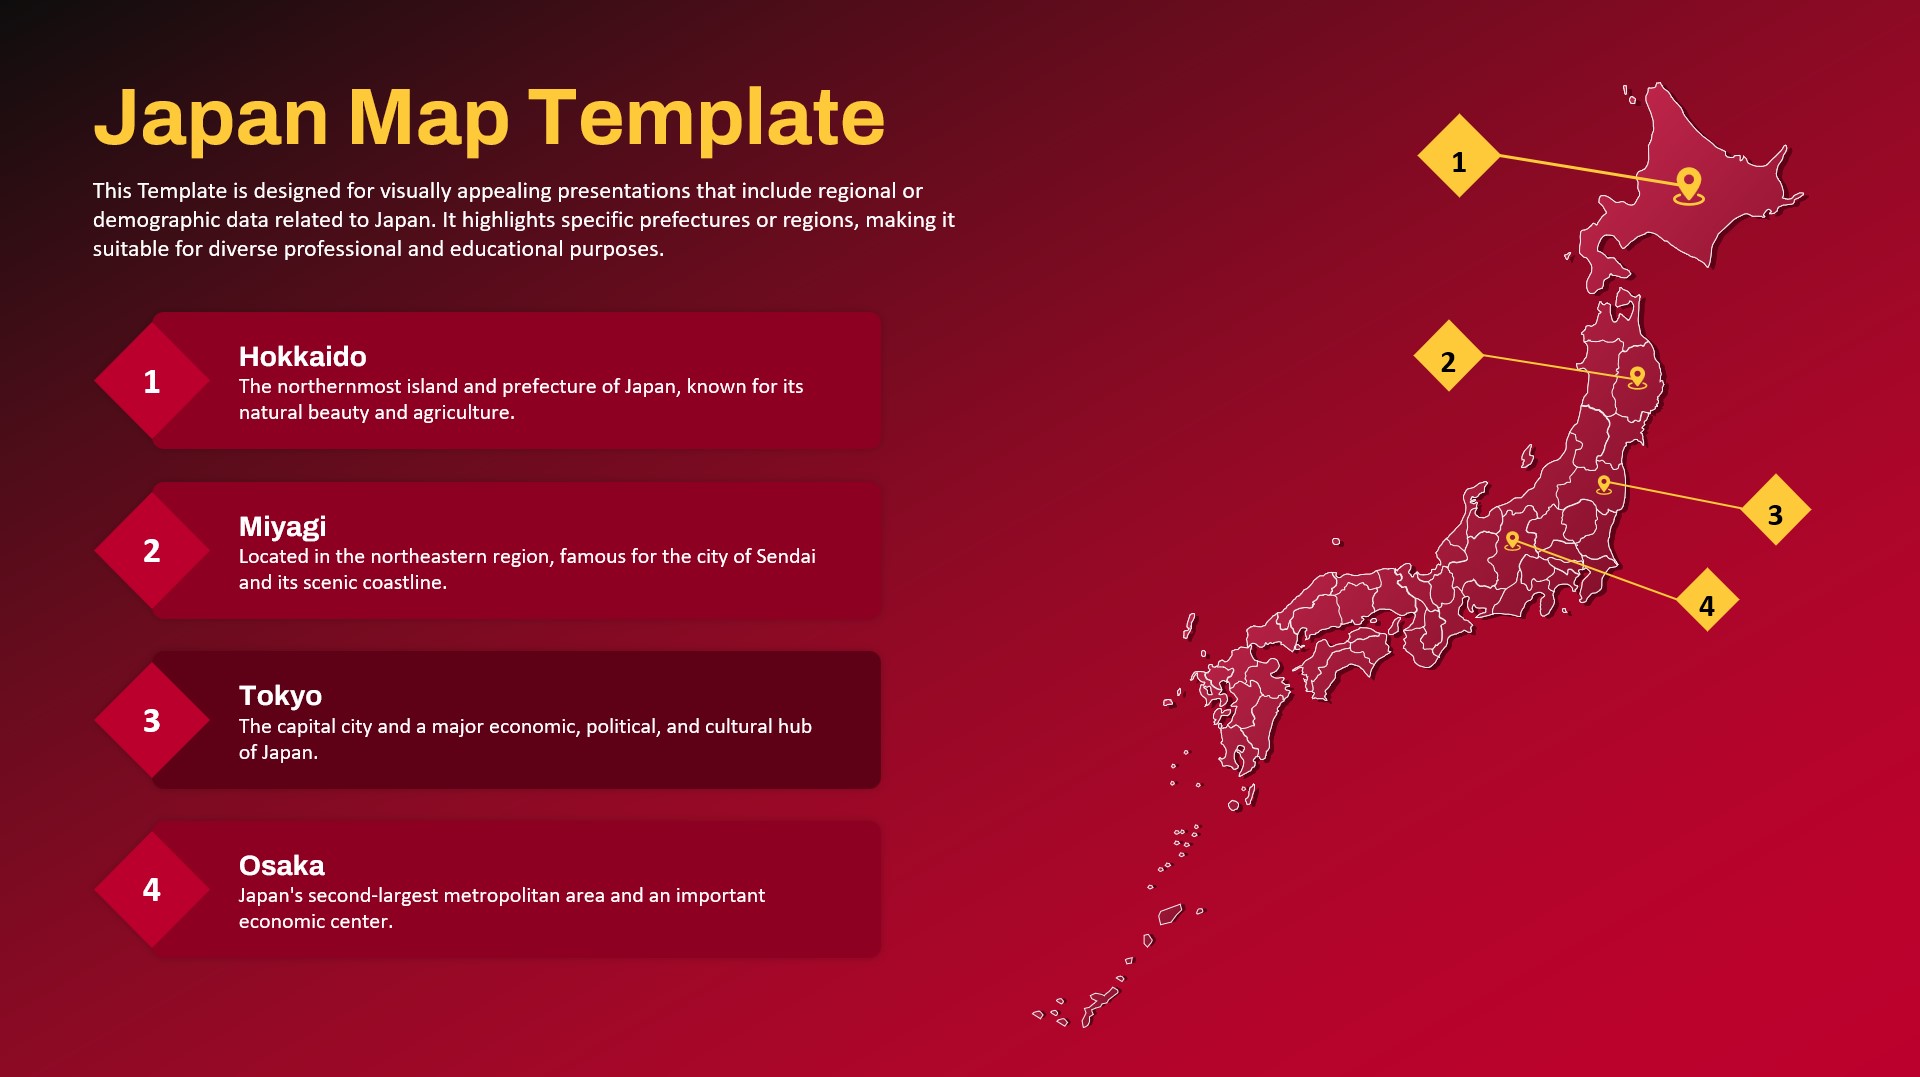
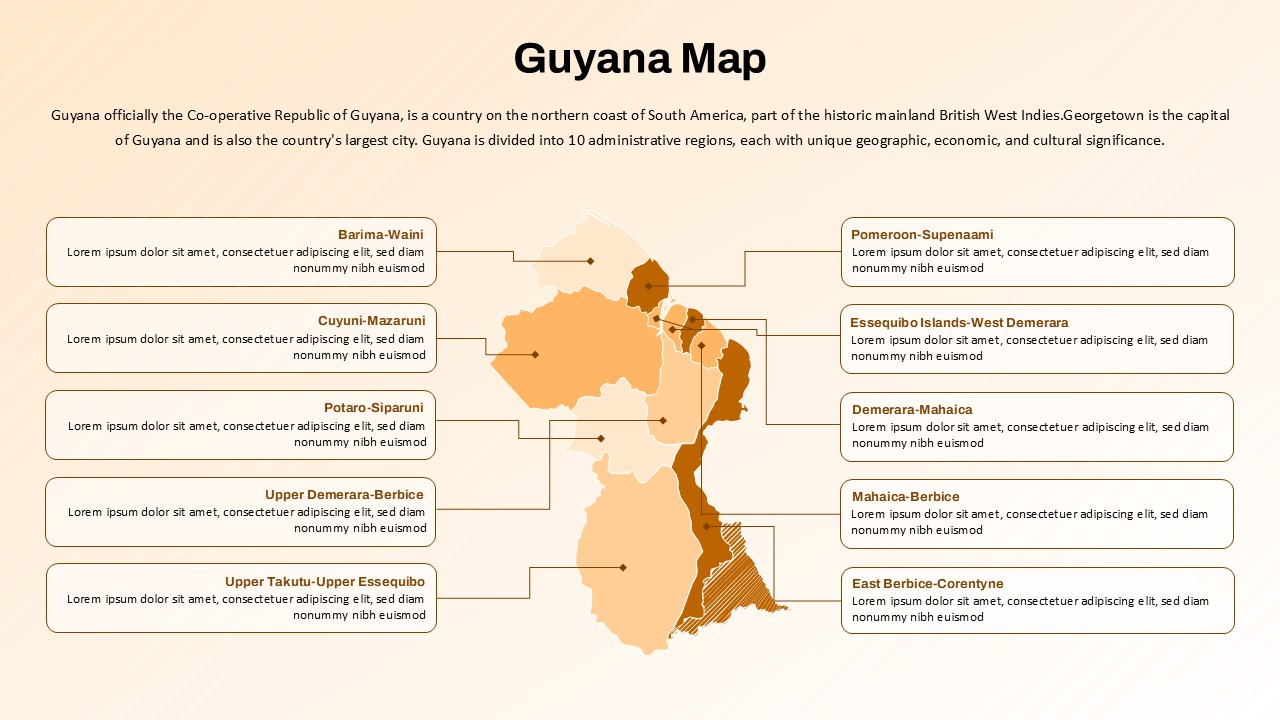
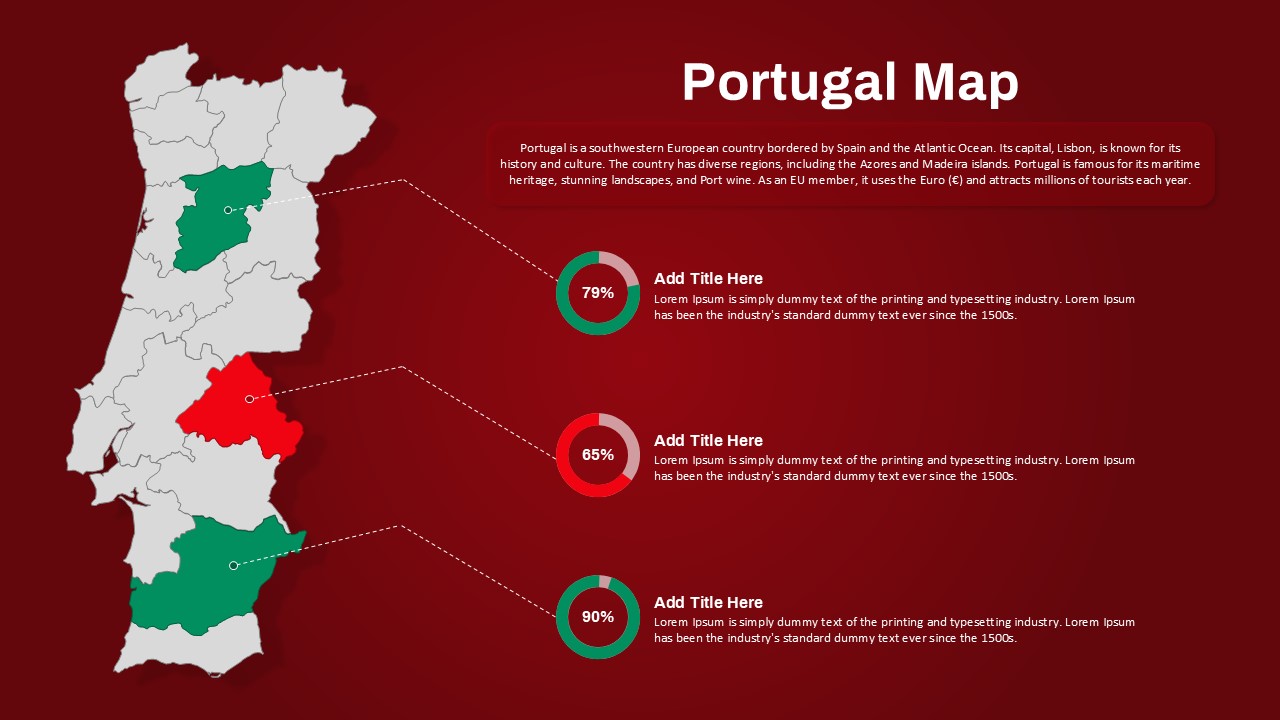
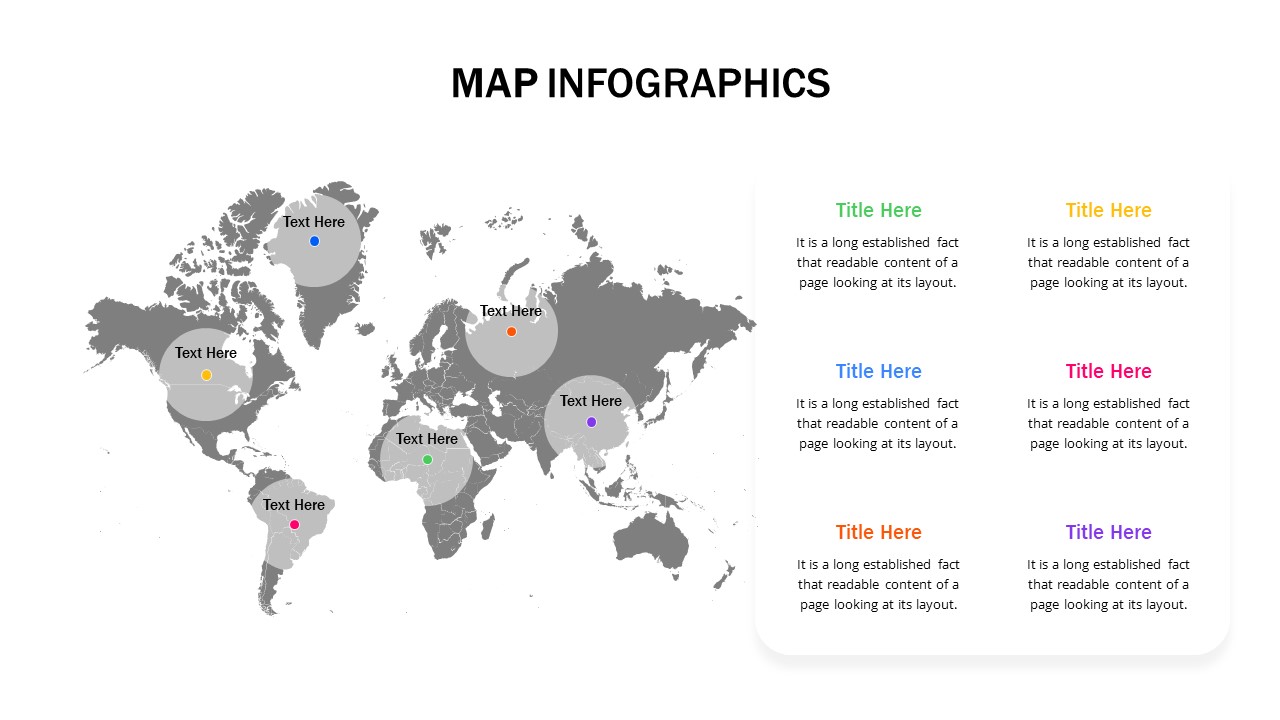
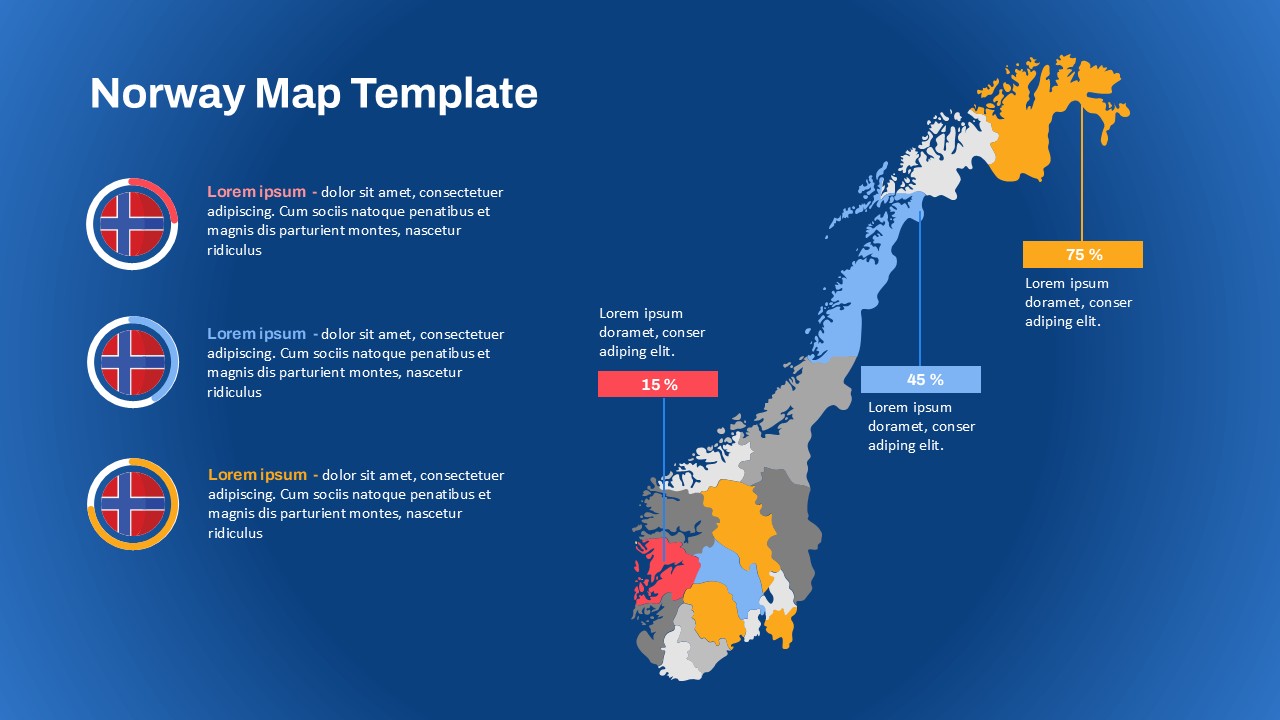
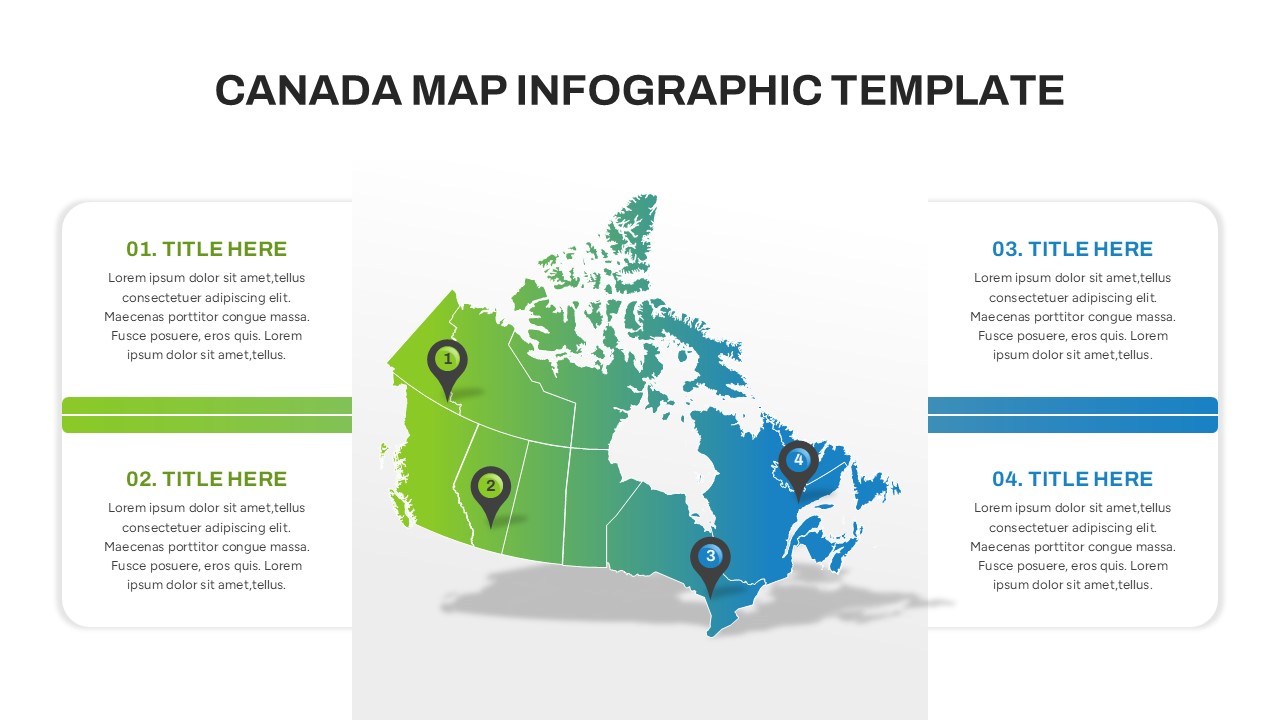
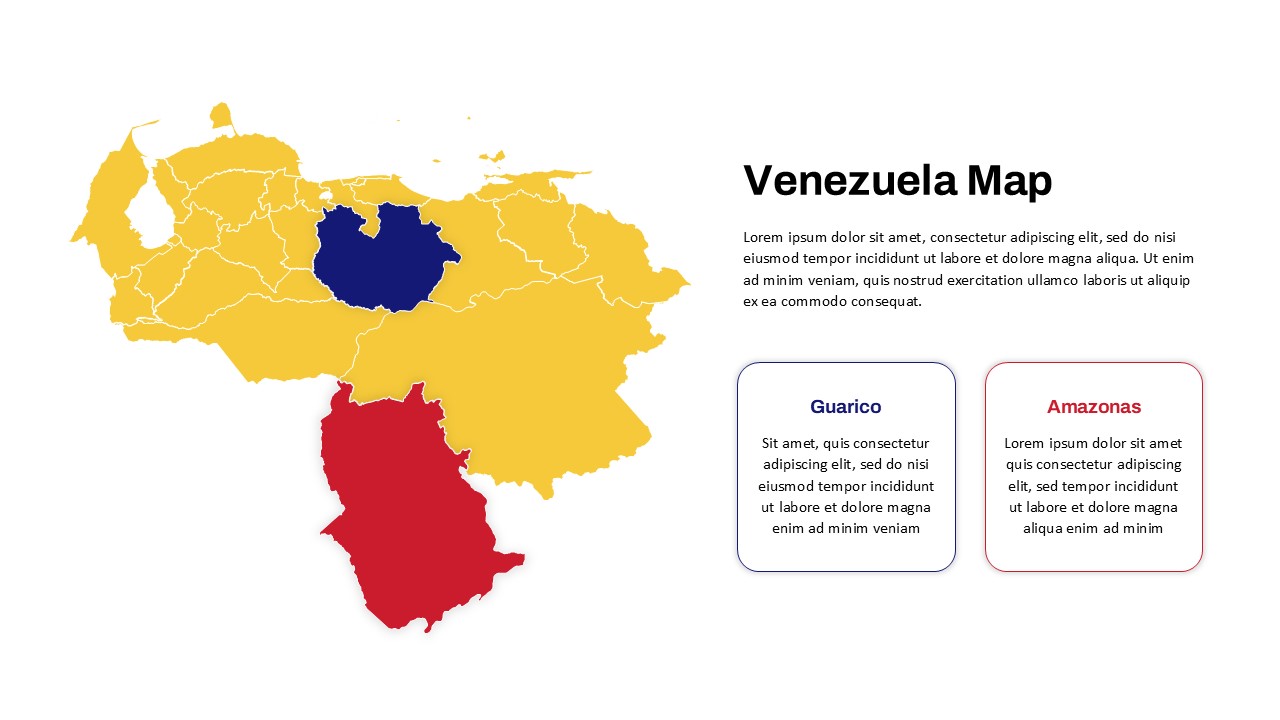
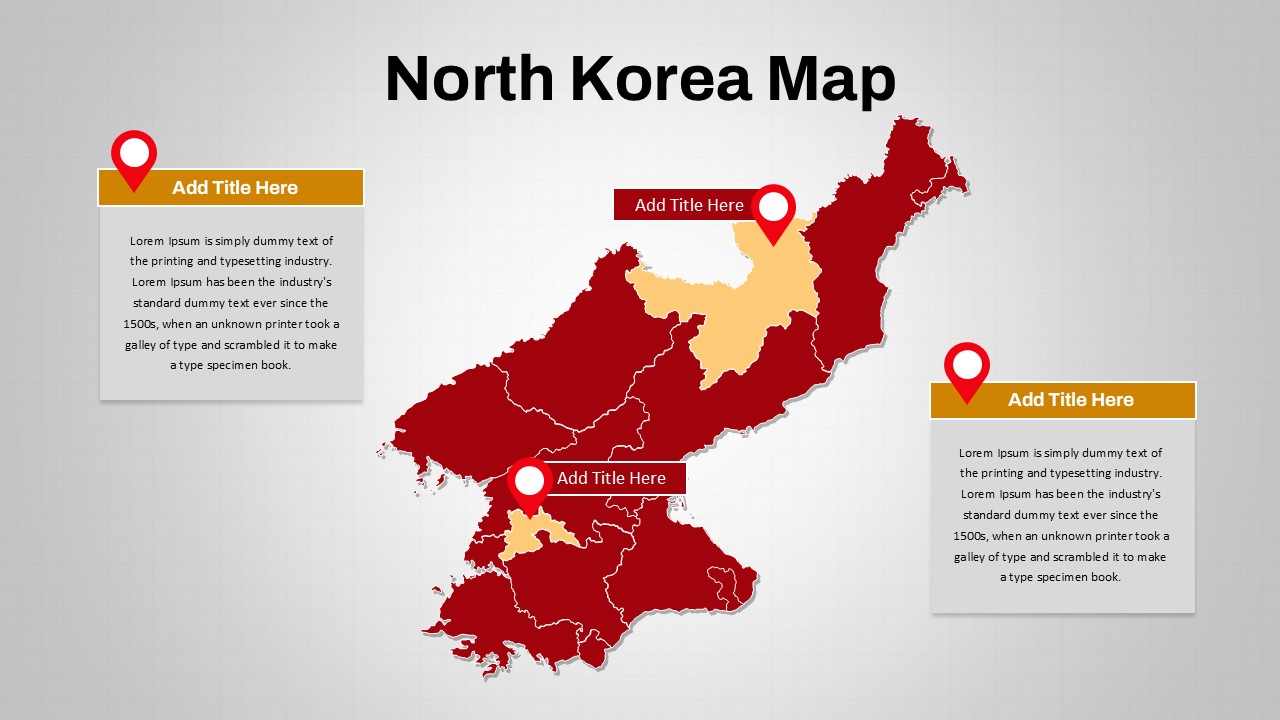
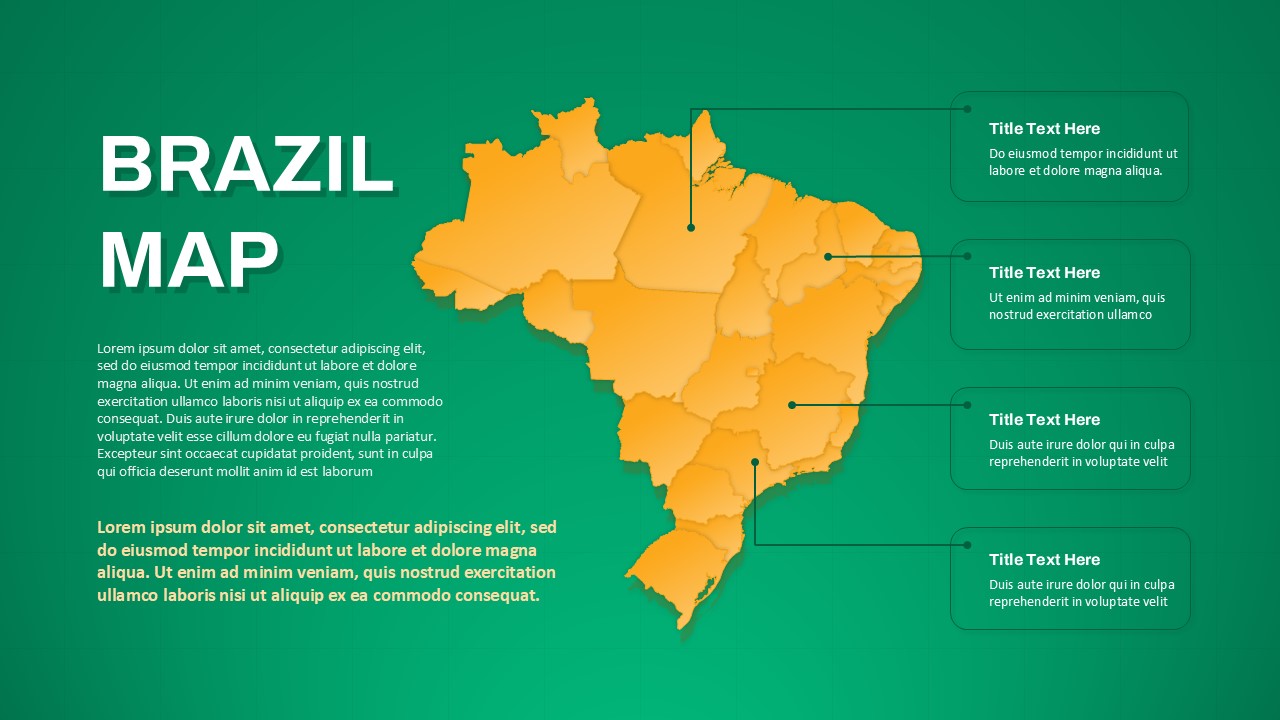
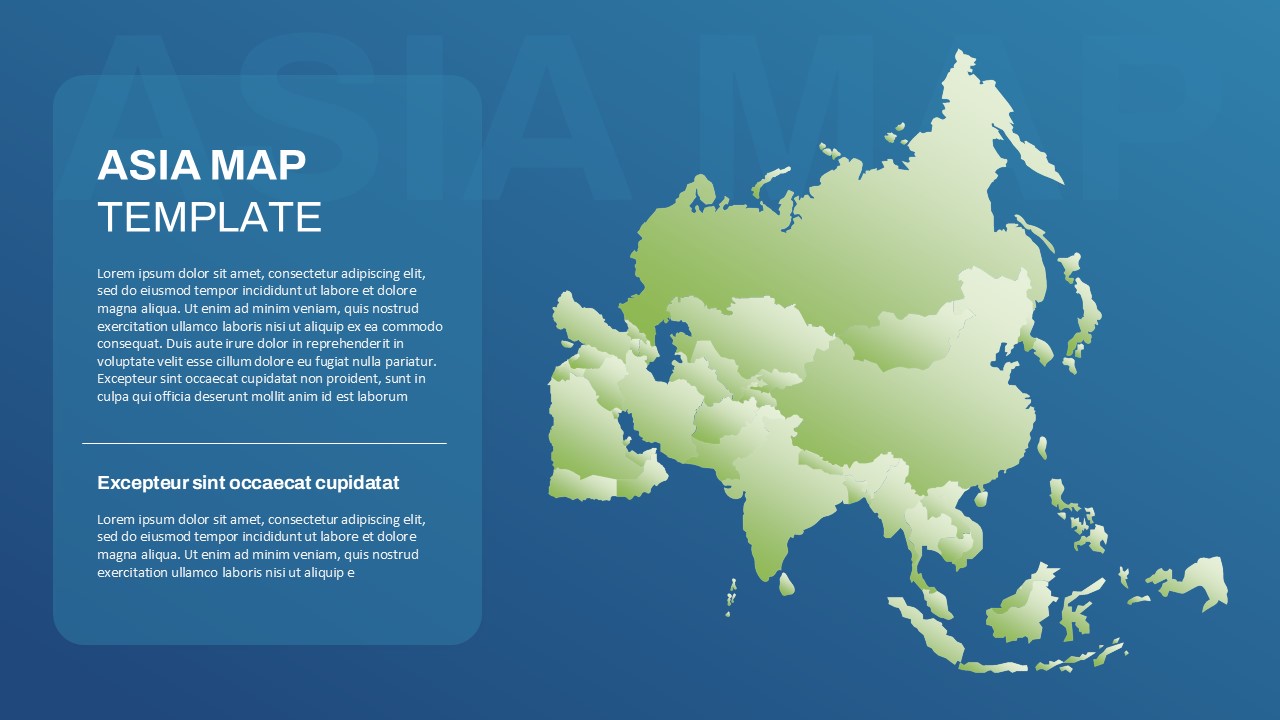
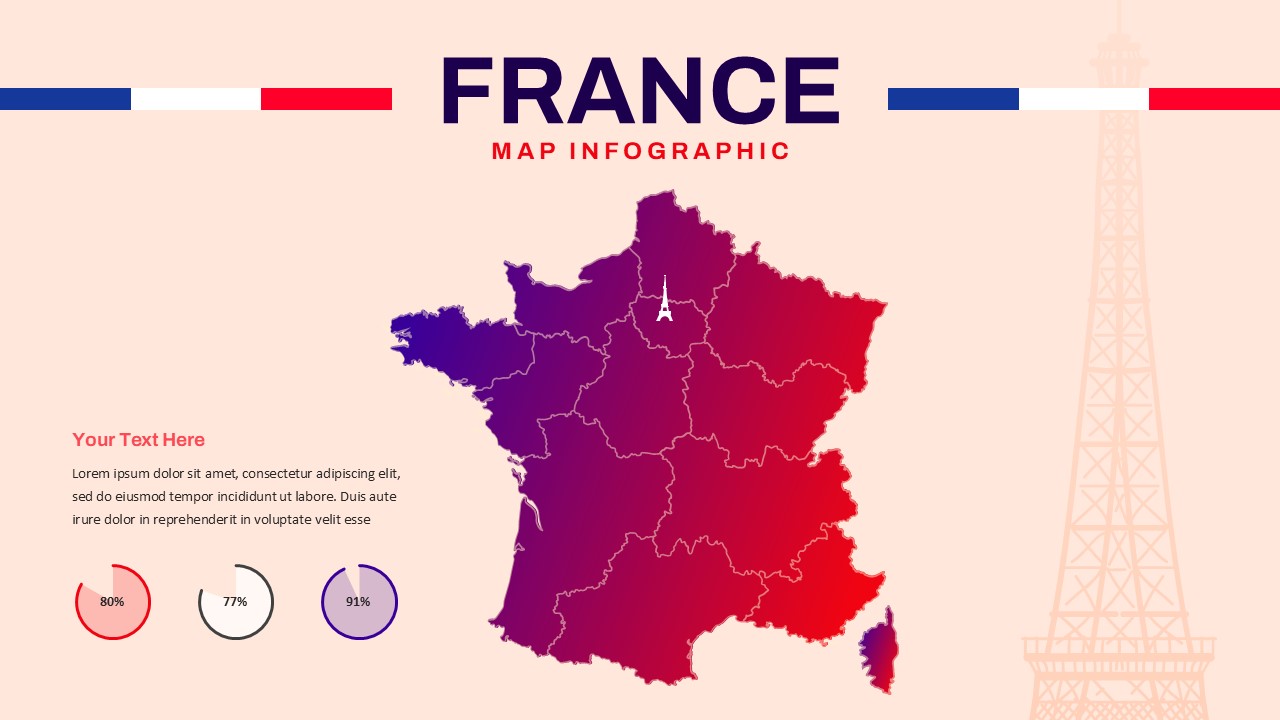
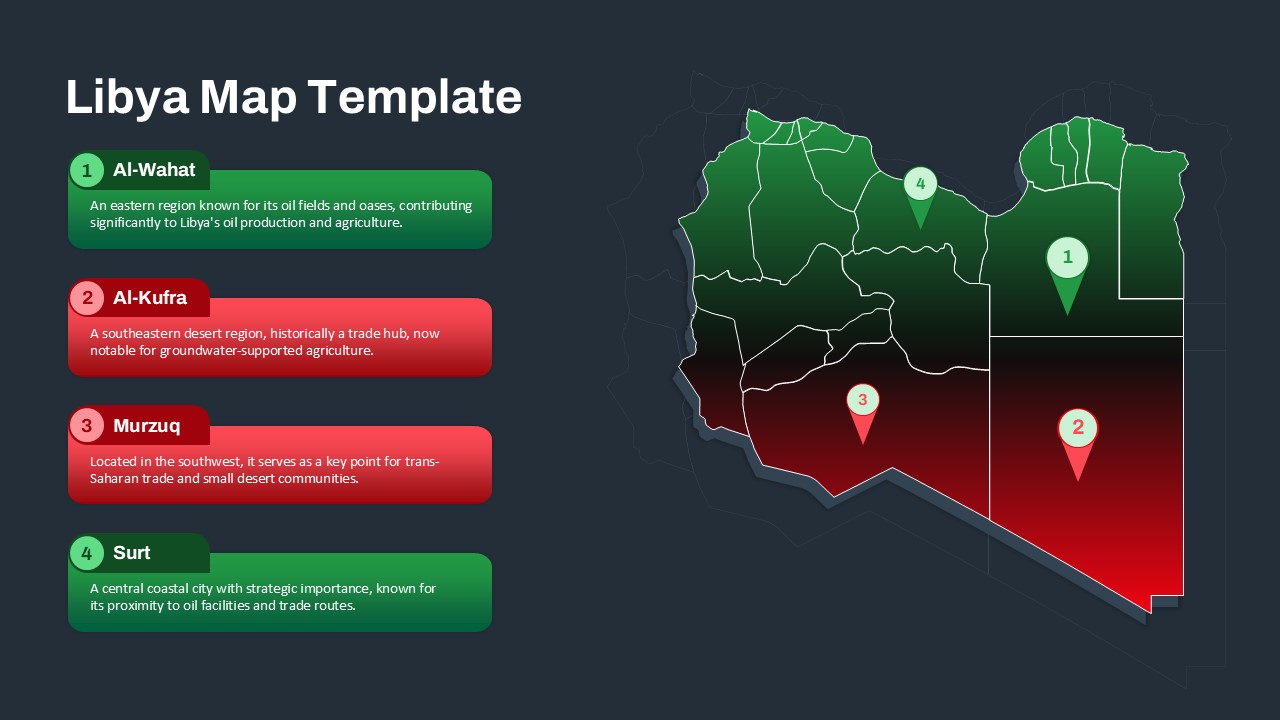
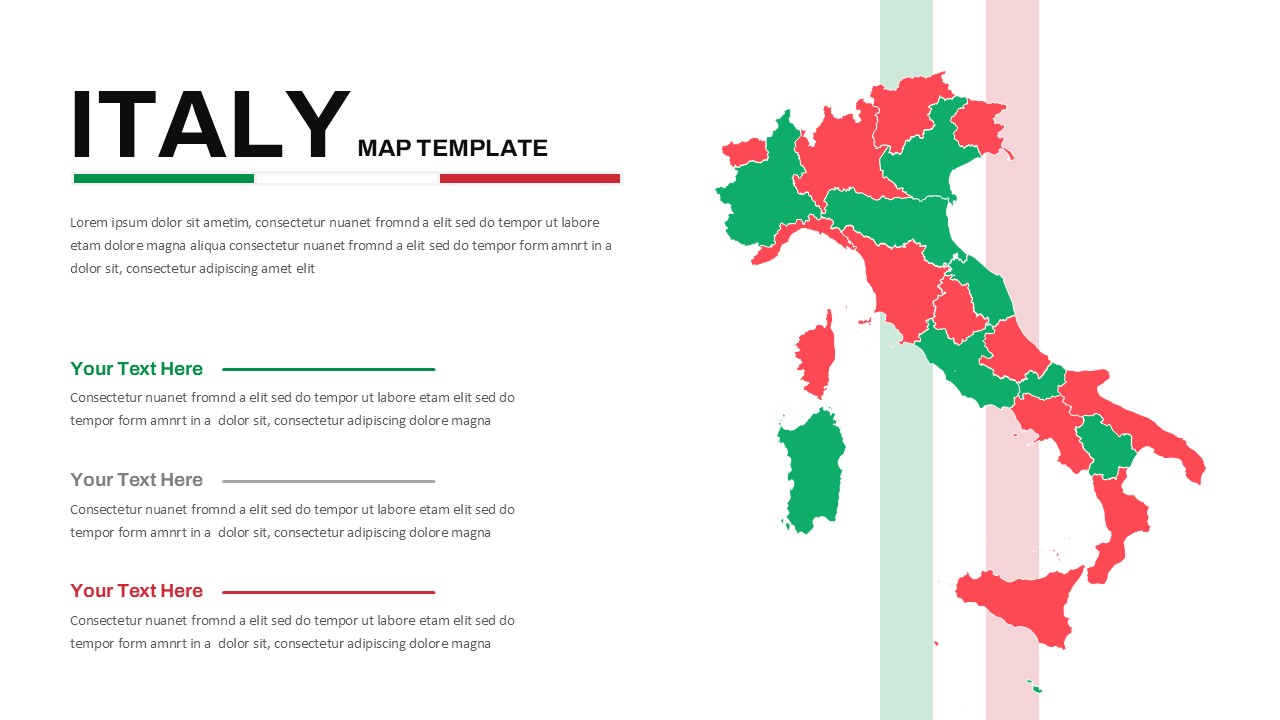
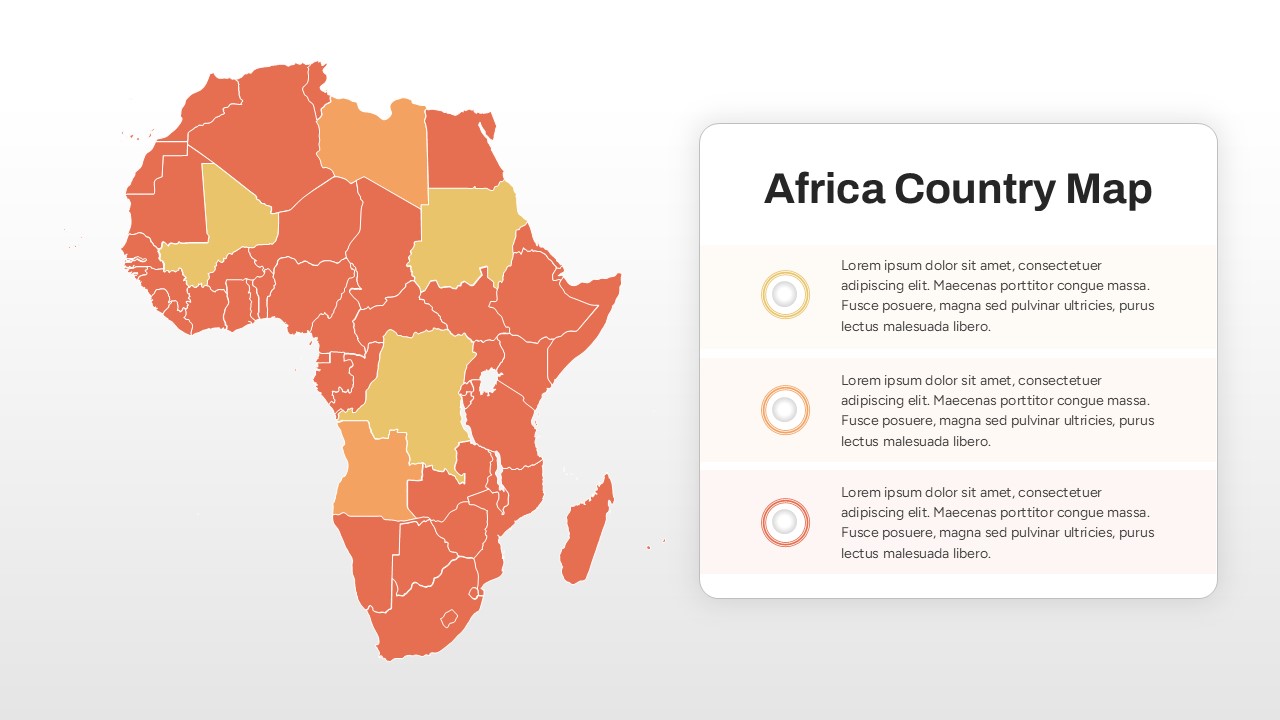
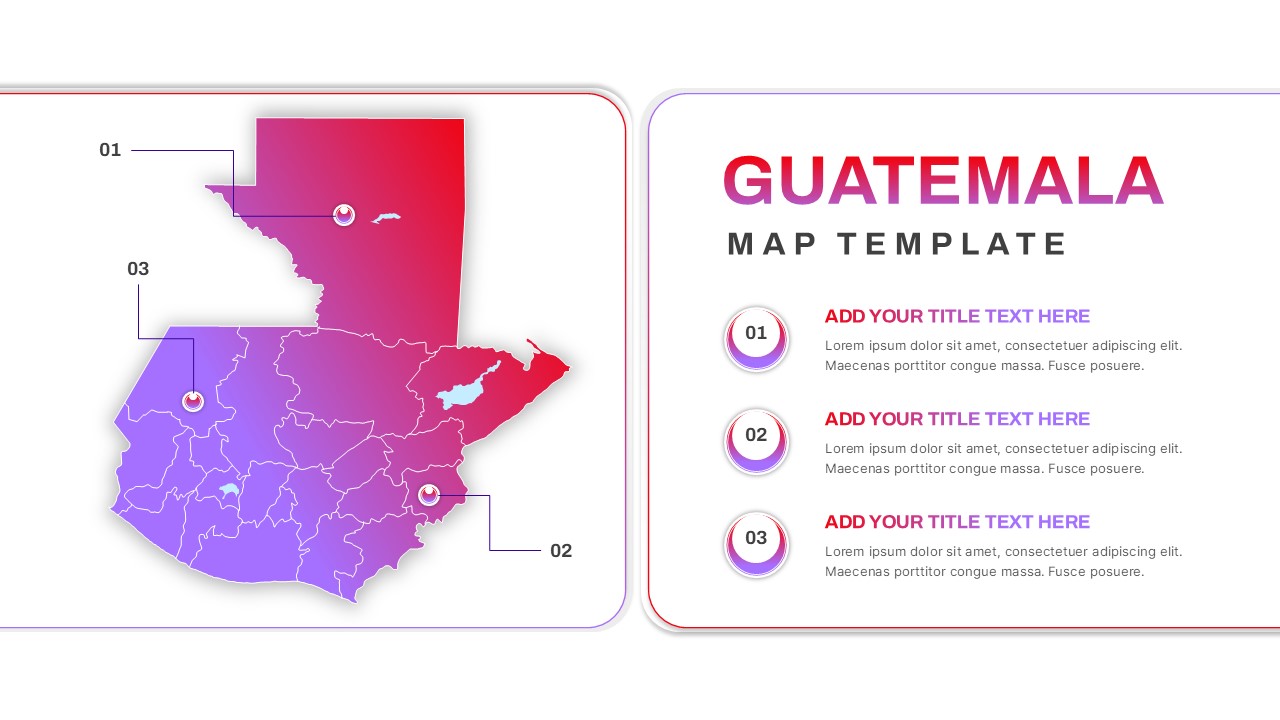
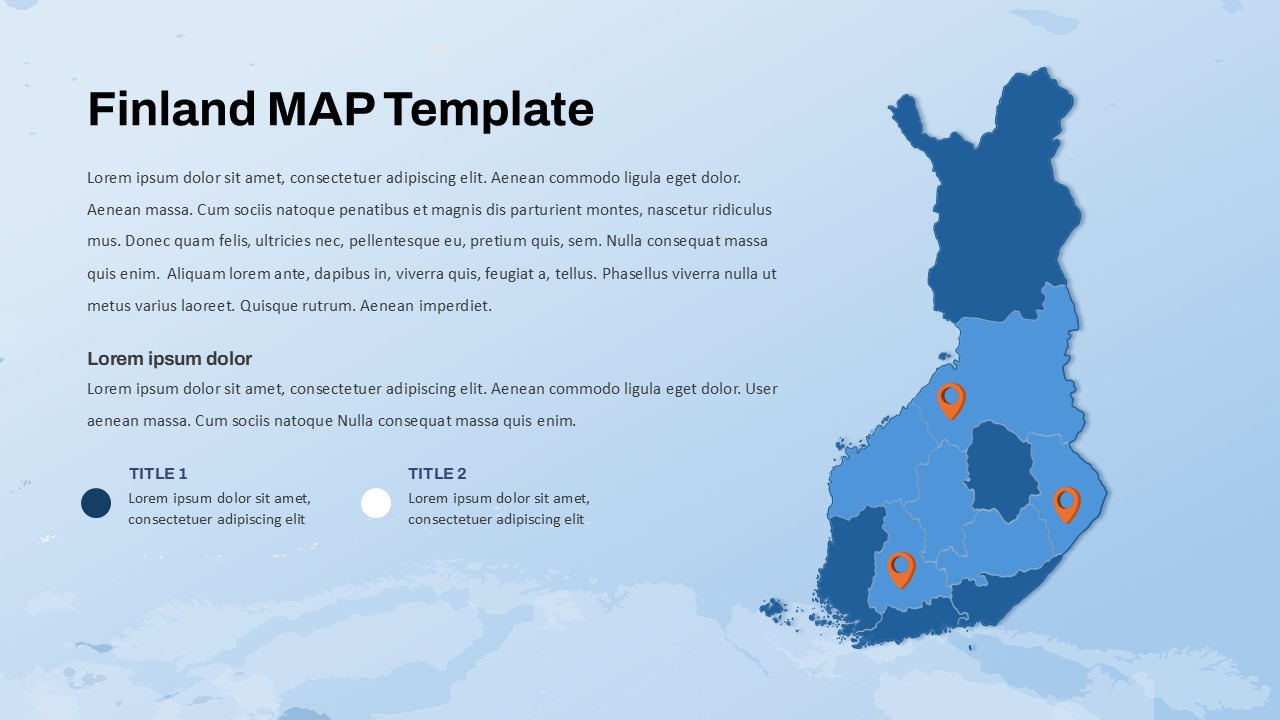
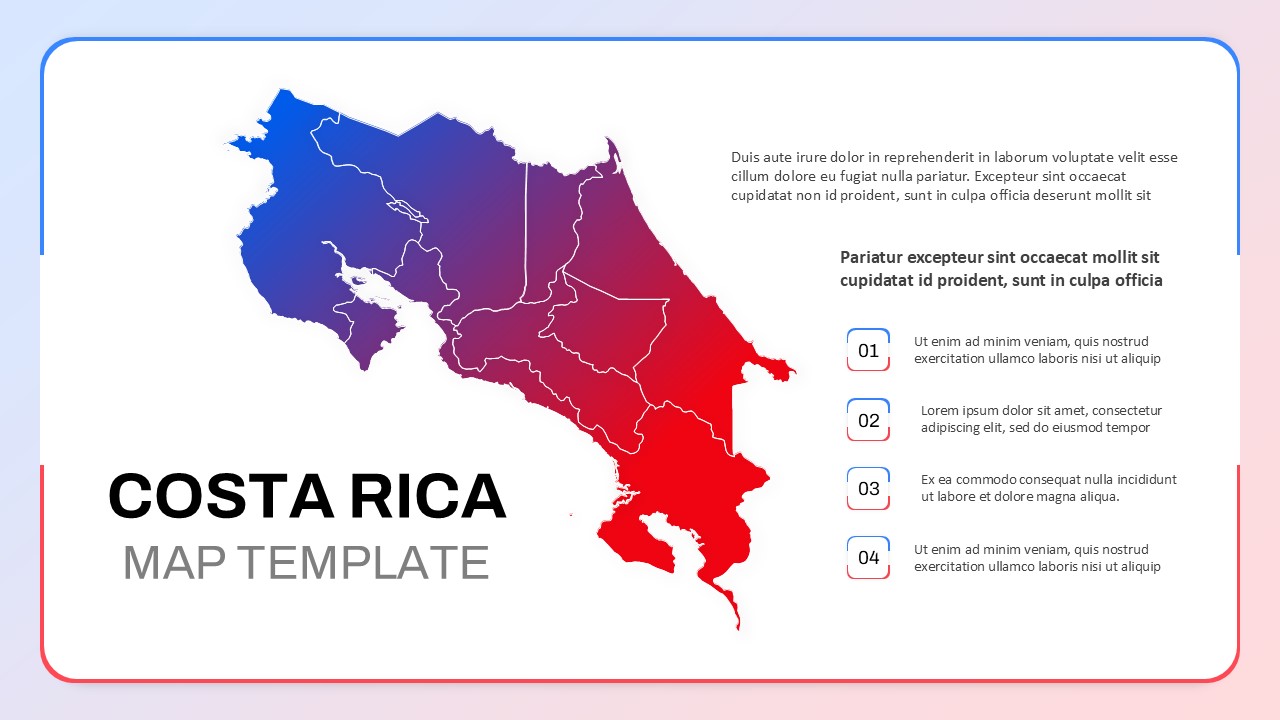
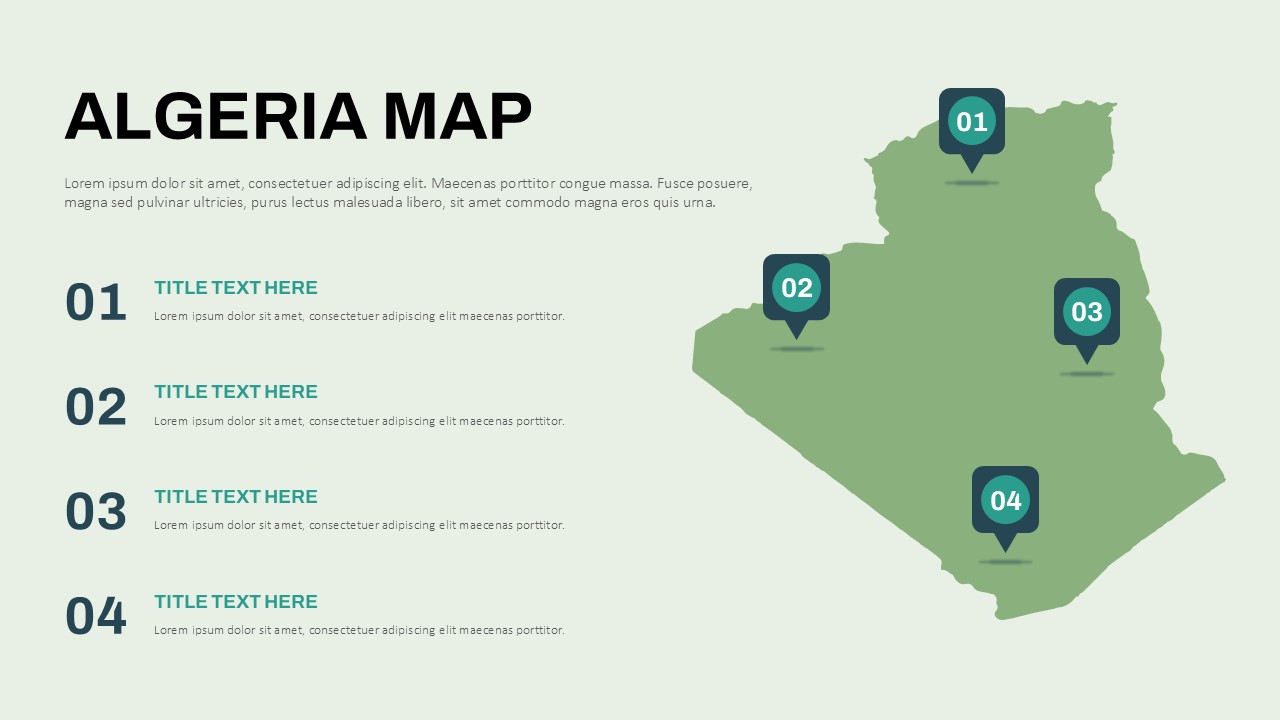
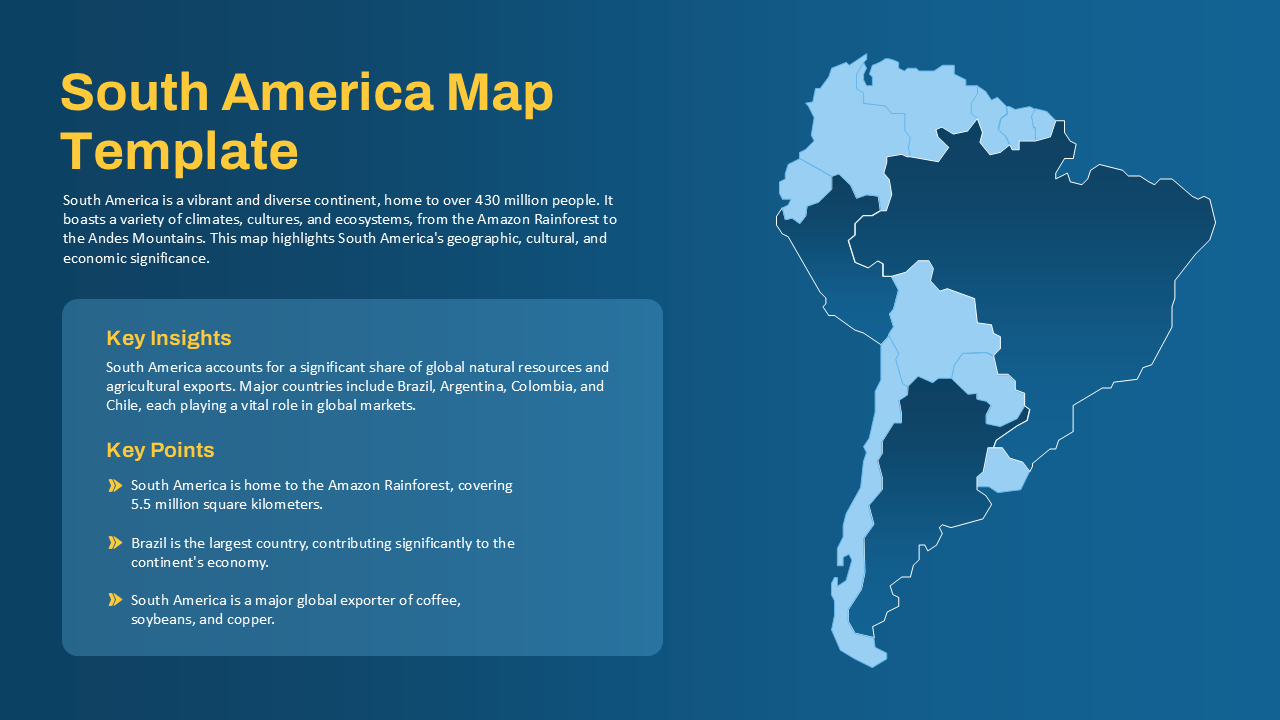
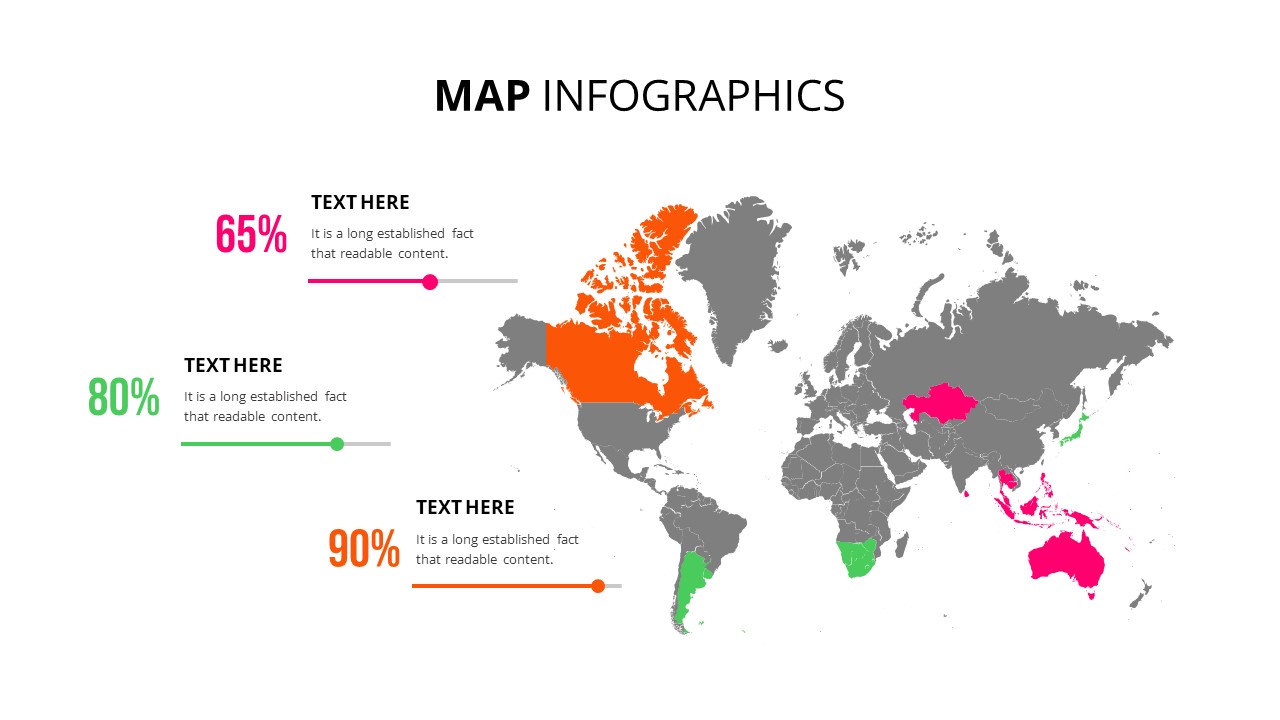
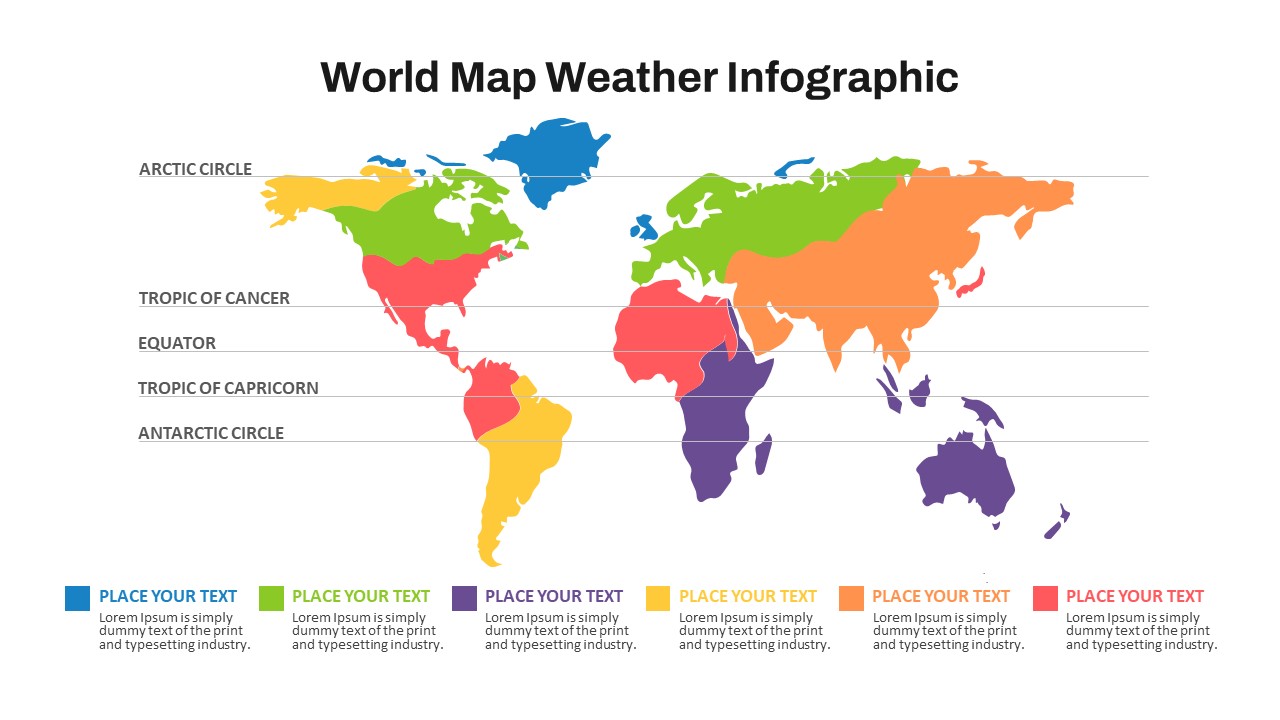
- Regional Visualization: The map is divided into regions with clear color coding, making it easy to compare areas based on specific metrics.
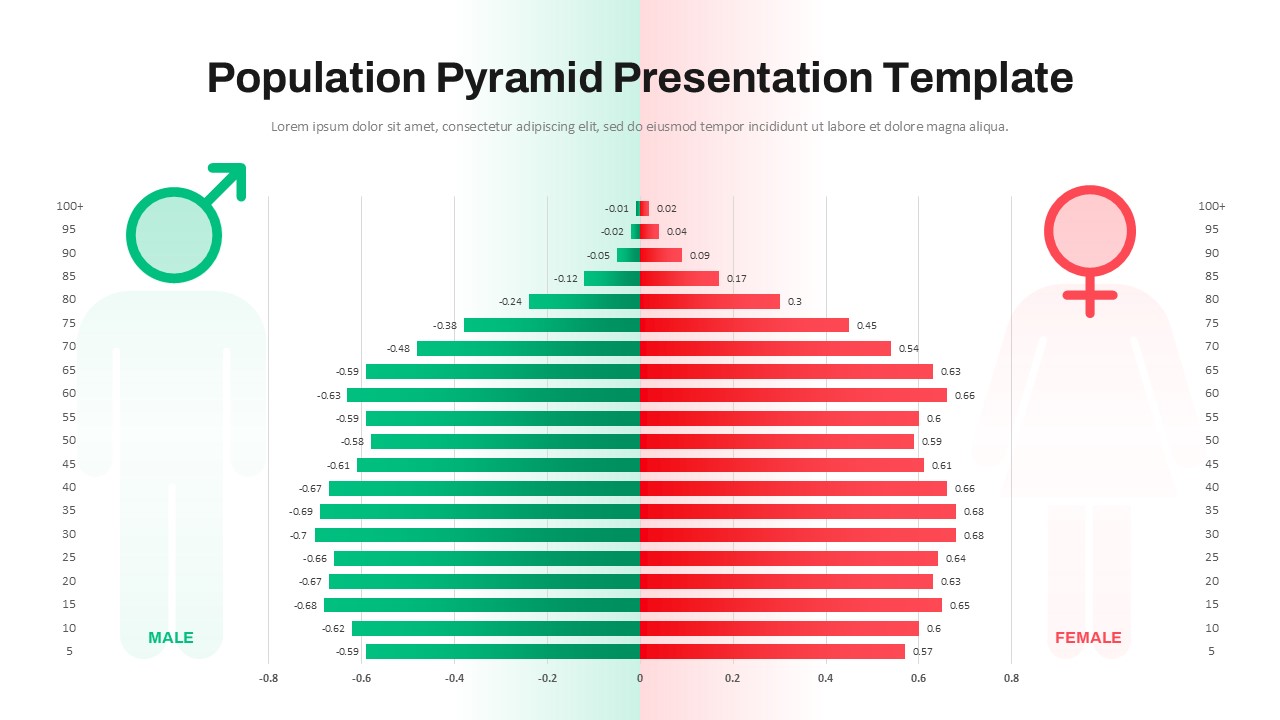
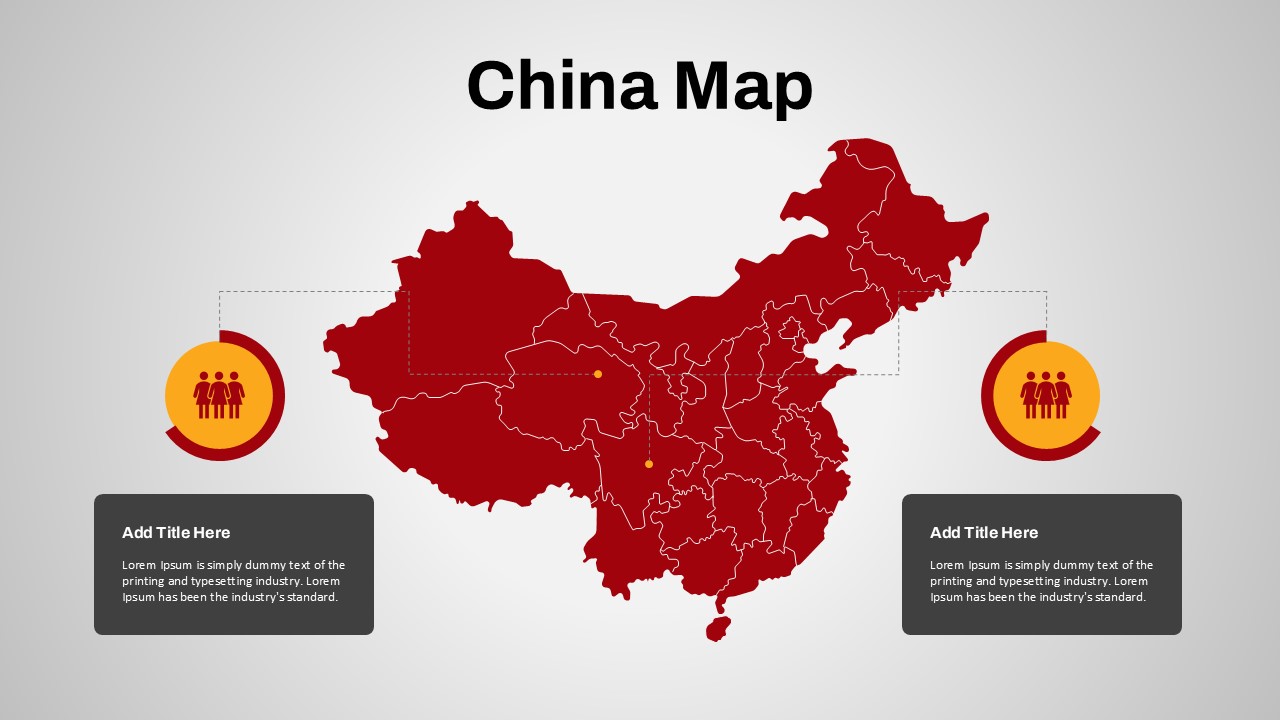
- Population Index: Two sections with gender-based icons and percentage labels provide an accessible view of population distribution or demographic data.
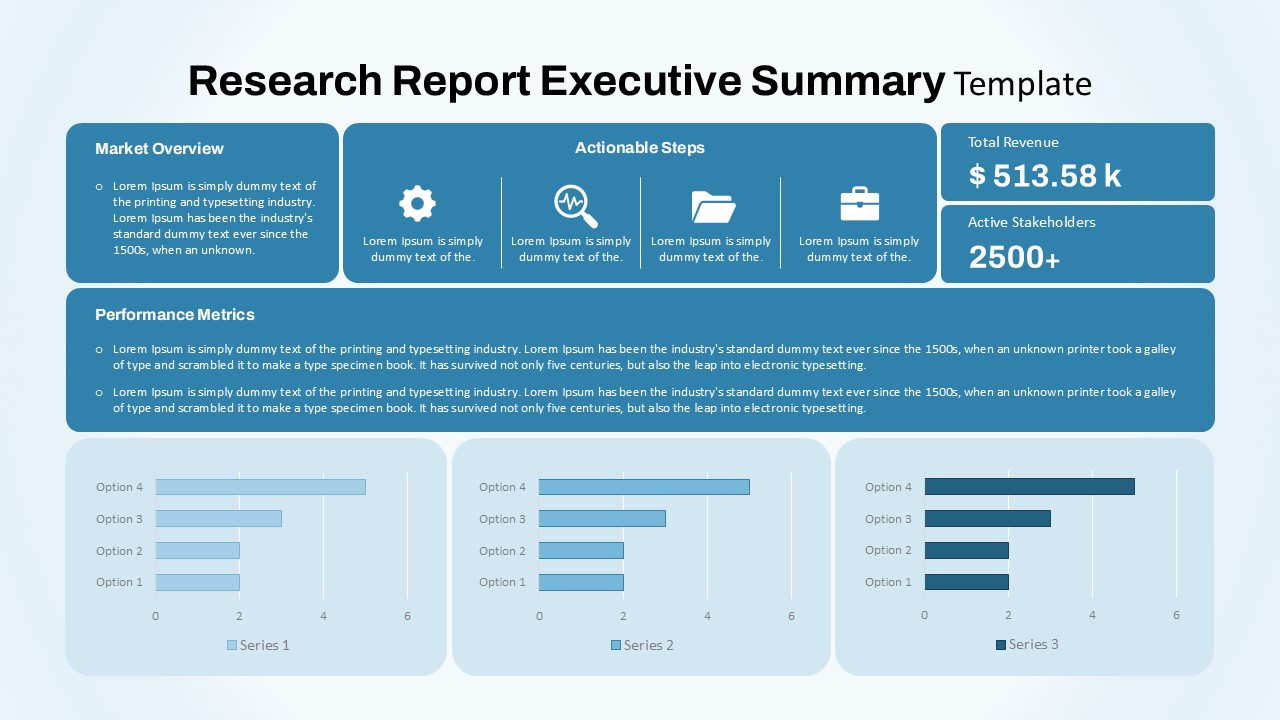
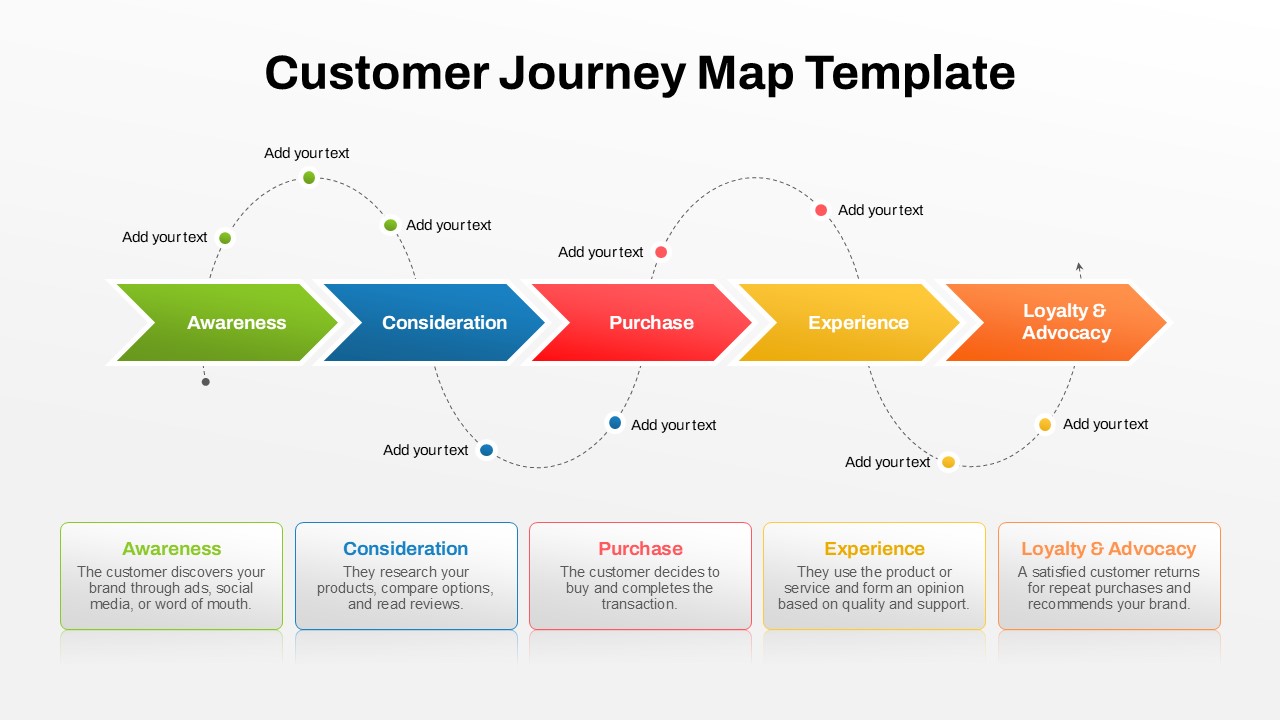
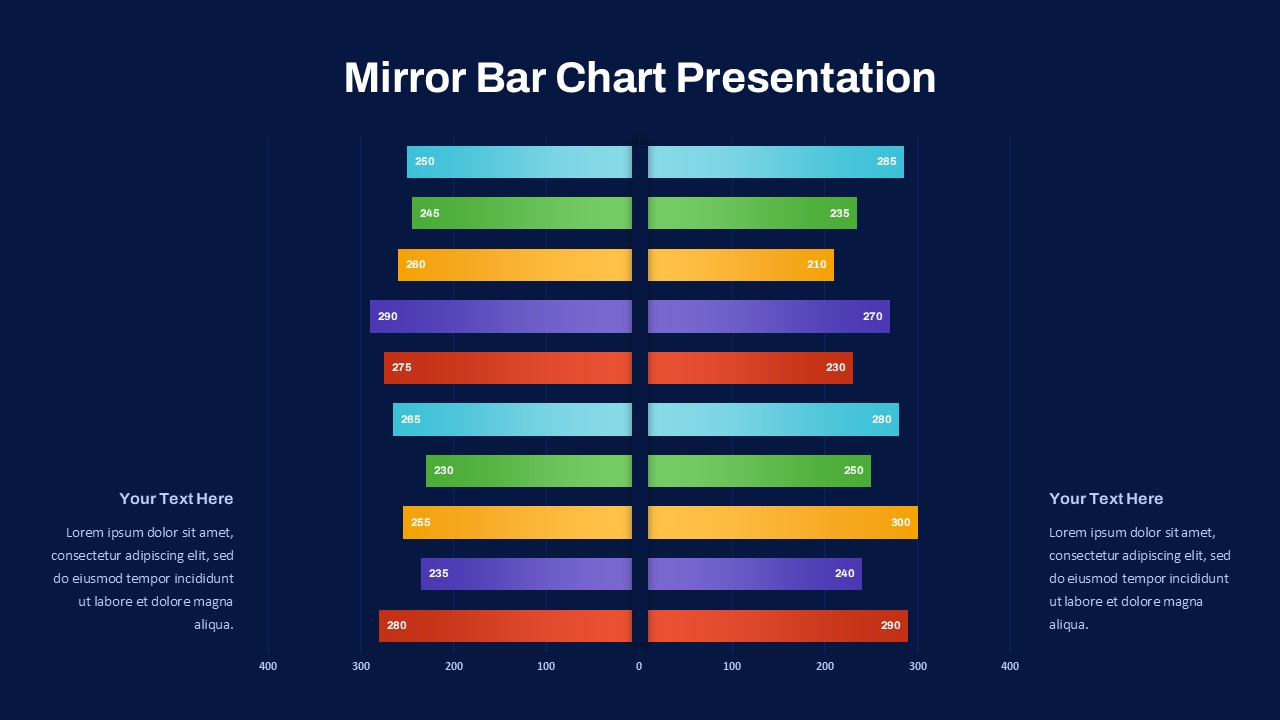
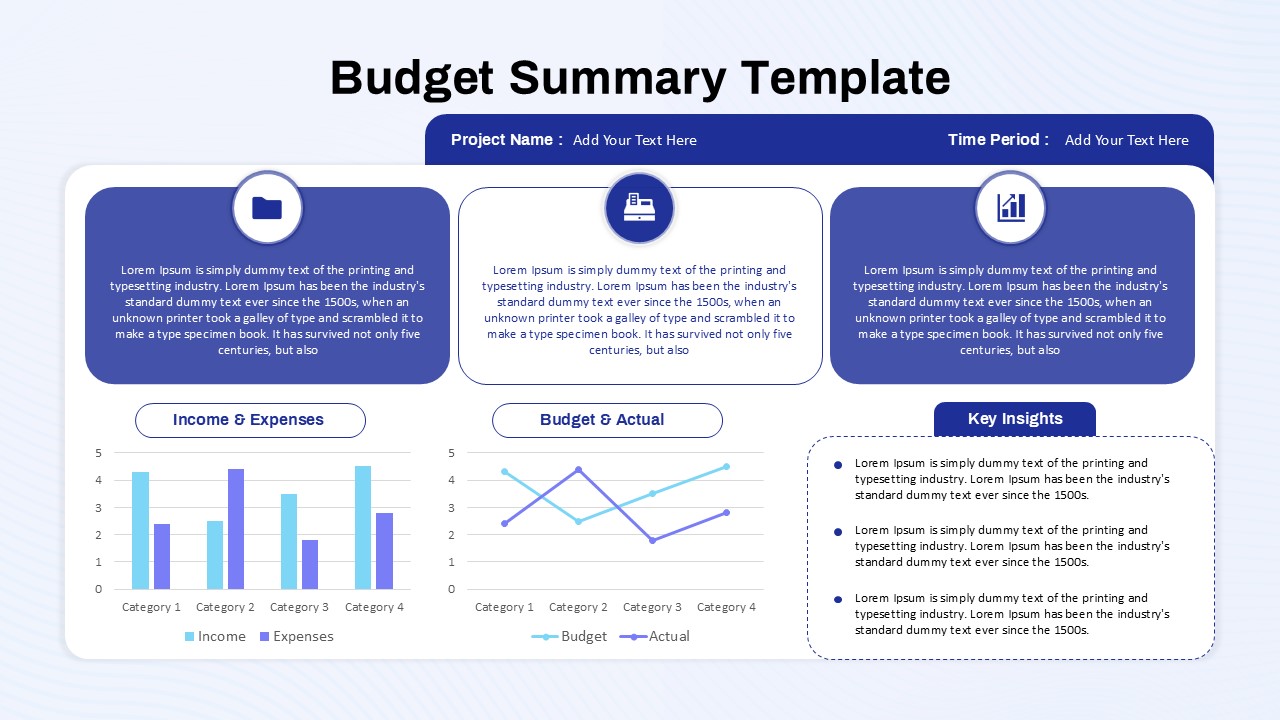
- Data Charts: Circular charts on either side of the map offer a visual representation of percentages, helping to convey data insights effectively.
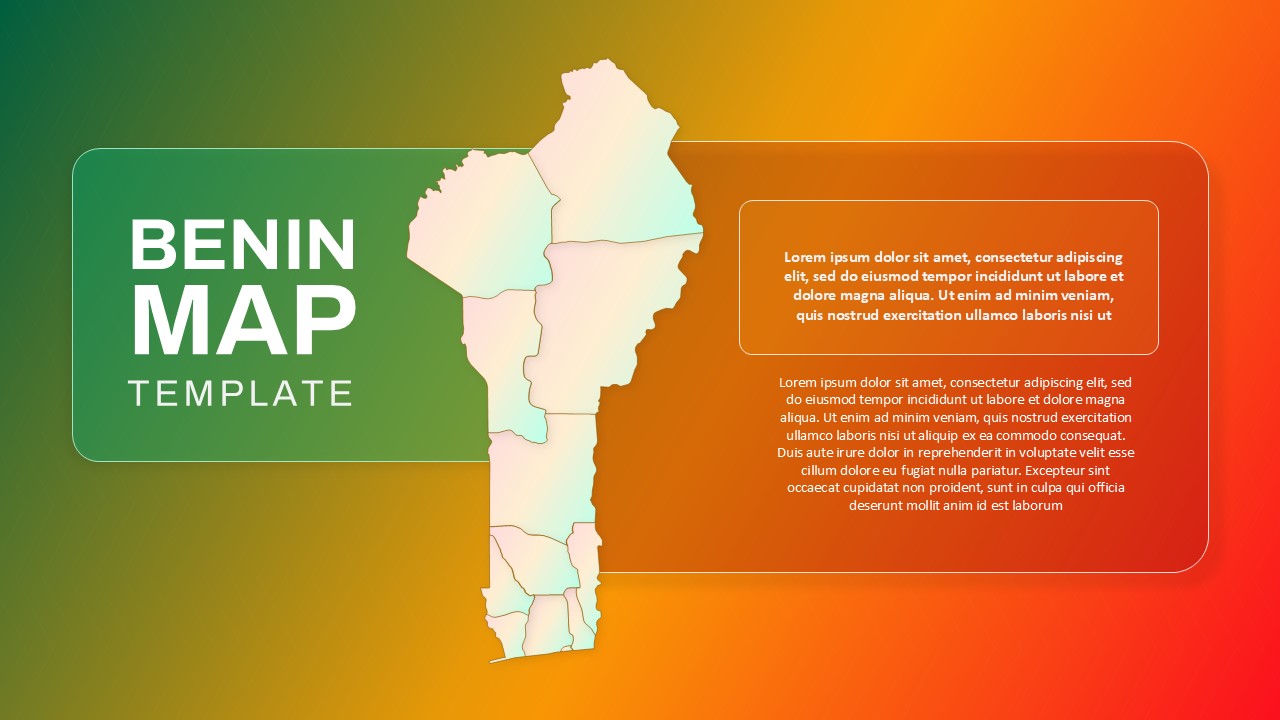
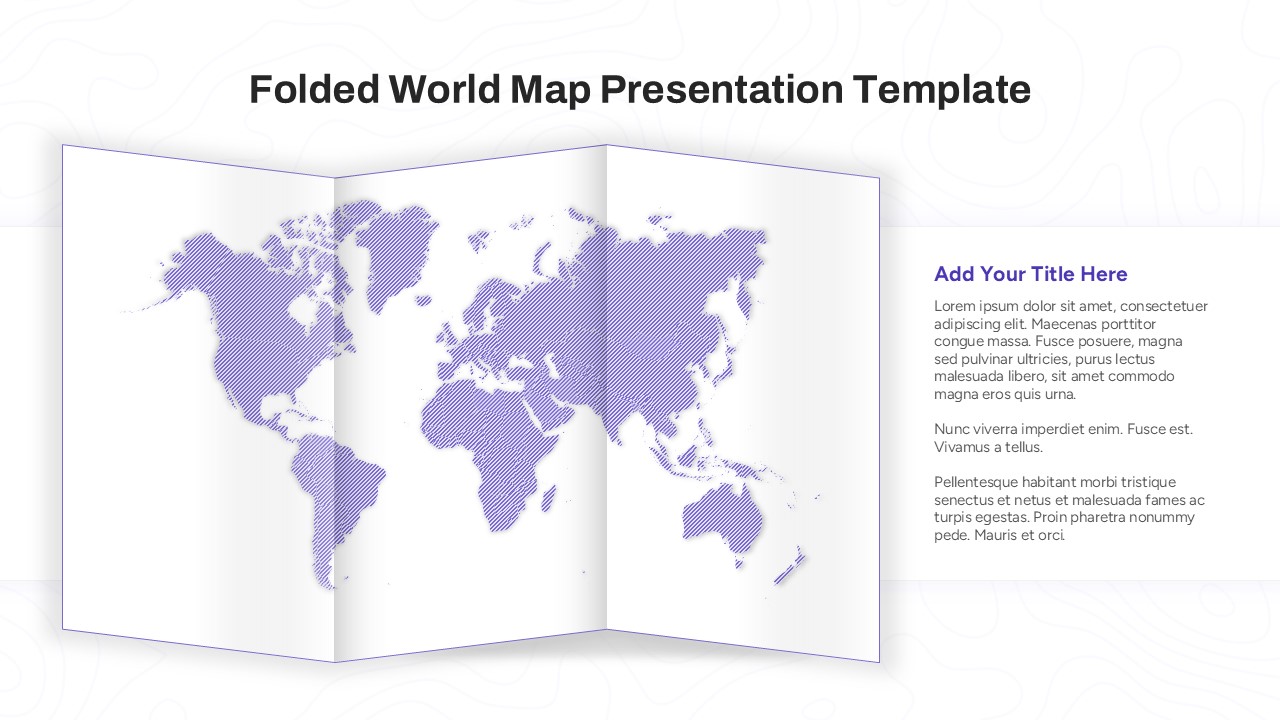
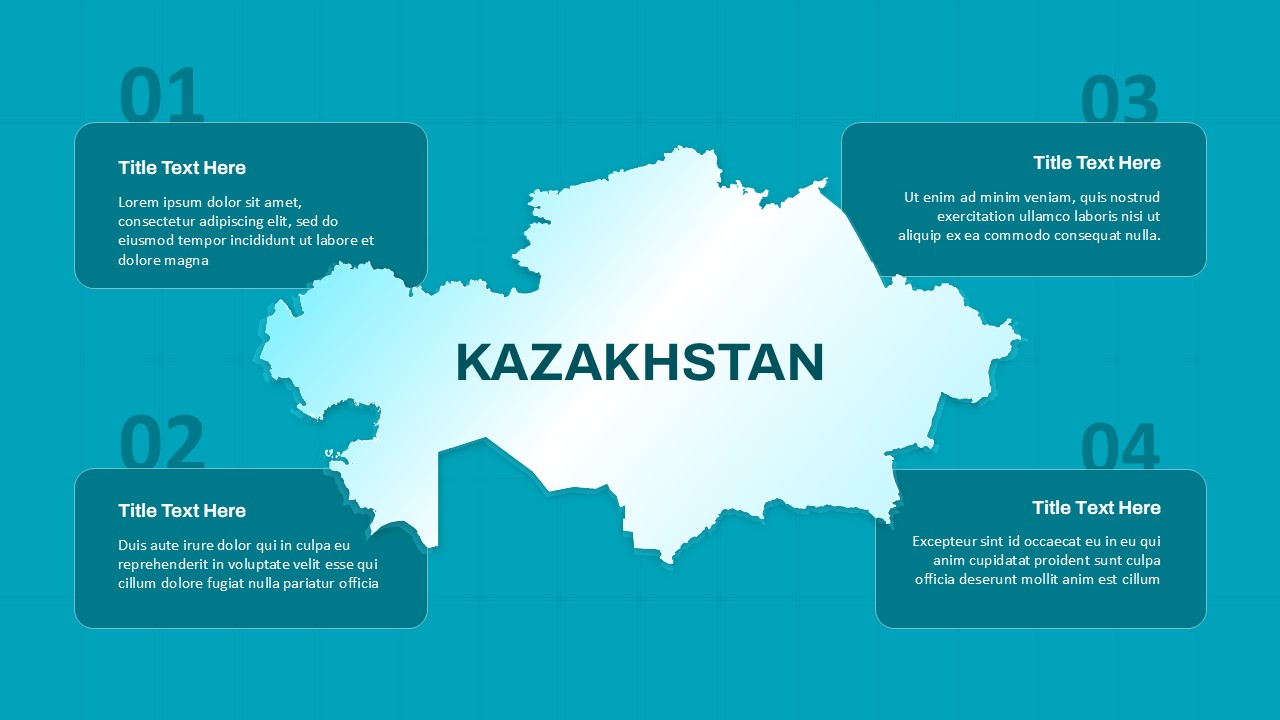
- Customizable Text Blocks: Editable placeholders are included for adding descriptions, analysis, or additional information relevant to your topic.
This template is fully customizable in both PowerPoint and Google Slides, allowing users to adjust the colors, text, and icons to match their branding or data visualization needs. Whether you’re presenting a market analysis, illustrating population statistics, or conducting a geographical study, the Paraguay Map Infographic Template provides a clear and professional format.
See more

Aspect Ratio
16:9Item ID
SKT03405
Features of this template
Other Use Cases of the Template
Demographic analysis reports, regional development presentations, economic data visualization, market research reports, business expansion strategy presentations, government policy analysis, tourism data reports, educational geography lessons, and historical analysis of Paraguay's regions.
FAQs
You May Also Like These Presentation Templates


- Free

- Free


- Free


- Free
- Free