Pareto Principle (80/20 Rule) PowerPoint & Google Slides Template
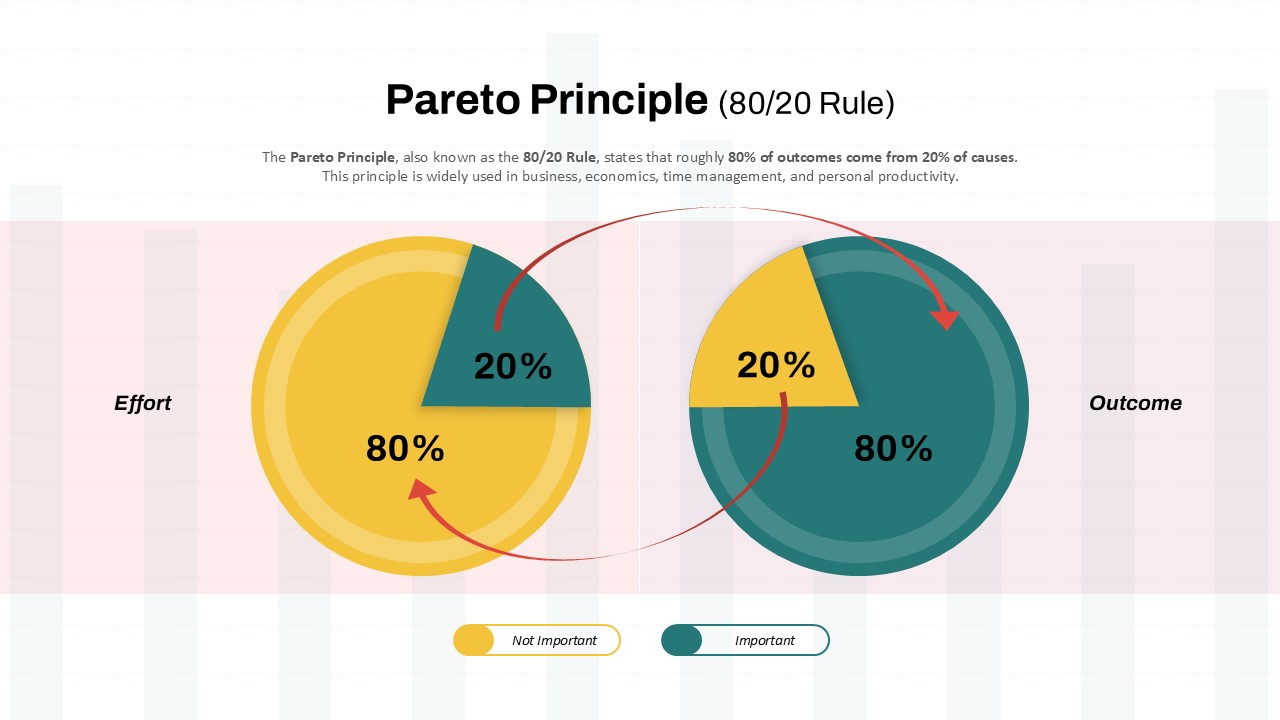
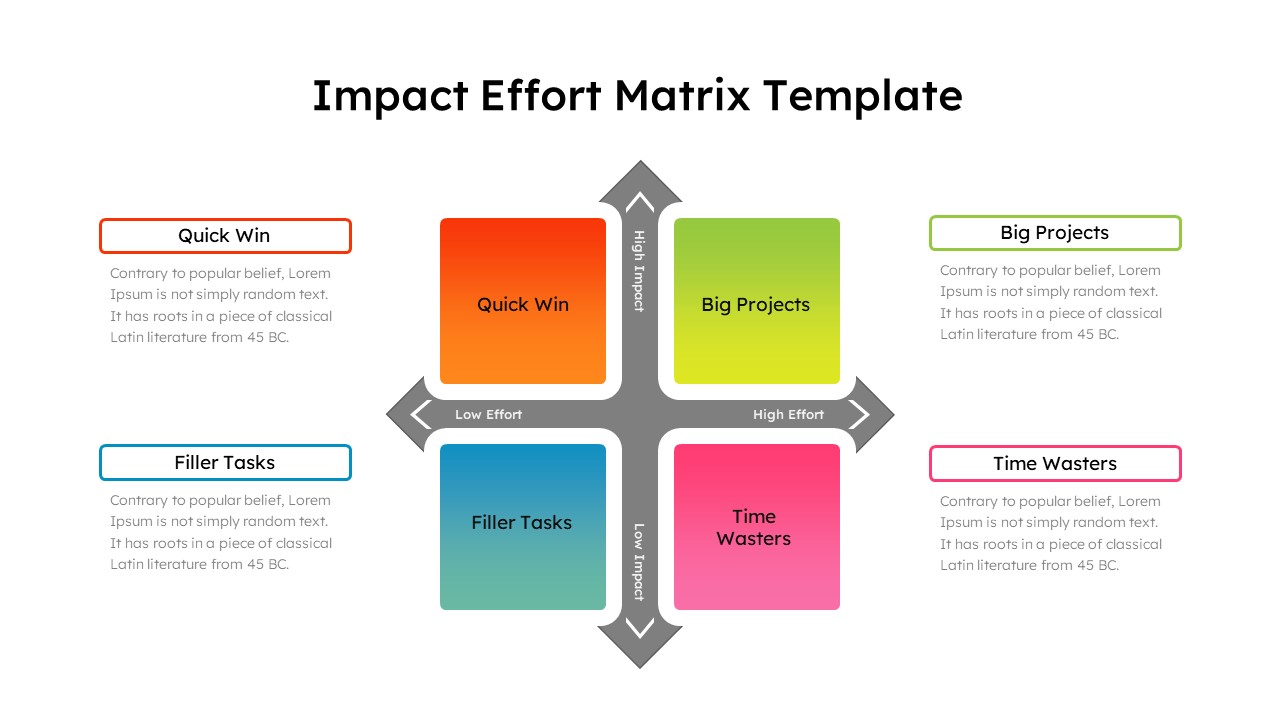
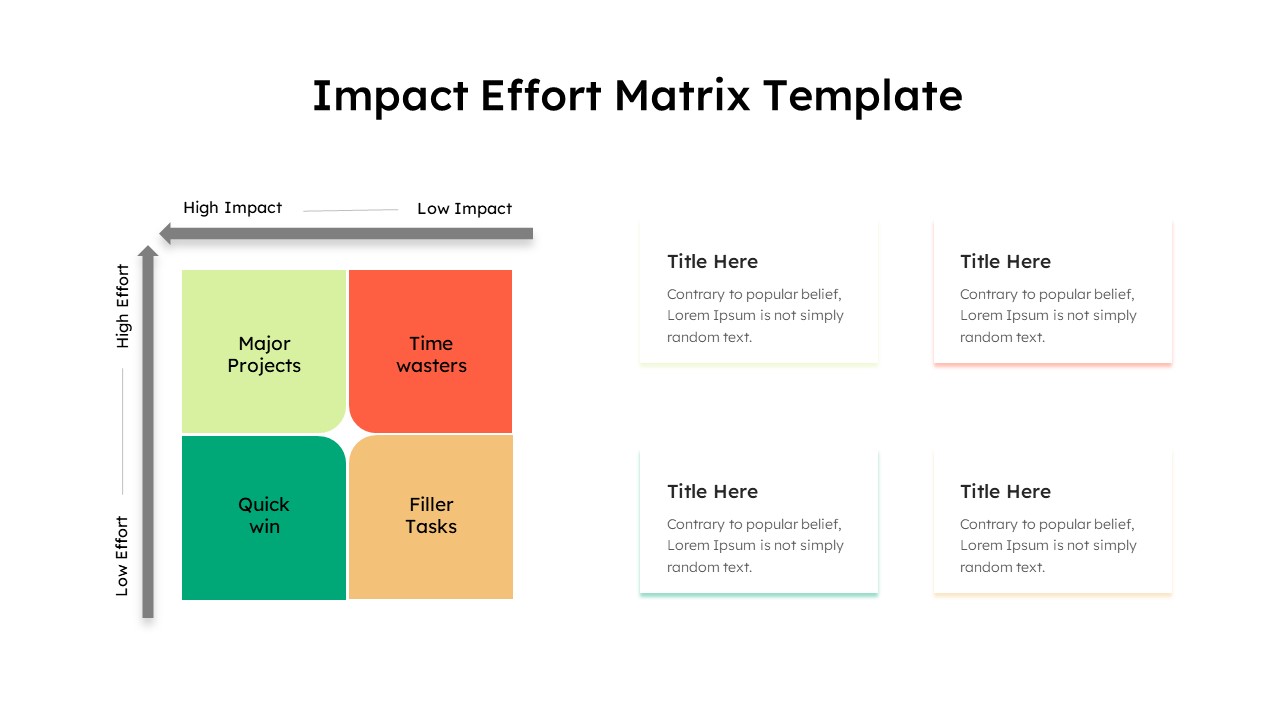
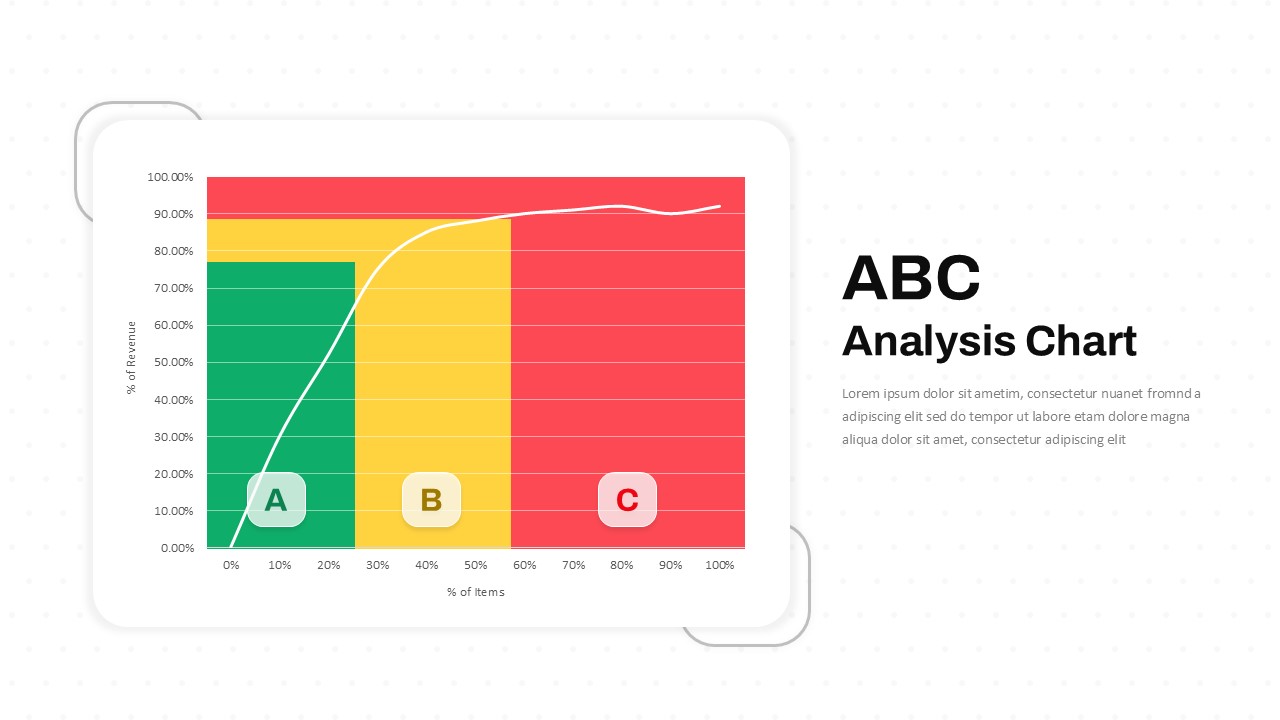
The Pareto chart PowerPoint presentation slide is a professional and visually engaging slide designed to illustrate the widely recognized 80/20 rule in business, economics, productivity, and decision-making. This template features two pie charts representing the effort-to-outcome ratio, showing that 80% of results stem from just 20% of the effort or causes. The color-coded sections clearly distinguish between important and non-important factors, making it easy for audiences to understand the significance of prioritization.
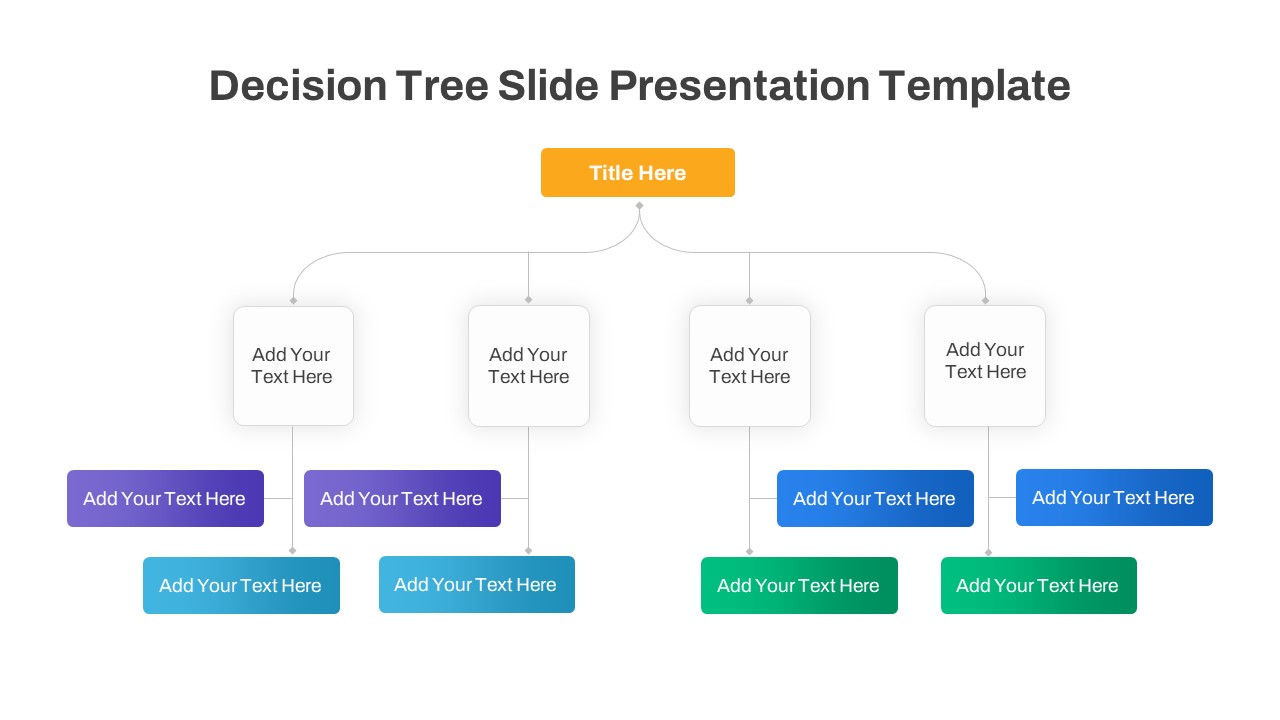
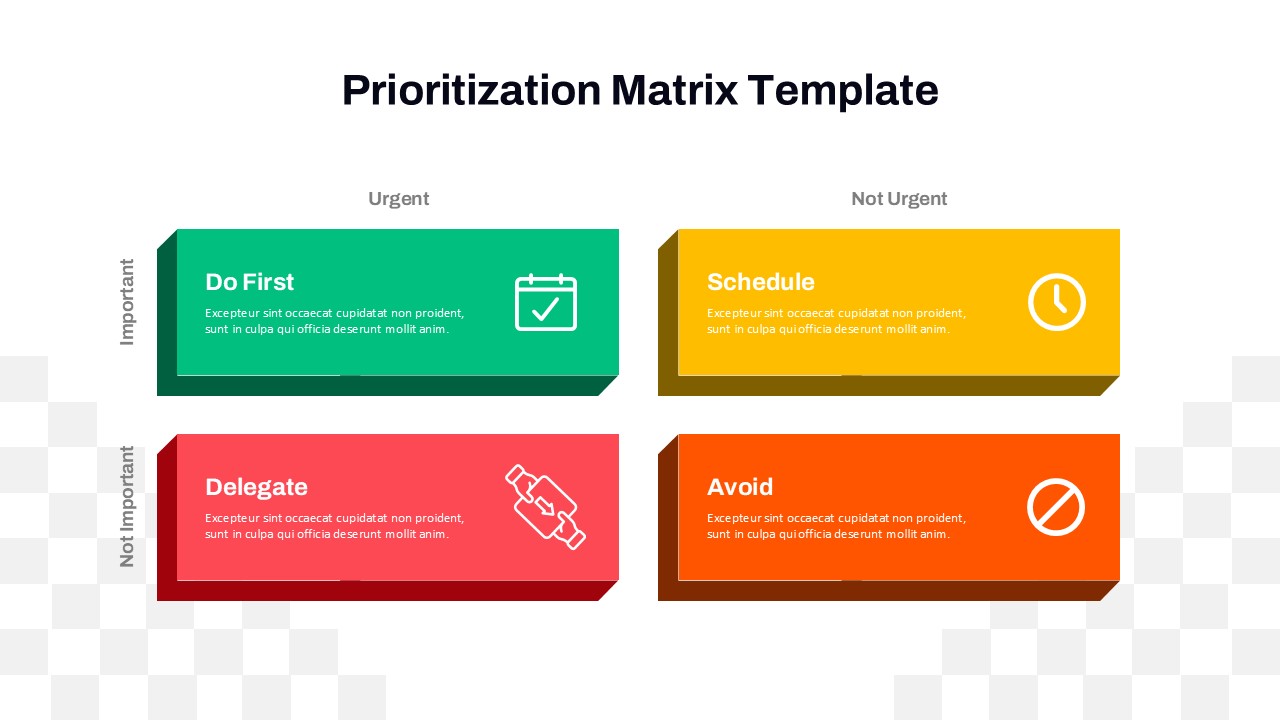
This slide is perfect for business professionals, project managers, consultants, educators, and strategists who want to demonstrate the impact of the Pareto Principle in resource allocation, productivity enhancement, business growth strategies, and performance improvement. It can be used in corporate presentations, financial planning, sales strategy meetings, lean management discussions, and personal development workshops.
With a clean and modern layout, the template ensures clarity in communicating complex data while maintaining a professional and engaging appearance. The text placeholders allow easy customization, making it simple to adapt the slide for various industries and applications. Whether you’re focusing on time management, revenue analysis, or strategic planning, this PowerPoint & Google Slides template provides an effective way to visualize key insights and optimize decision-making.
See more

Aspect Ratio
16:9Item ID
SKT03187
Features of this template
Other Use Cases of the Template:
Business strategy optimization, project management efficiency, sales and revenue analysis, time management techniques, customer segmentation, performance improvement plans, lean management, decision-making frameworks, marketing analytics, operational process enhancement.
FAQs
You May Also Like These Presentation Templates


- Free
- Free
- Free

- Free
- Free
- Free

- Free
- Free