Pie Chart Infographic Template For PPT Presentation

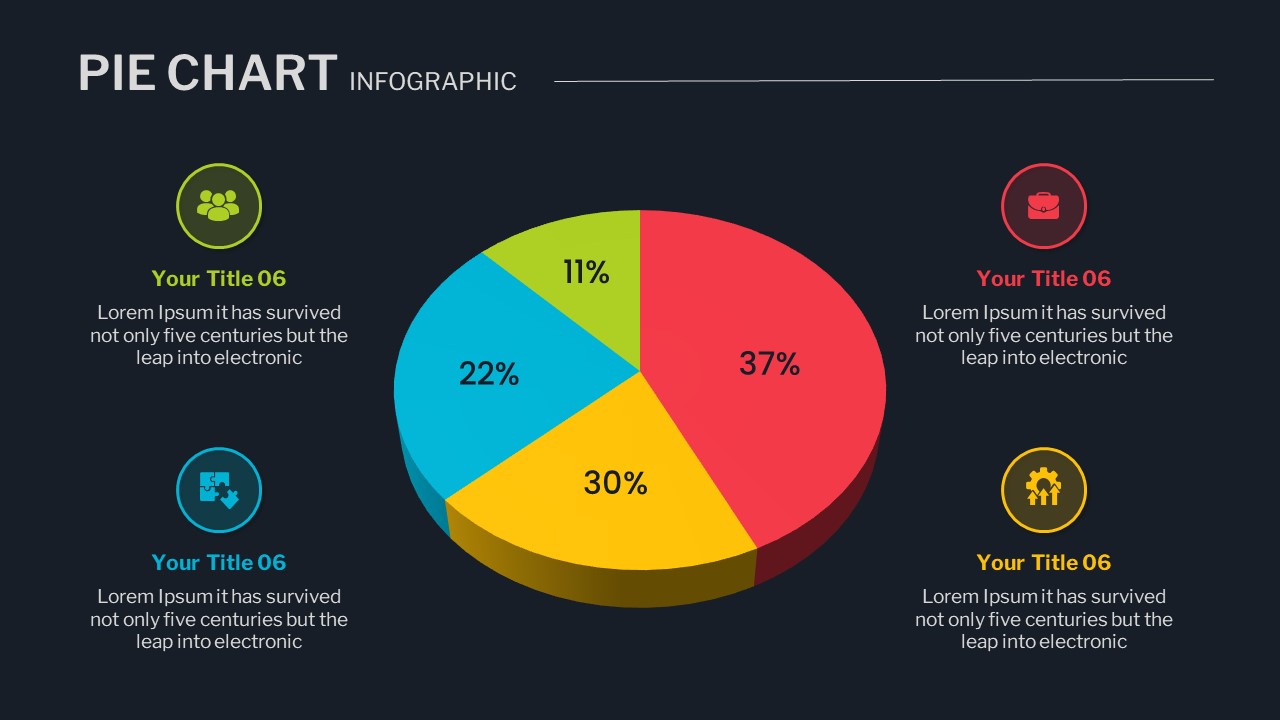
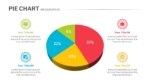
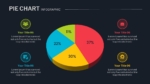
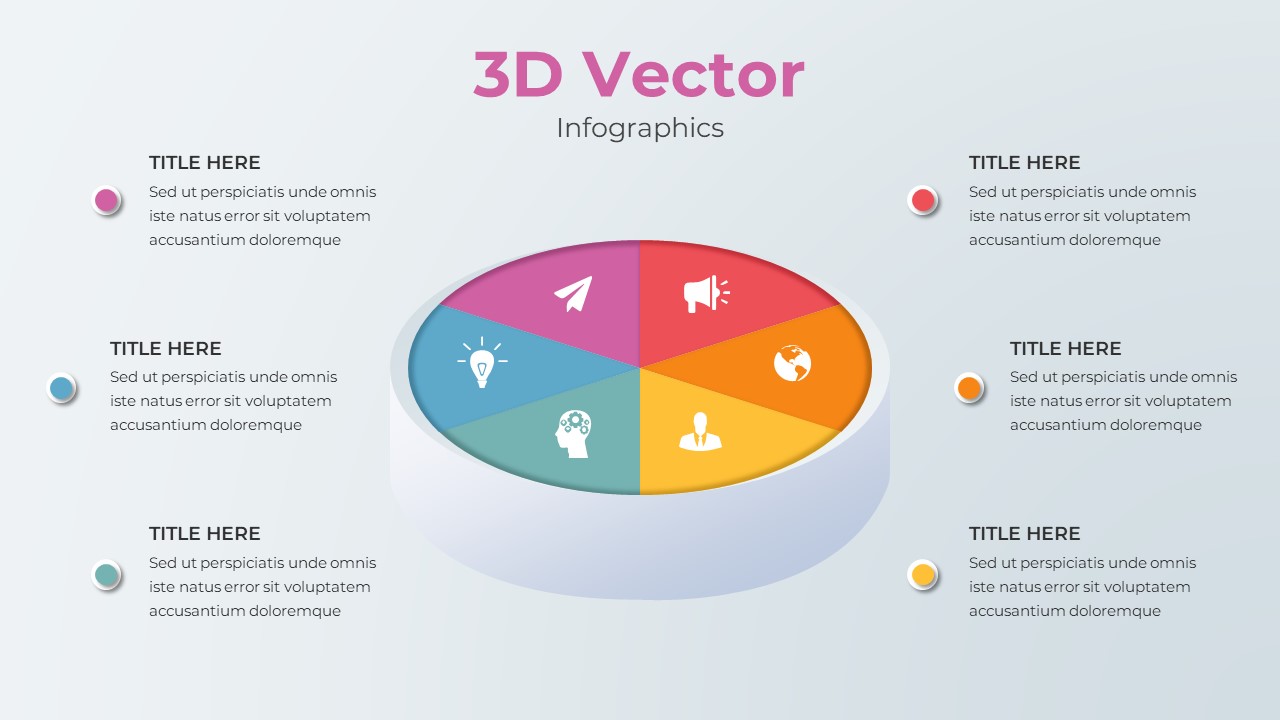
The Pie Chart Infographic Template is a clear and effective visual tool designed to present data in an easy-to-understand pie chart format. This Infographic Pie Chart PowerPoint template is perfect for showcasing proportional data across multiple categories, with each segment of the pie chart representing a percentage of the whole. The vibrant colors red, yellow, blue, and green ensure that each category is distinctly identifiable, making your data presentation visually engaging and straightforward.
Accompanying the pie chart are four labeled sections with icon placeholders, providing space for detailed descriptions or insights about each segment. This pie chart design PowerPoint slide makes the presentation especially useful for business reports, marketing analytics, financial overviews, or any presentation that requires a comparison between different data points. The inclusion of relevant icons further enhances the clarity and organization of your data, making it easy for your audience to follow along and absorb key information.
Fully customizable and available in PowerPoint and Google Slides formats, this template allows you to edit the percentages, colors, and text to match your presentation’s theme and data. Whether you’re breaking down sales data, market share, project budgets, or customer demographics, this template will help you convey your message with precision and professionalism.
See more

Aspect Ratio
16:9Item ID
SKT00659
FAQs
You May Also Like These Presentation Templates


- Free
- Free

- Free

- Free

- Free
- Free
- Free
- Free
- Free