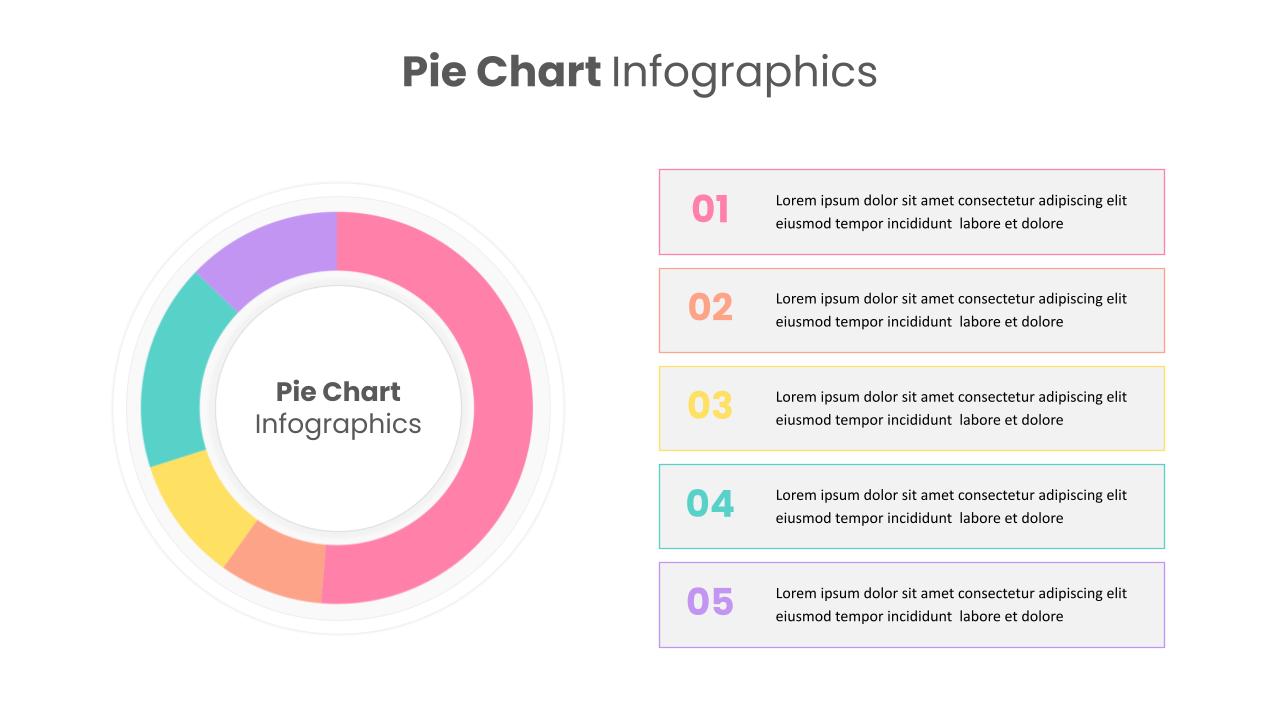
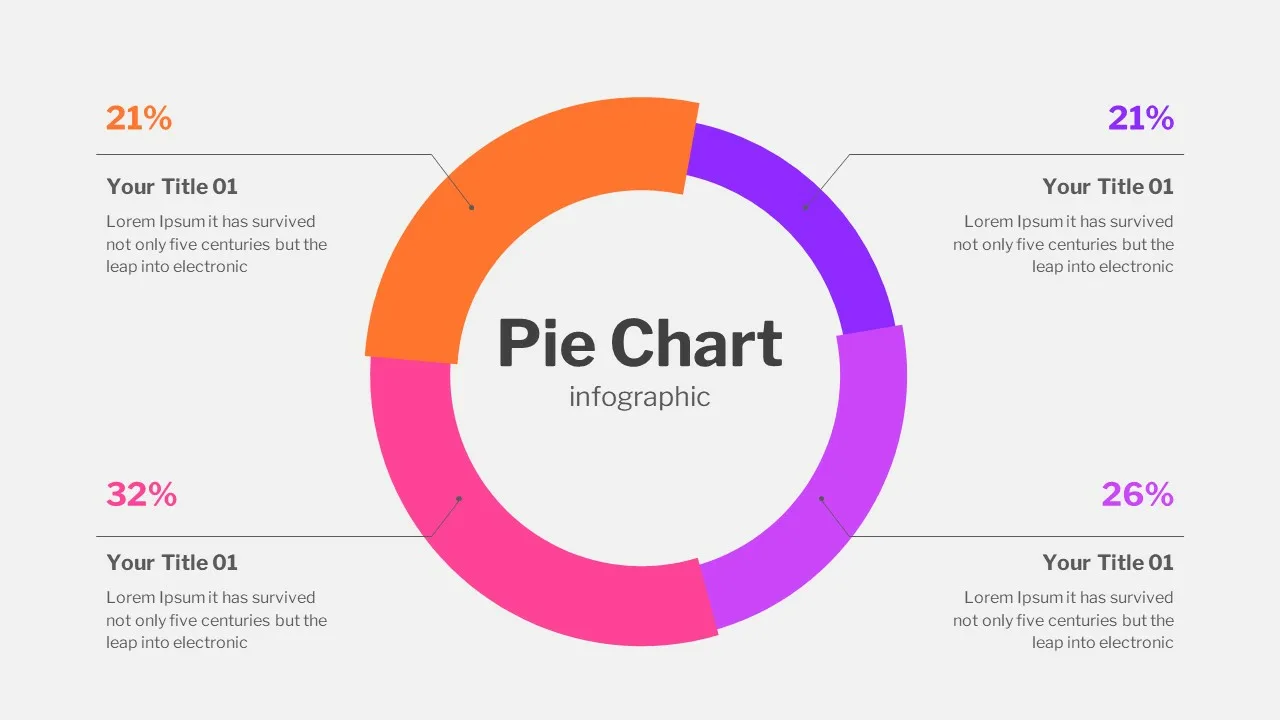
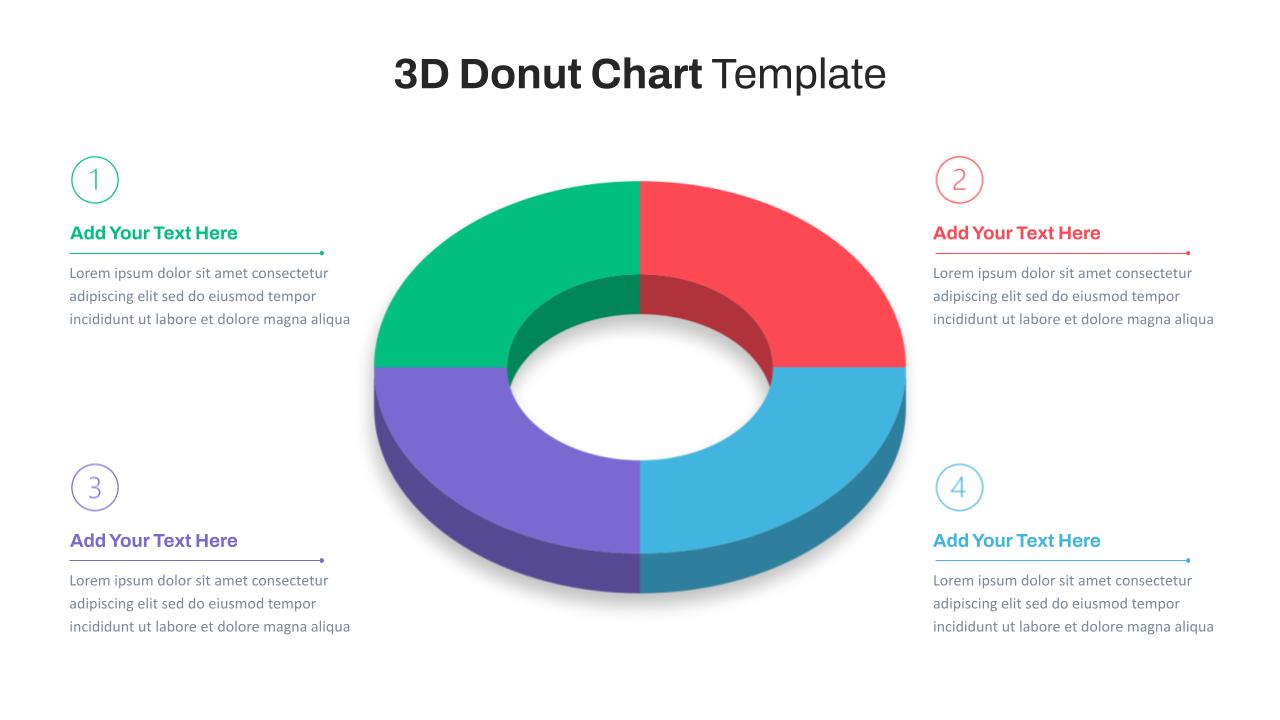
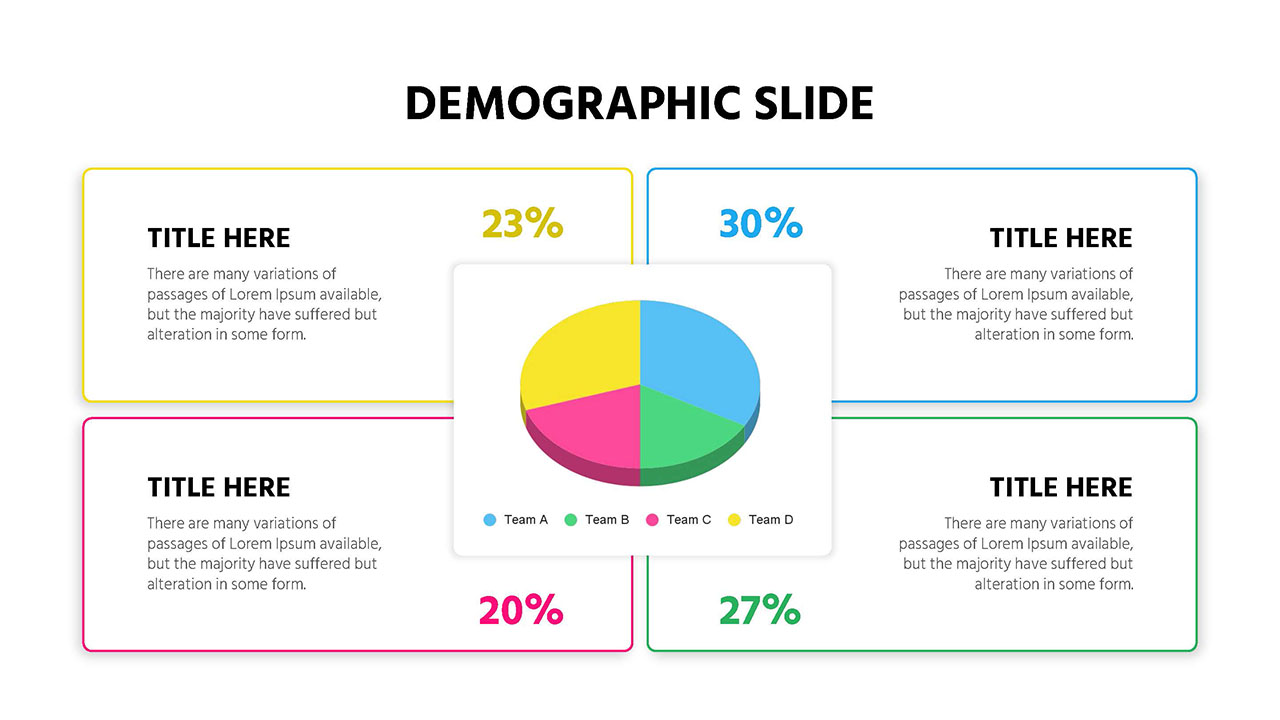
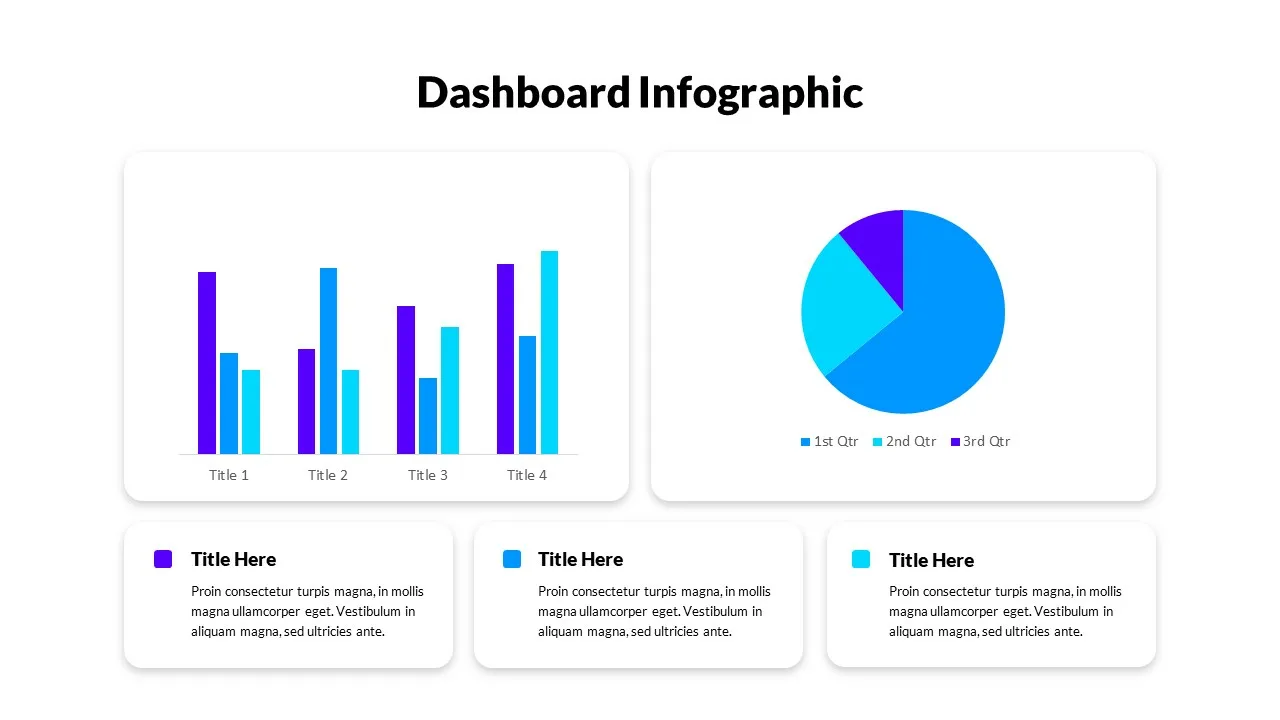
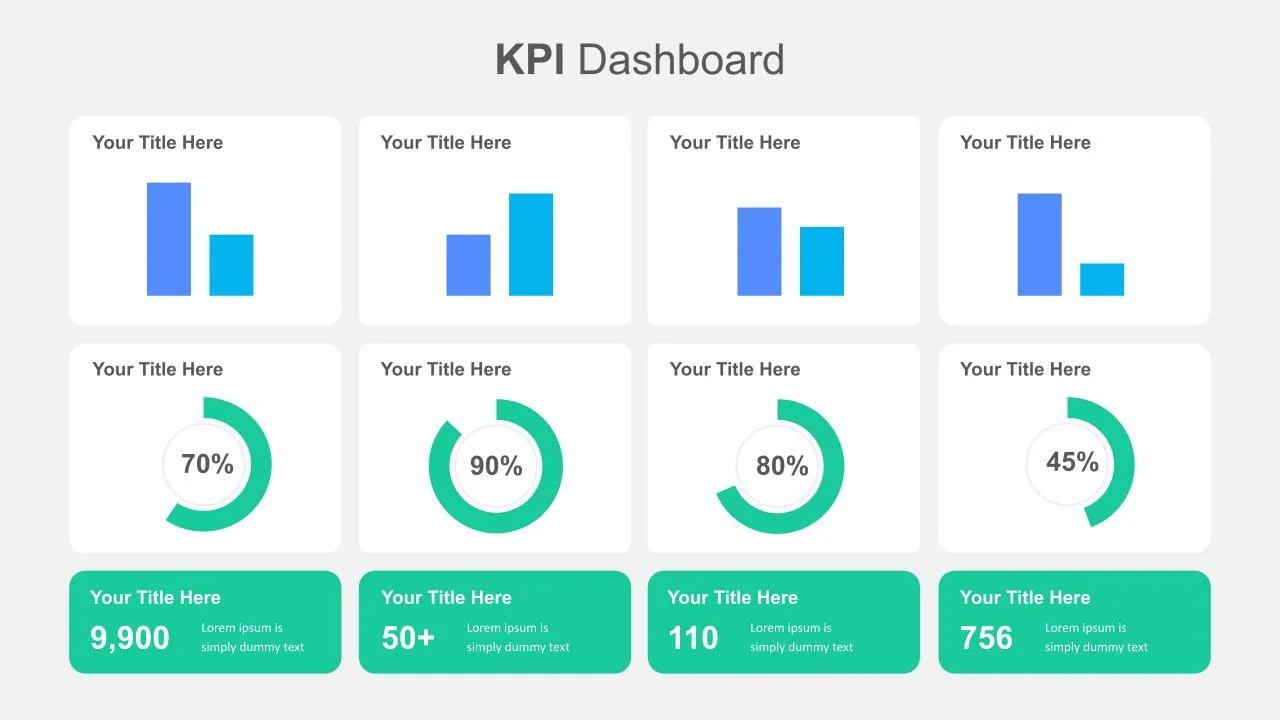
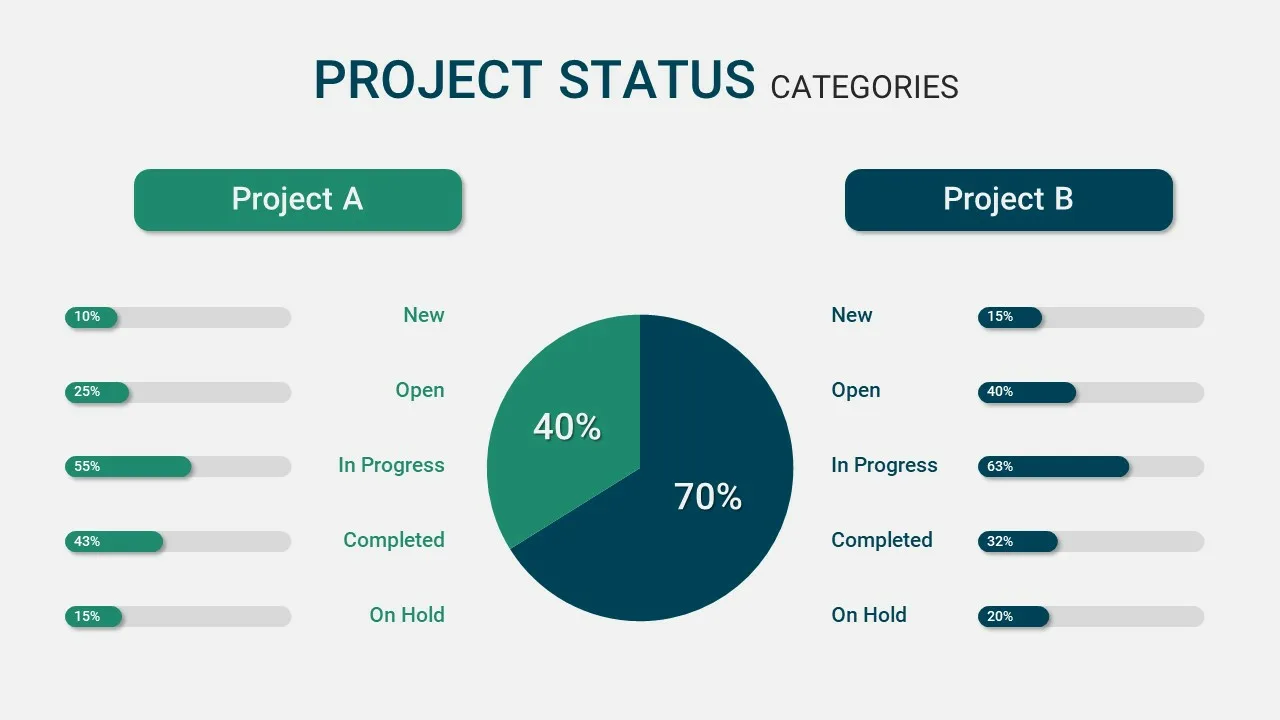
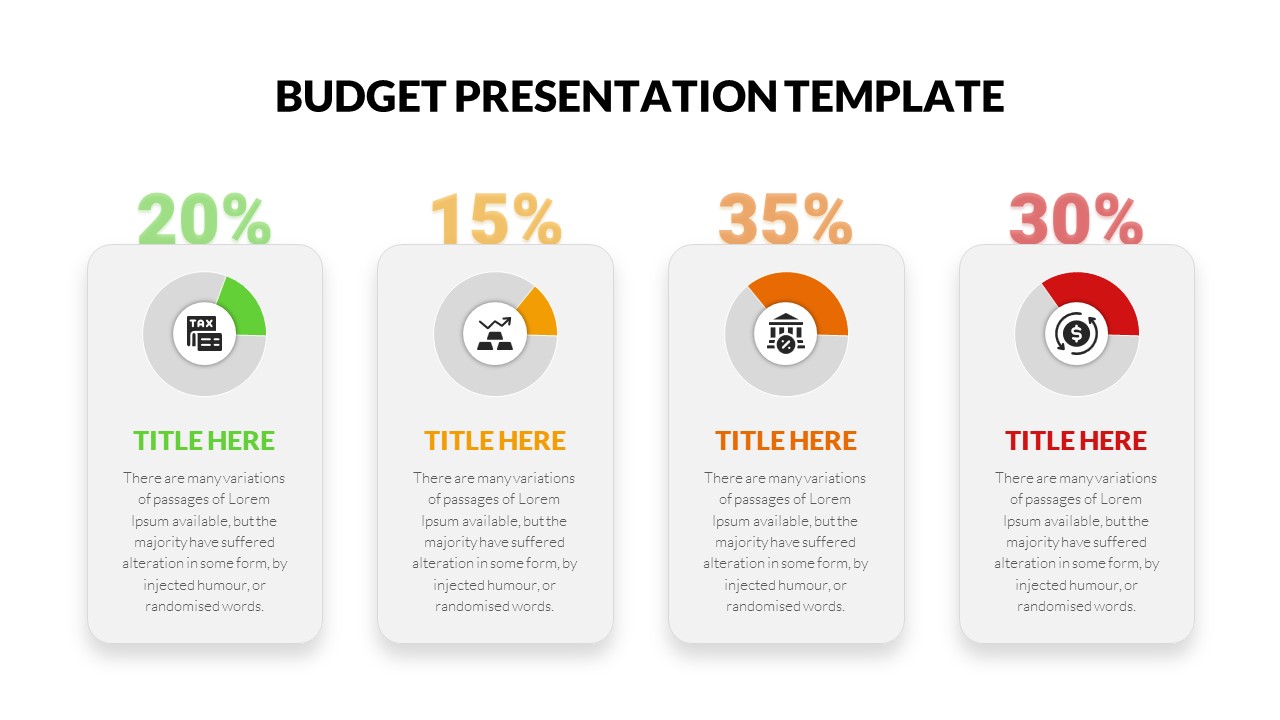
Pie Chart Slide Template
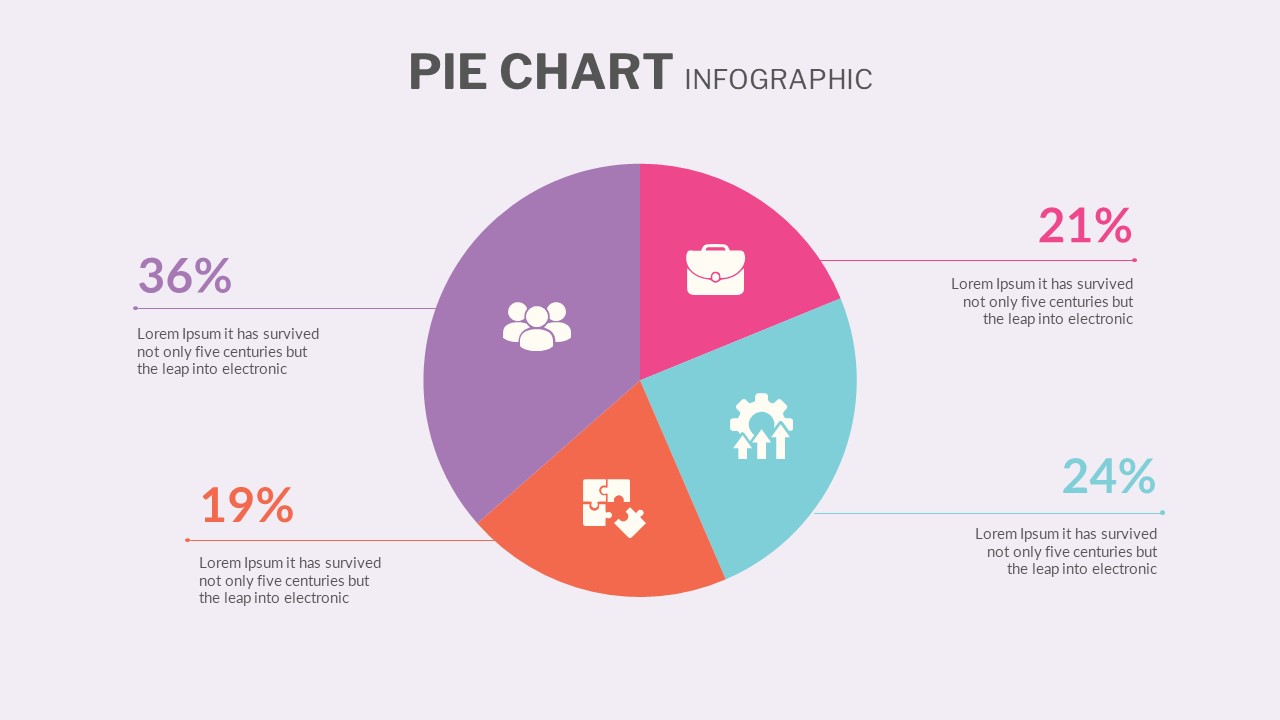


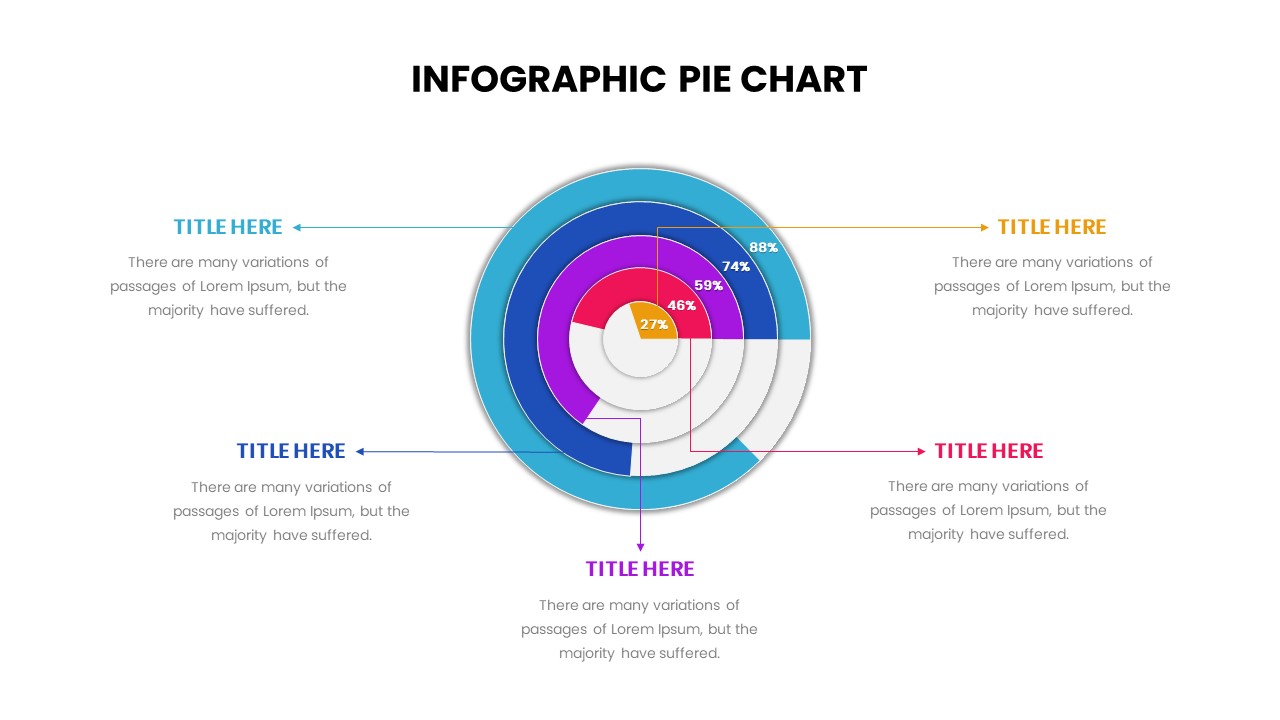
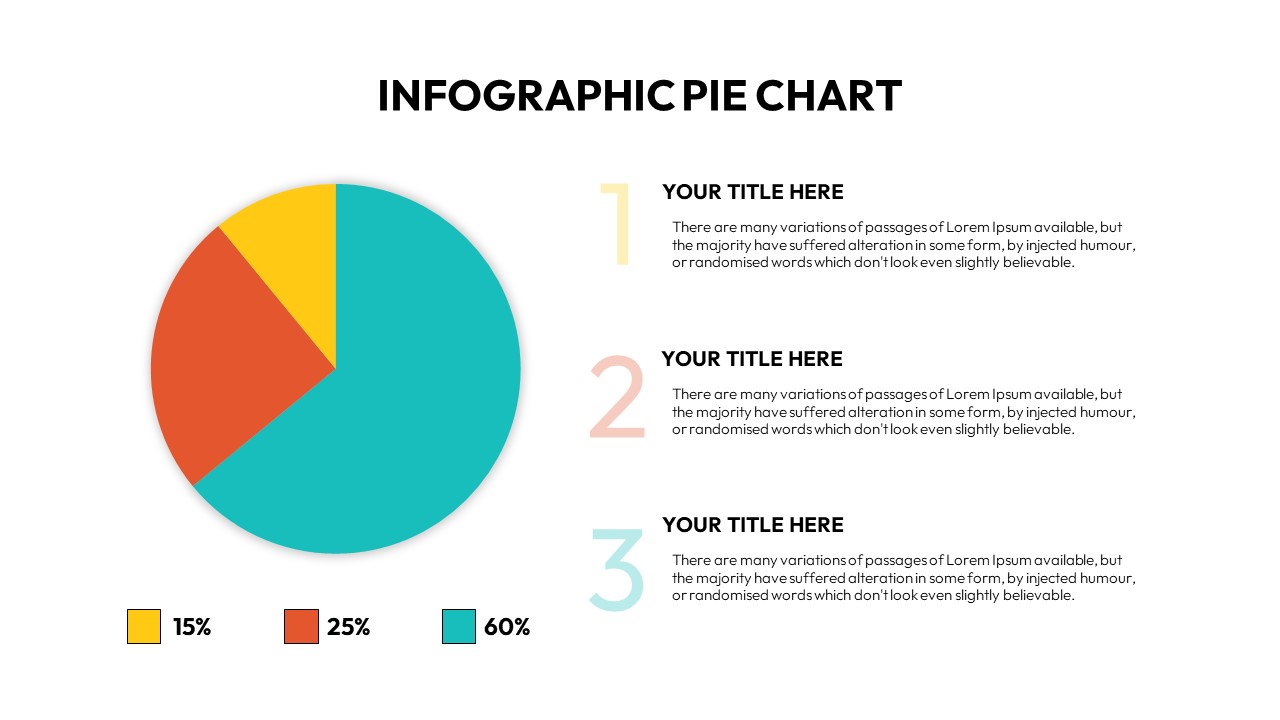
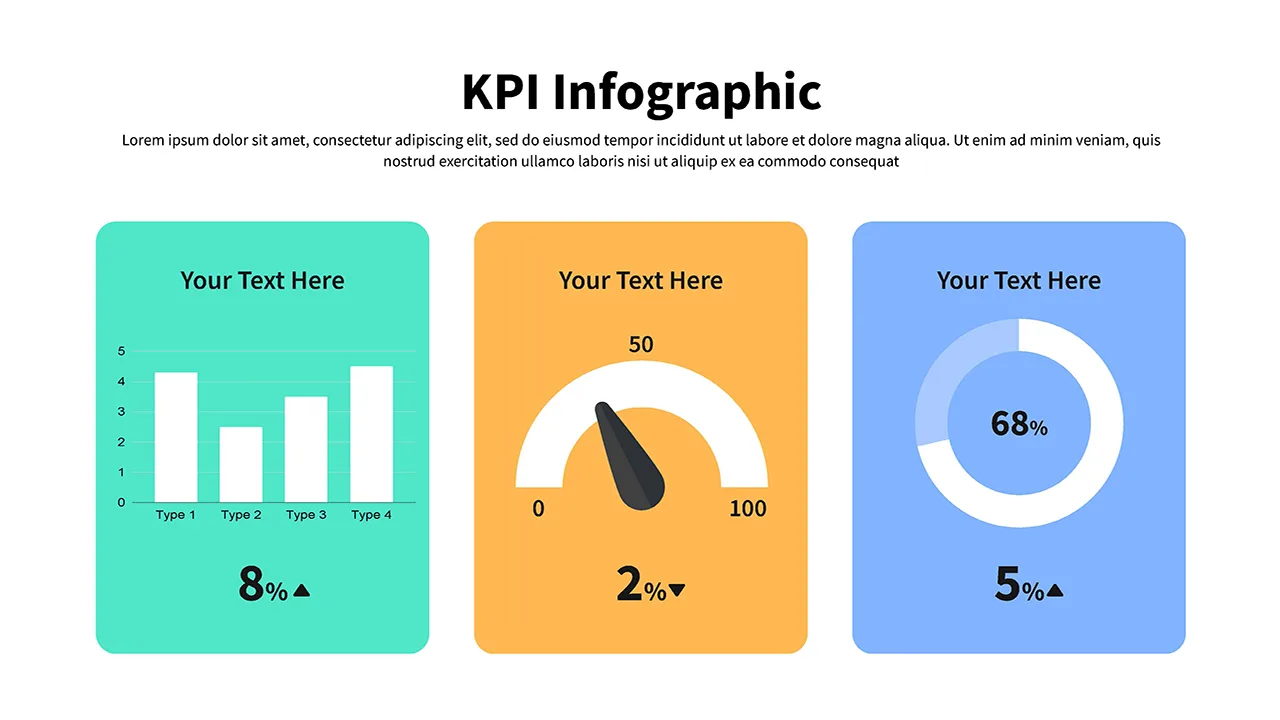
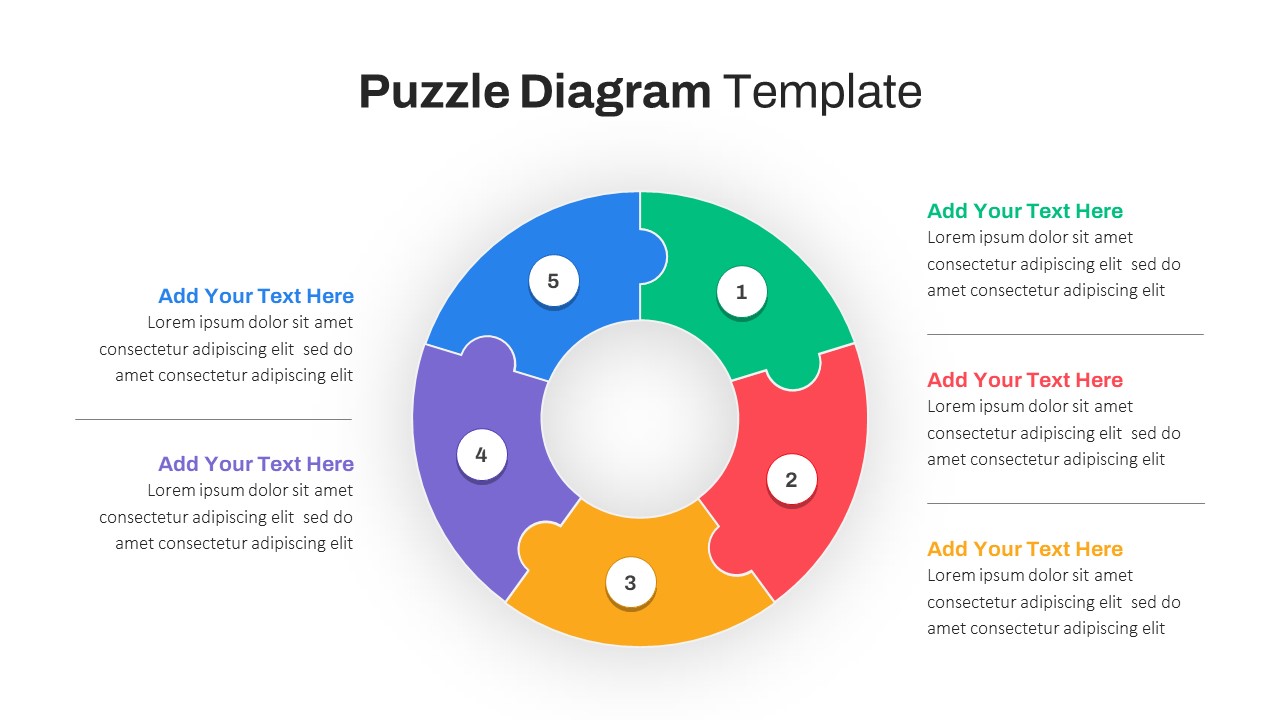
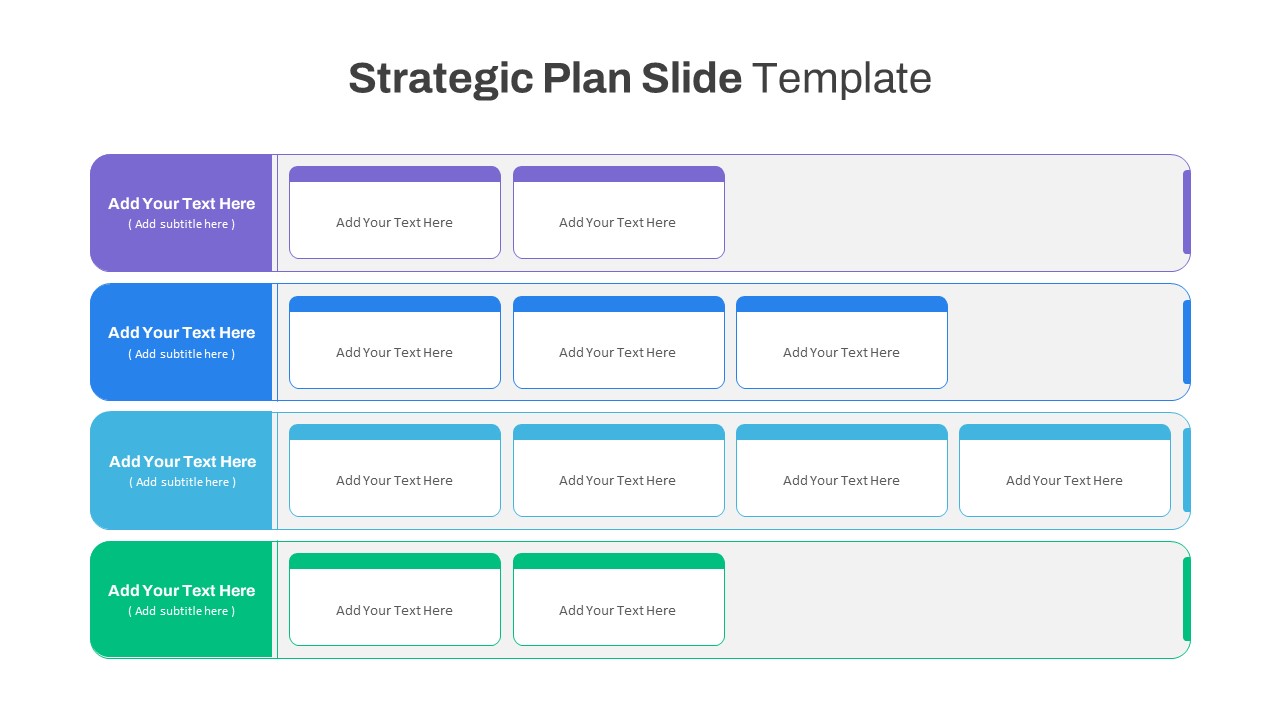
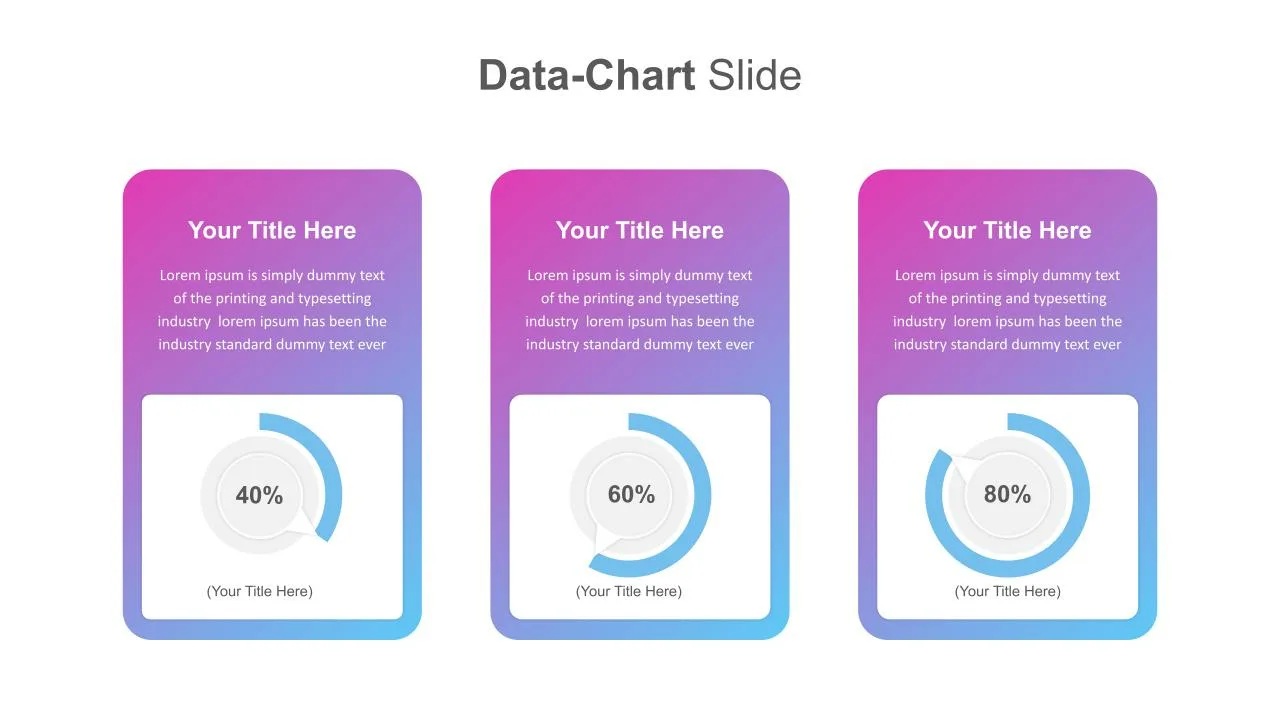
Pie Chart Slide Template is a cool infographic to show the distribution of items. The four-sliced pie chart template allows the users to slice more divisions according to their data in hand. Data-driven charts in PowerPoint presentations enable the user to provide statistical data with a visually appealing diagram. Pie Chart Slide is ideal for accounting presentations, finance presentations, and all types of qualitative data presentations as well. Pie charts are easy-to-understand diagrams that pass messages and complex statistical data in a simple structure. The uses can explain a project’s key metrics, such as performance, time, completion, and cost incurred. Use simple pie chart templates now!
See more

Aspect Ratio
16:9Item ID
SKT00656
You May Also Like These Presentation Templates


- Free
- Free
- Free
- Free