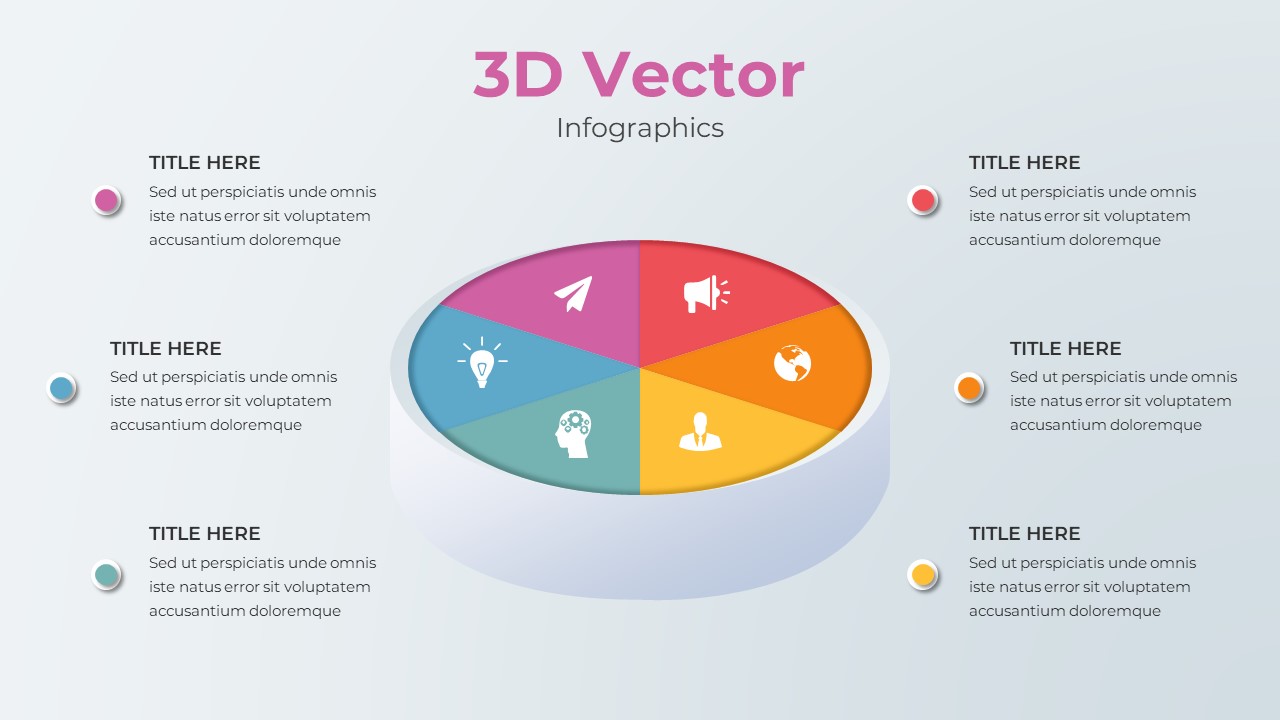
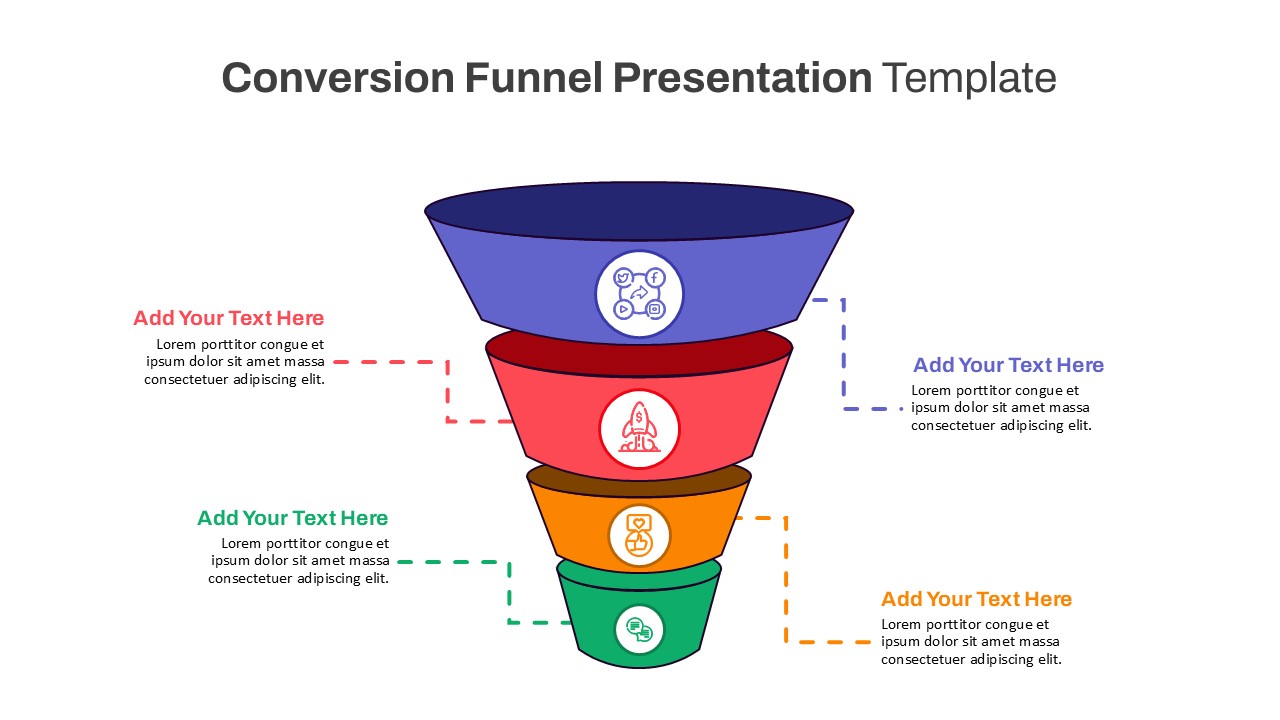
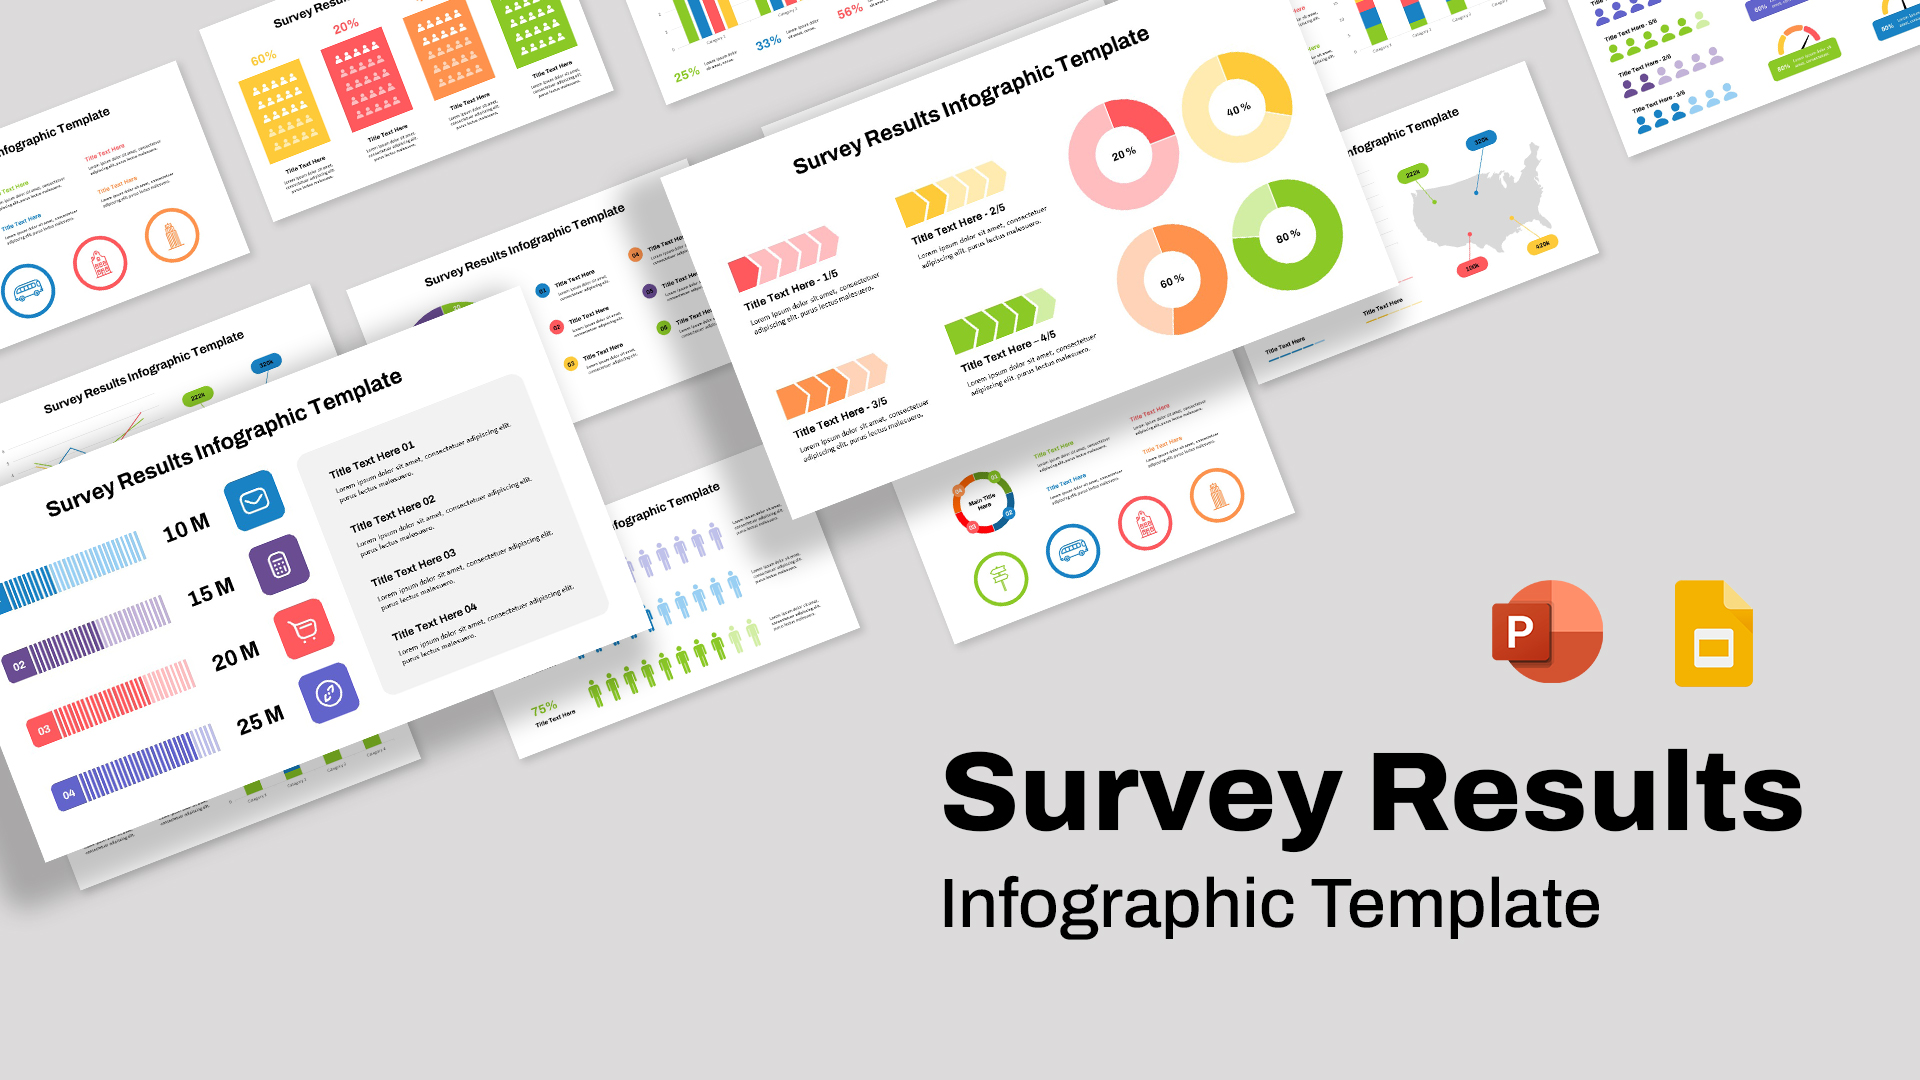
Pie Chart Template for Visualizing Proportions and Percentages

The Pie Chart For PPT Template for Visualizing Proportions and Percentages is an essential tool for presenting data-driven insights in a visually compelling way. This template is designed to highlight key data segments and percentages, making it ideal for reporting, performance reviews, and market analysis. With its circular, divided layout, the template effectively showcases how different parts contribute to a whole, allowing viewers to easily interpret and compare the significance of various categories.
Each segment of the pie chart is color-coded, ensuring that data distinctions are clear and easy to follow. Accompanying text areas around the chart provide space to add detailed explanations or supporting information for each percentage, offering context to your audience. Whether you are presenting financial data, customer demographics, product performance, or survey results, this pie chart format delivers a professional and simplified way to communicate complex information.
Fully customizable, the template allows users to adjust colors, percentages, and text to fit their specific needs. Its clean and minimalistic design makes it adaptable for any industry, from business to education, marketing, or research. By leveraging this template, you can transform raw data into a meaningful narrative that supports better decision-making and enhances the impact of your presentation.
See more

Aspect Ratio
16:9Item ID
SKT01704
Features of this template
Other User Cases of the Template:
Sales performance reviews, customer segmentation analysis, product performance breakdown, financial reporting, marketing campaign results, survey data presentation, operational efficiency tracking, business performance metrics, educational reports, project status updates.FAQs
You May Also Like These Presentation Templates


- Free
- Free
- Free
- Free


- Free
- Free
- Free

- Free
- Free
- Free
- Free