Free Pie Diagram Template

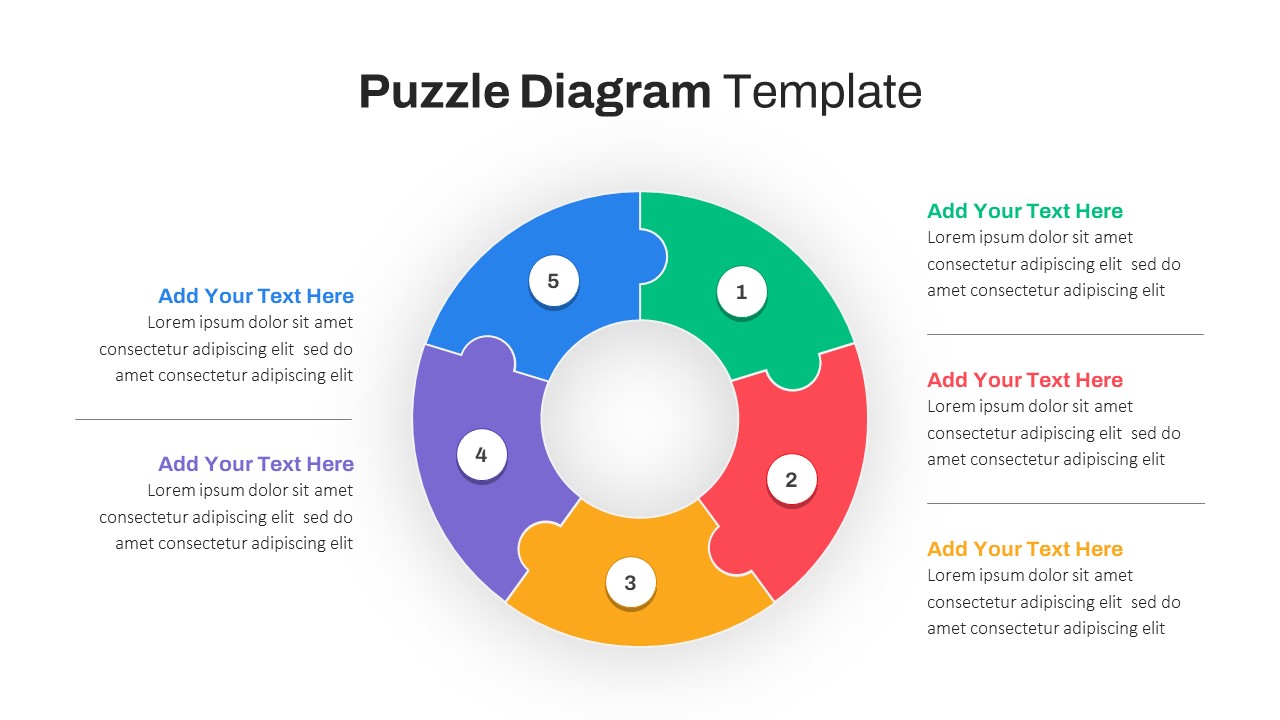
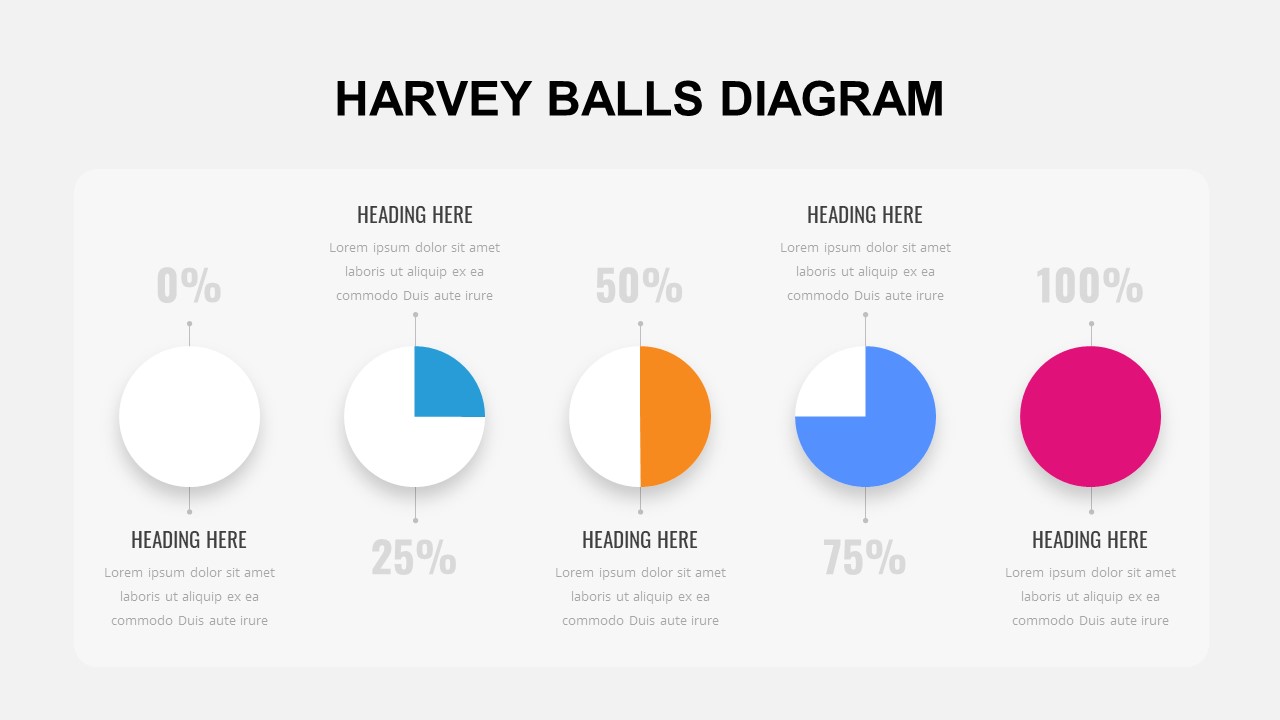
The Pie Diagram Template is a versatile and visually appealing tool for presenting data in a clear and concise manner. Ideal for business professionals, educators, marketers, and data analysts, this template helps in simplifying complex data sets by breaking them down into easy-to-understand segments. With a modern design, the pie chart at the center is divided into distinct color-coded sections, representing different categories or data points, making it simple for viewers to interpret.
Accompanying the pie chart are text placeholders on either side, where percentages and detailed descriptions can be inserted for each section of the chart. The floating speech bubble design for the text adds a creative and modern touch, while keeping the focus on the data being presented. This template is particularly useful for data-driven presentations such as market analysis, financial reports, survey results, product breakdowns, or any scenario where data visualization enhances audience comprehension.
Fully customizable in both PowerPoint and Google Slides, the Pie Diagram Template allows users to modify colors, text, and icons to match the specific needs of their presentation. Whether you need to adjust the percentages or replace icons, this template provides flexibility and ease of use, making it an essential tool for delivering professional and polished presentations.
See more

Aspect Ratio
16:9Item ID
SKT01642
Features of this template
Other User Cases of the Template:
Market segmentation analysis, customer survey results, financial breakdowns, product performance reviews, business growth reports, competitive analysis, sales data presentations, educational data visualization, company performance reviews, demographic analysis, budget allocation presentations.FAQs
You May Also Like These Presentation Templates


- Free
- Free


- Free
- Free

- Free
- Free
- Free
- Free
- Free