Population Pyramid PowerPoint Template
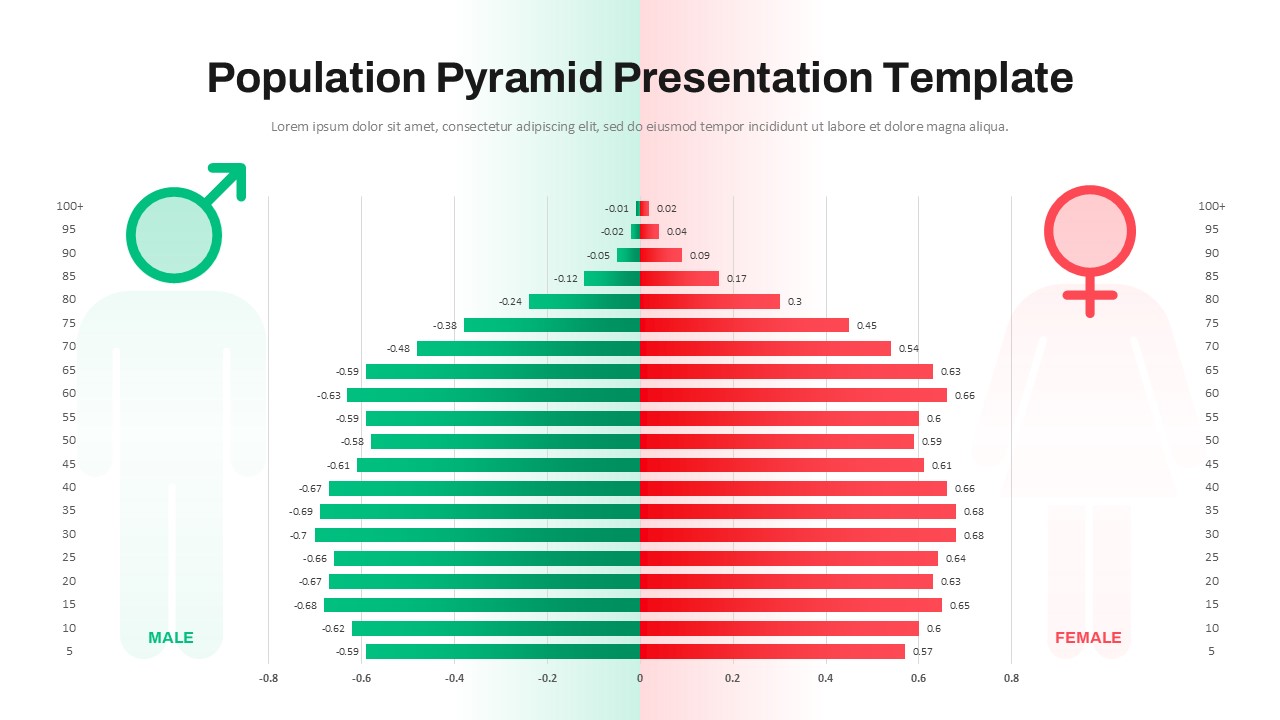
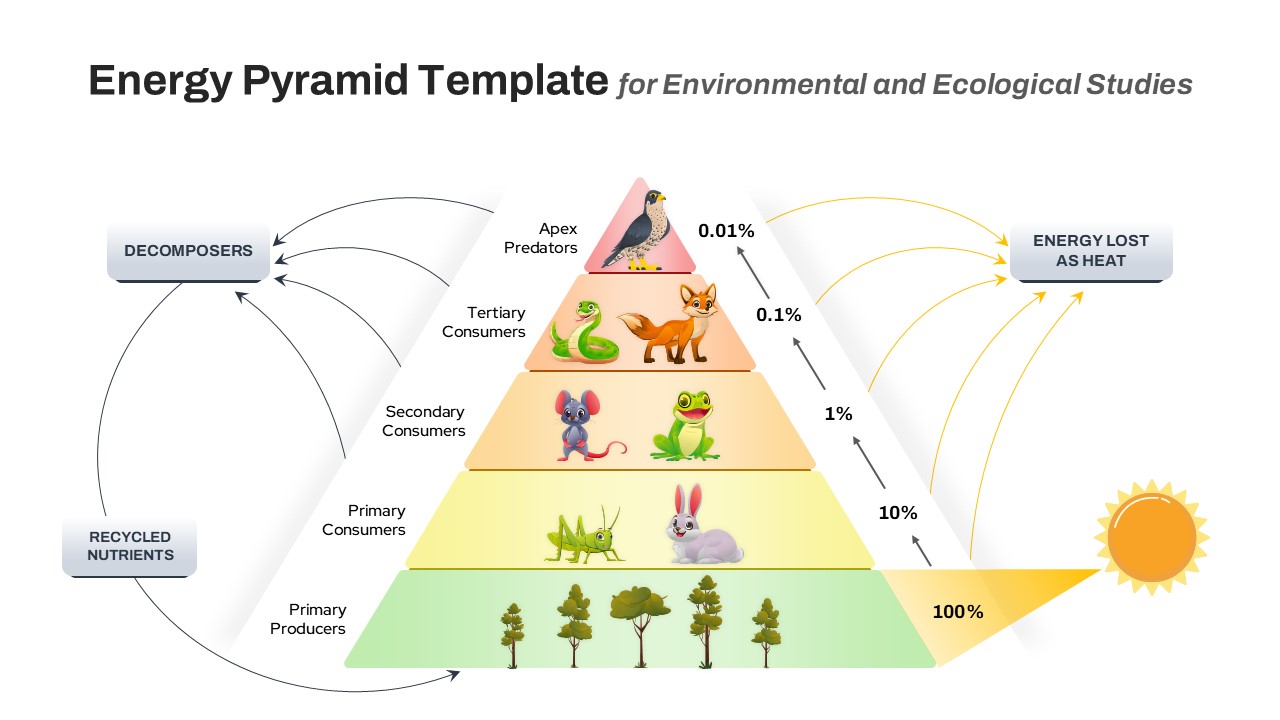
The Population Pyramid Presentation Template is a highly effective tool for visualizing demographic data. This Population Pyramid PowerPoint template features a classic population pyramid chart that highlights gender distribution across different age groups. The left side, marked in green, represents the male population, while the right side, colored red, represents the female population. This layout provides a clear visual comparison of population structures, making it ideal for demographic studies, population trends, or social science presentations.
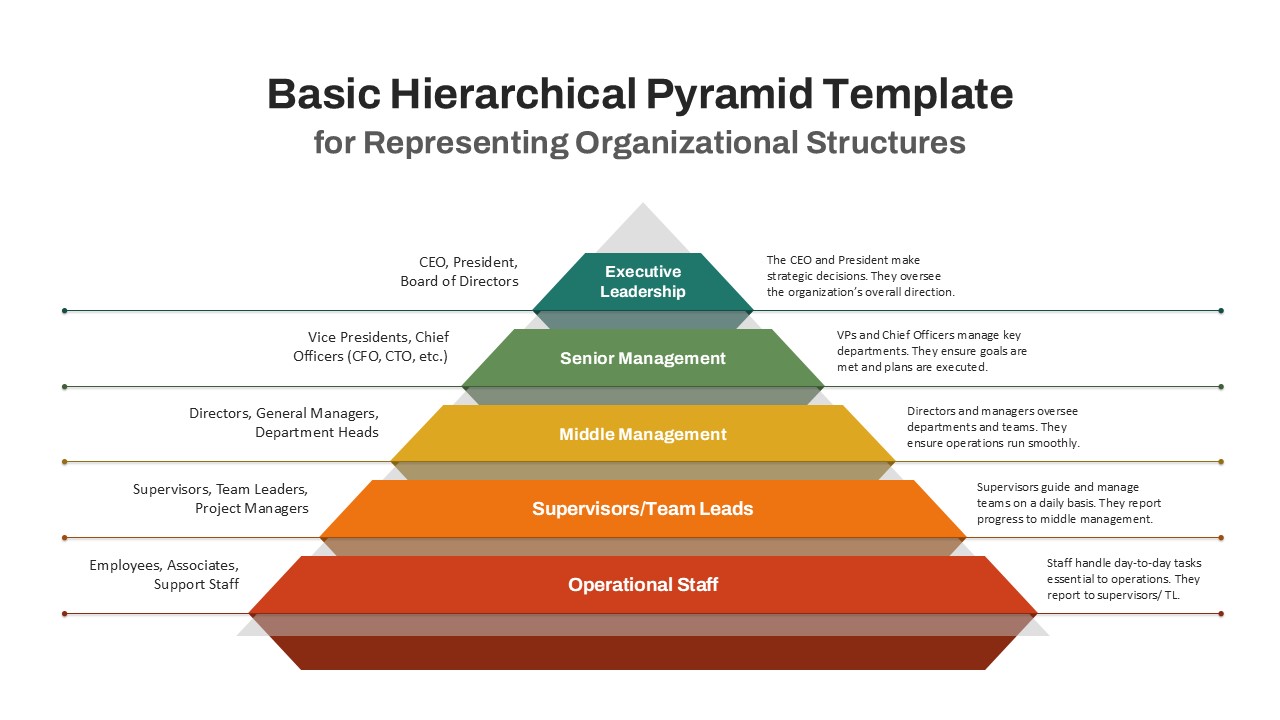
This template is perfect for illustrating age group analysis, gender ratio comparisons, and population growth or decline over time. Whether you’re presenting at an academic conference, working on a social research project, or creating reports for governmental agencies, the simple yet informative design ensures that the data is easy to interpret and visually appealing. The pyramid’s structured design allows for the breakdown of various age brackets, providing insight into generational population shifts, labor force distribution, or healthcare needs.
Available in both PowerPoint and Google Slides formats, this fully customizable template allows you to adjust the data, labels, and colors to fit your presentation needs. Whether used for education, policymaking, or corporate strategy, this template provides an organized and professional format for demographic data presentations. Download Now!
See more

Aspect Ratio
16:9Item ID
SKT01595
Features of this template
Other User Cases of the Template:
Demographic analysis, population growth studies, gender ratio comparisons, social science research, labor market studies, healthcare demand projections, governmental population reports, academic lectures, urban planning presentations, generational trend analysis.FAQs
You May Also Like These Presentation Templates


- Free
- Free


- Free
- Free

- Free
- Free
- Free
- Free
- Free
- Free
- Free
- Free
- Free
- Free
- Free