PowerPoint Radial Bar Chart Template for Circular Data Visualization

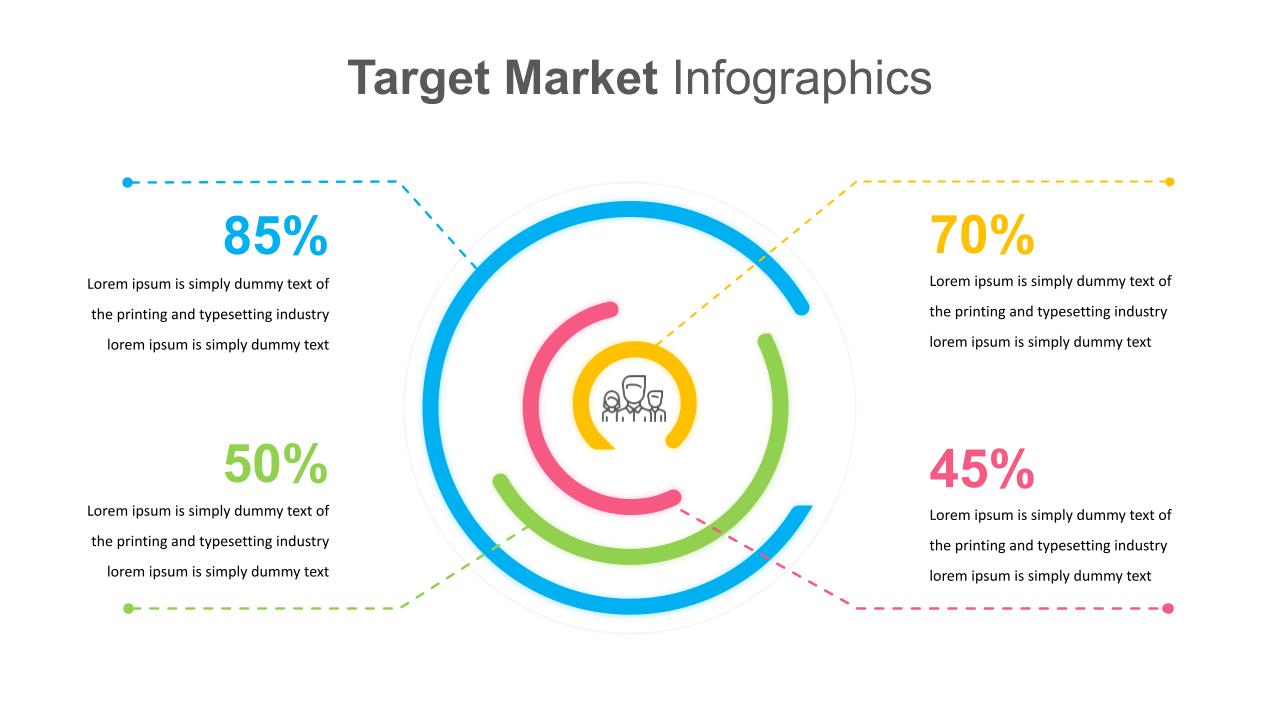
The Radial Bar Chart PPT Template for Circular Data Visualization offers a fresh and visually dynamic way to present data. Designed for professionals who want to break away from traditional bar and line charts, this radial diagram PowerPoint template allows you to showcase data in a radial format, making complex information more accessible and engaging. The circular design creates a unique and captivating layout, ideal for comparing multiple data sets or visualizing performance metrics over time.
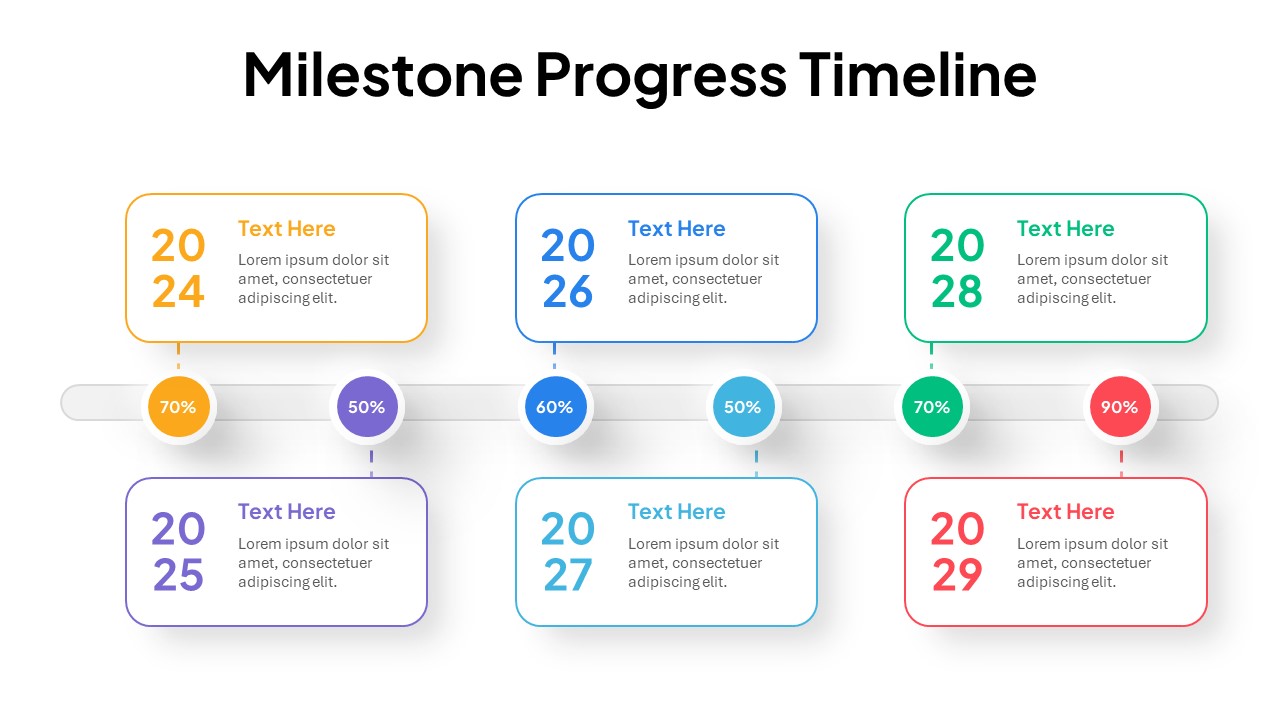
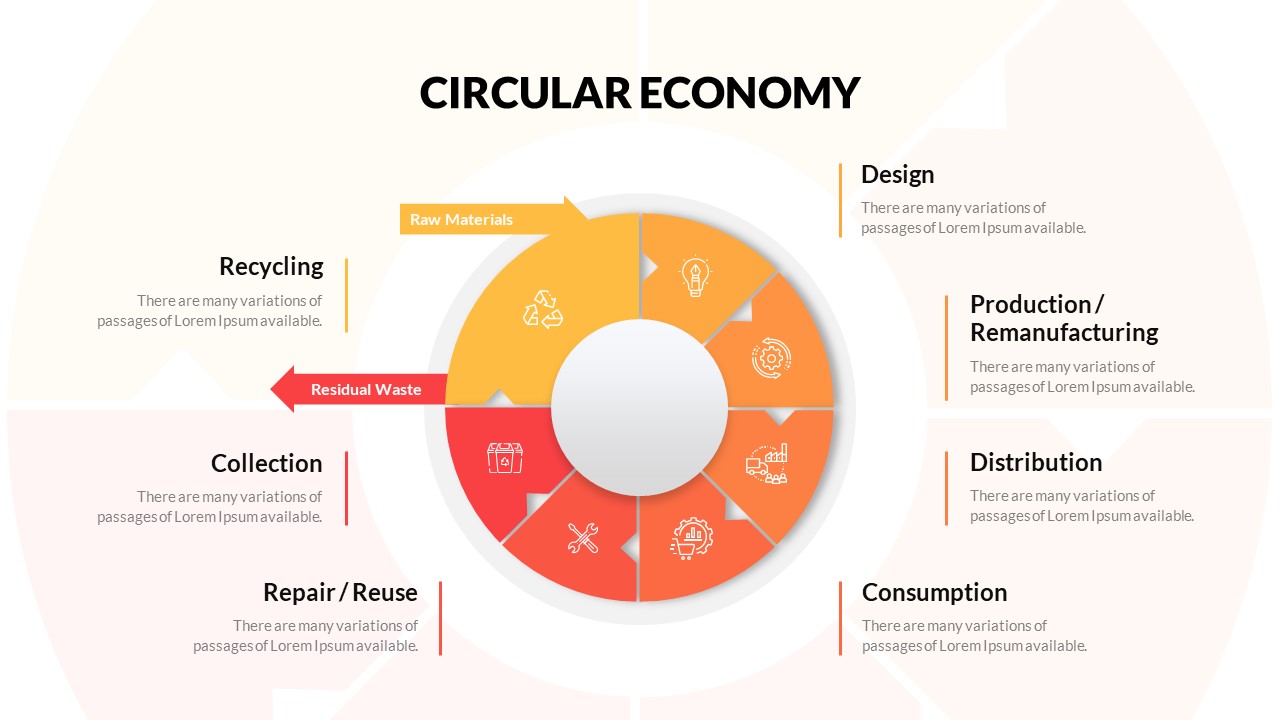
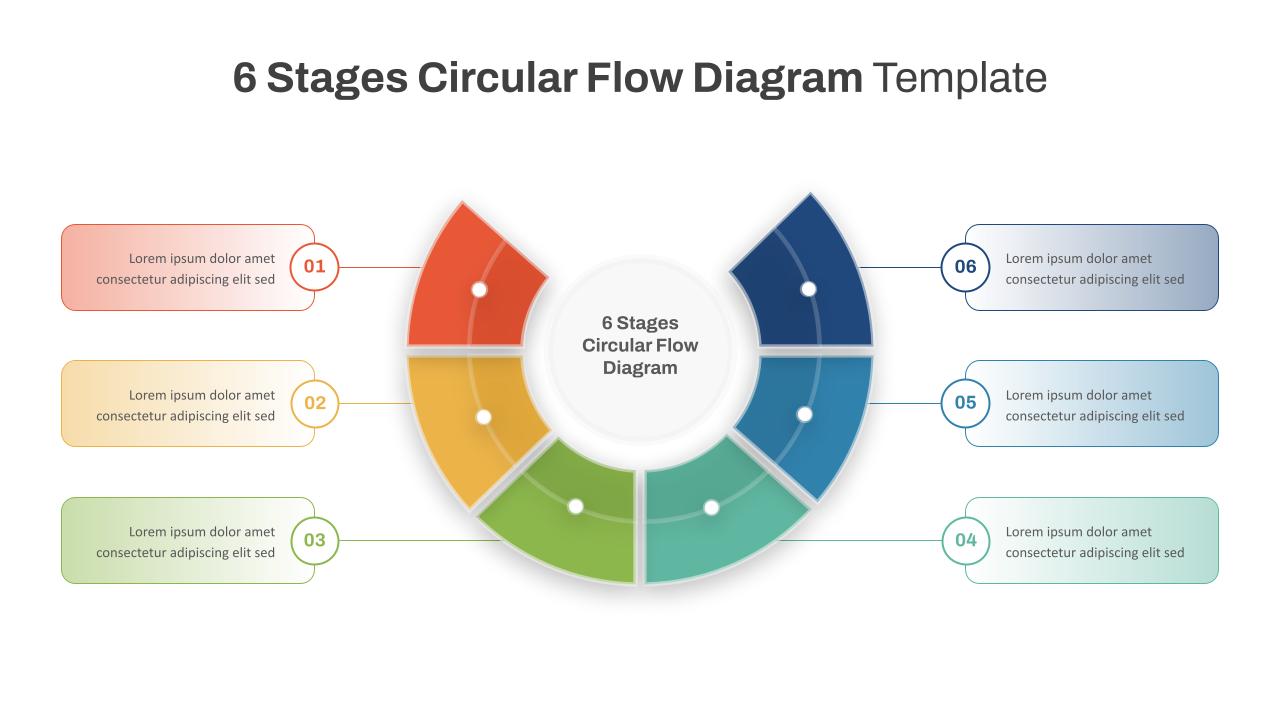
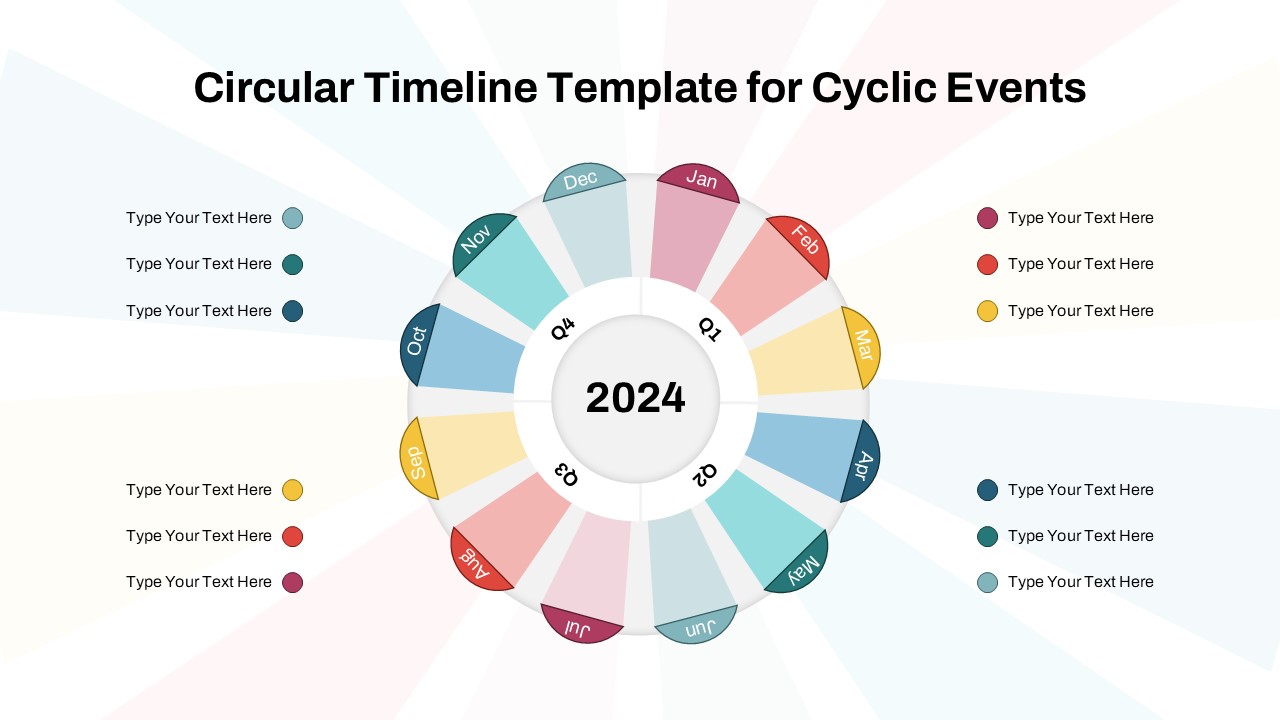
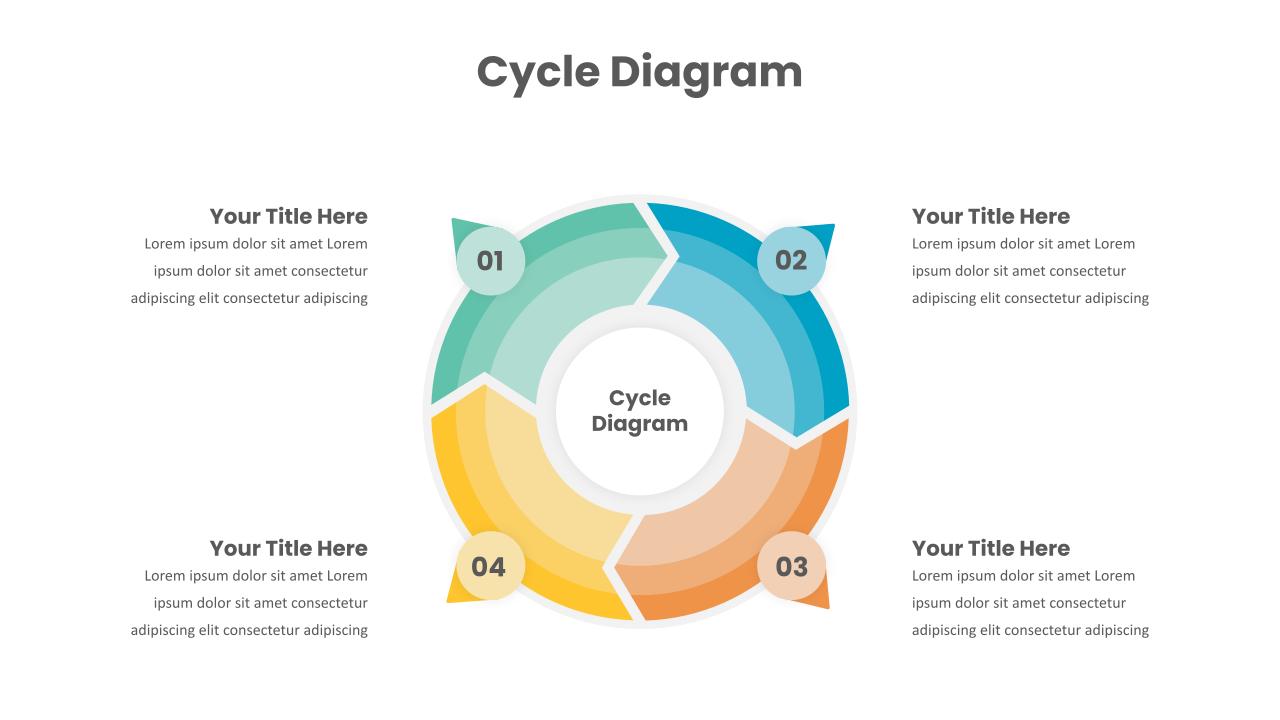
The concentric circles in this chart represent different data categories or variables, allowing you to illustrate growth, progress, or comparisons in a highly visual manner. The color-coded segments further enhance the clarity of the presentation, enabling viewers to easily distinguish between the different data points. Whether you are presenting sales figures, performance statistics, or progress tracking, this template brings a modern and innovative feel to your data-driven presentations.
This template is perfect for corporate meetings, marketing performance reviews, business growth tracking, or any scenario where data needs to be communicated with impact. Its versatility allows it to be adapted for various industries, from financial reports to customer satisfaction metrics, all while maintaining a clean and professional aesthetic.
See more

Aspect Ratio
16:9Item ID
SKT01650
Features of this template
Other User Cases of the Template:
business performance tracking, project progress reports, marketing campaign analysis, financial growth visualization, customer satisfaction surveys, KPI dashboards, employee performance reviews, data-driven storytelling.FAQs
You May Also Like These Presentation Templates


- Free
- Free
- Free


- Free
- Free
- Free
- Free

- Free
- Free