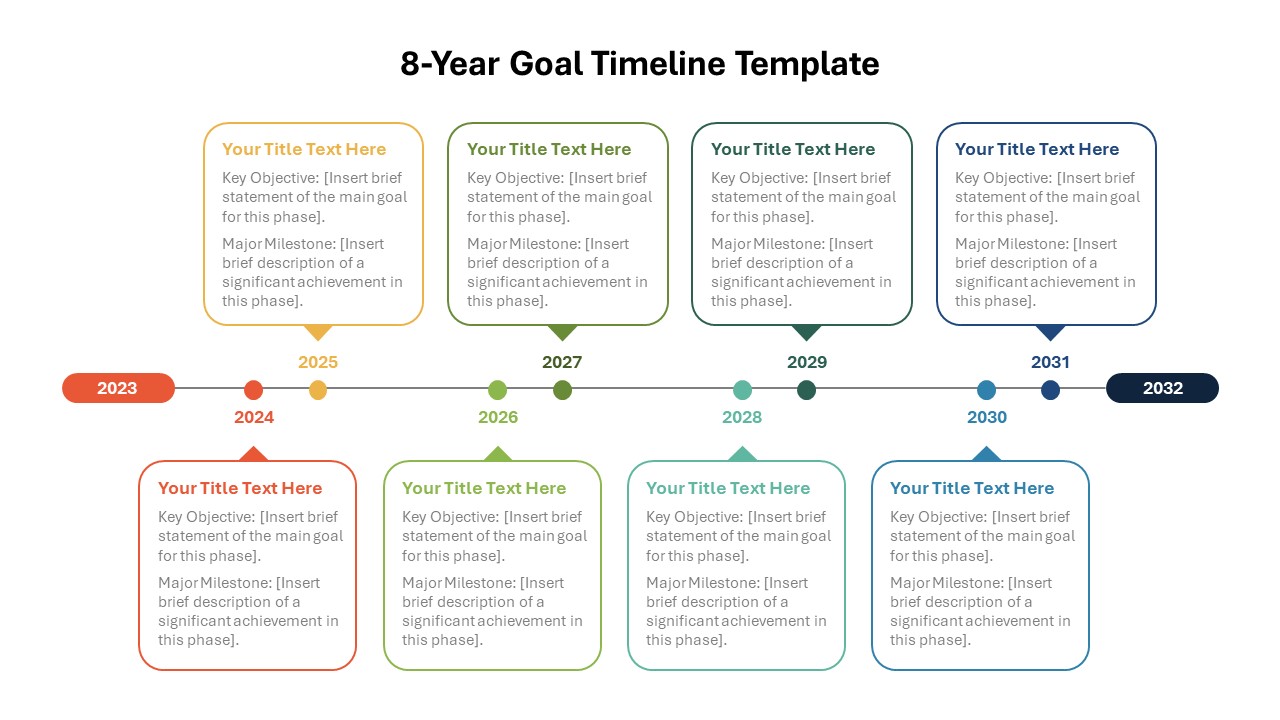
PowerPoint Timeline Comparison Template

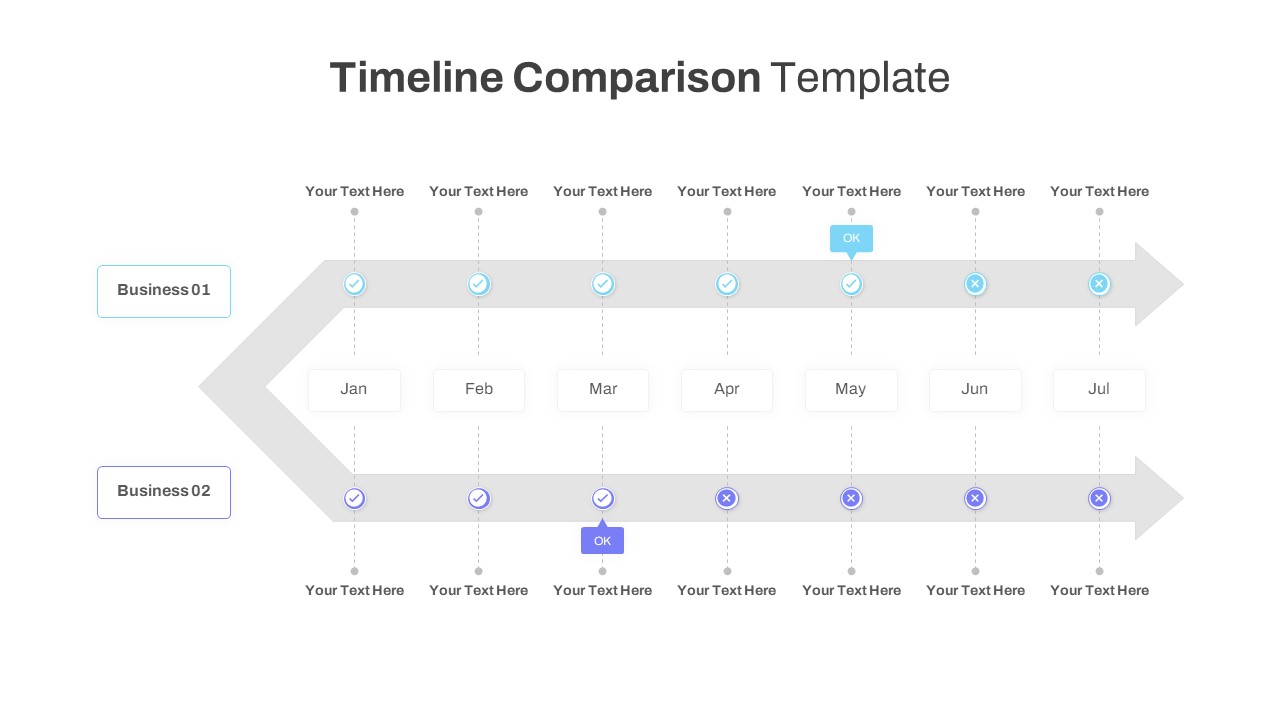
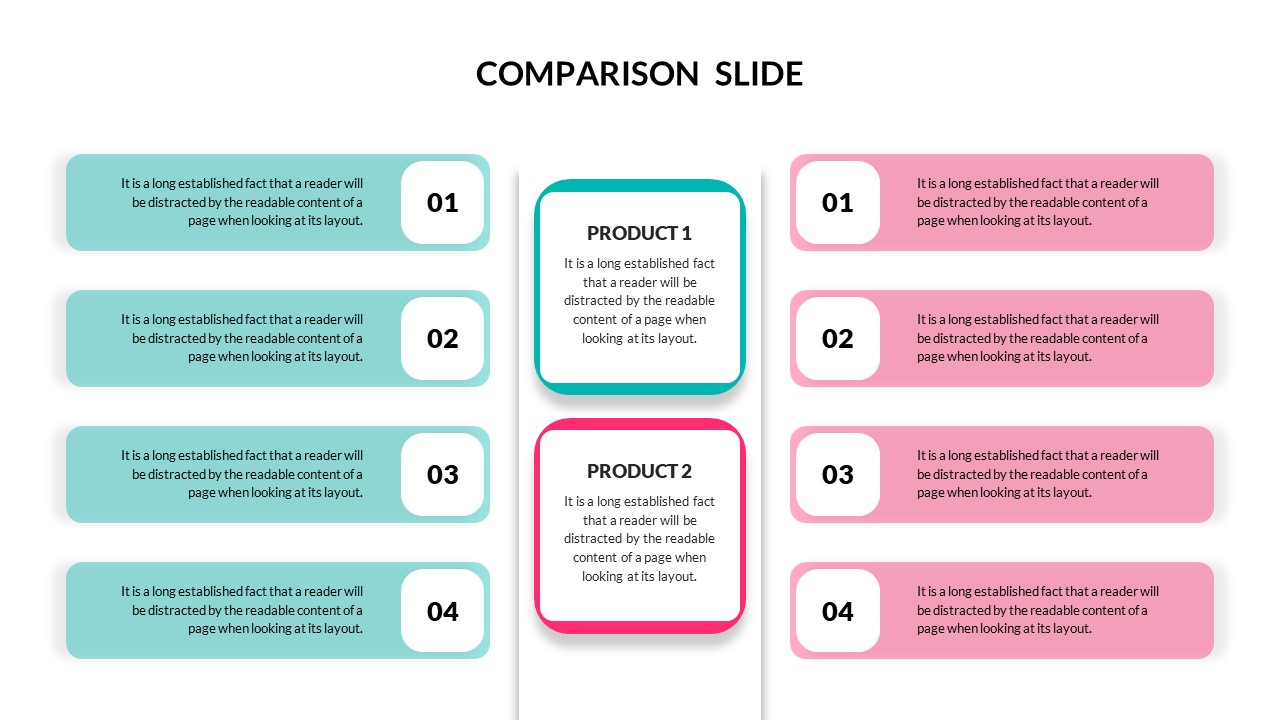
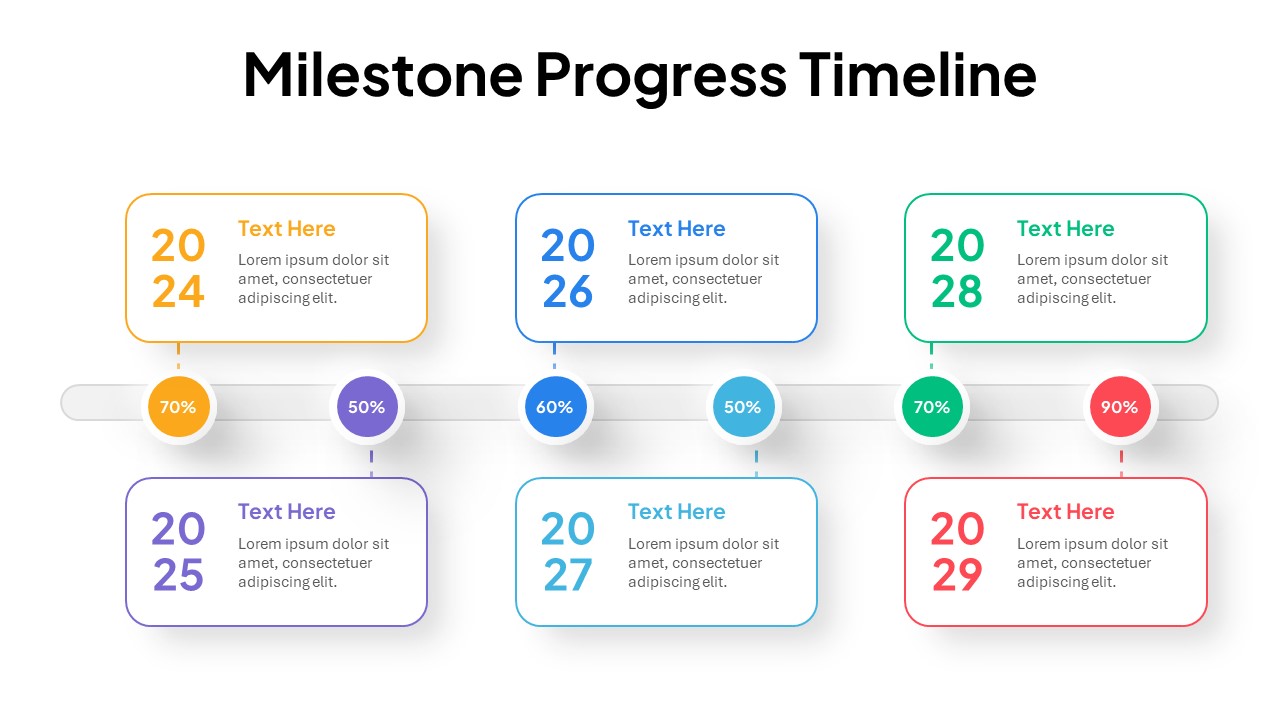
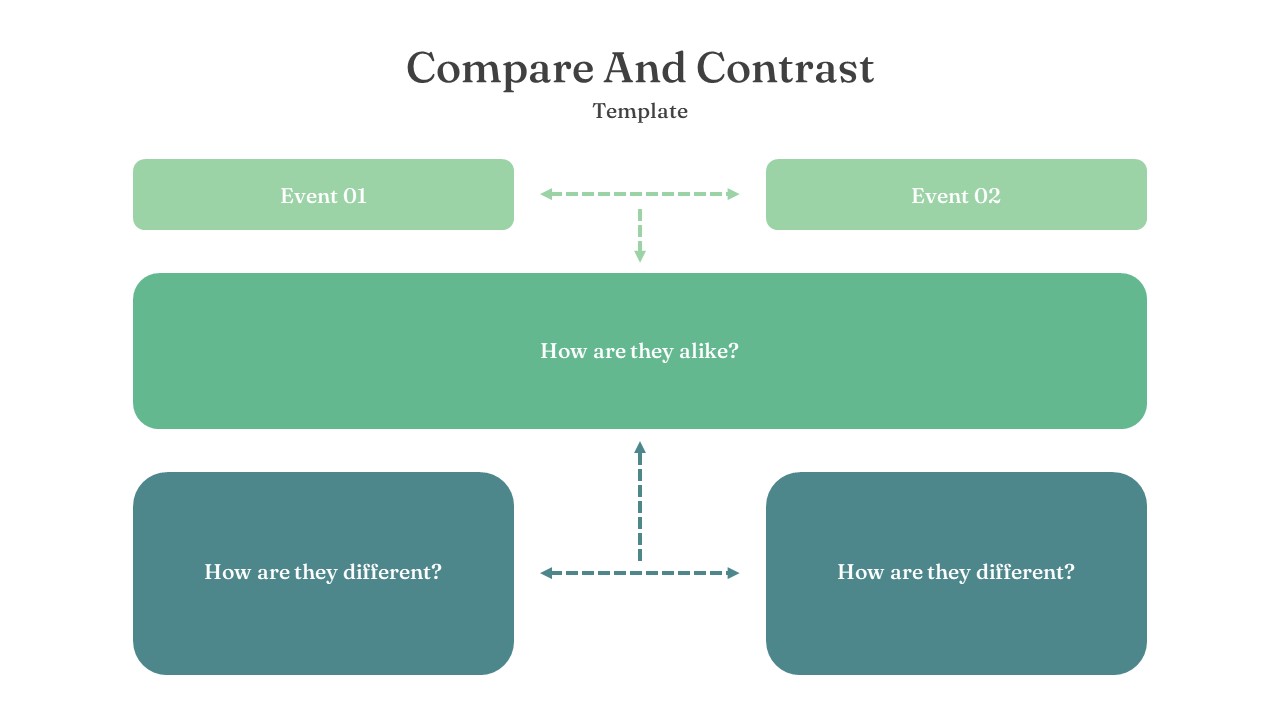
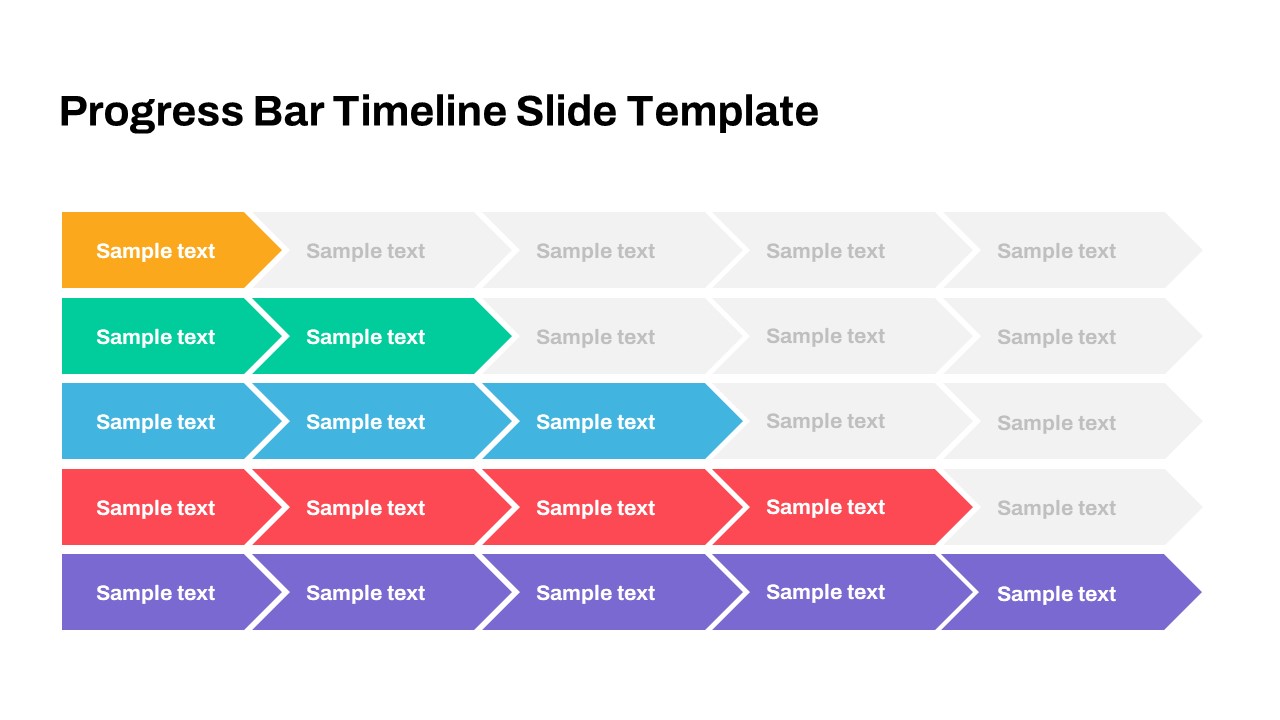
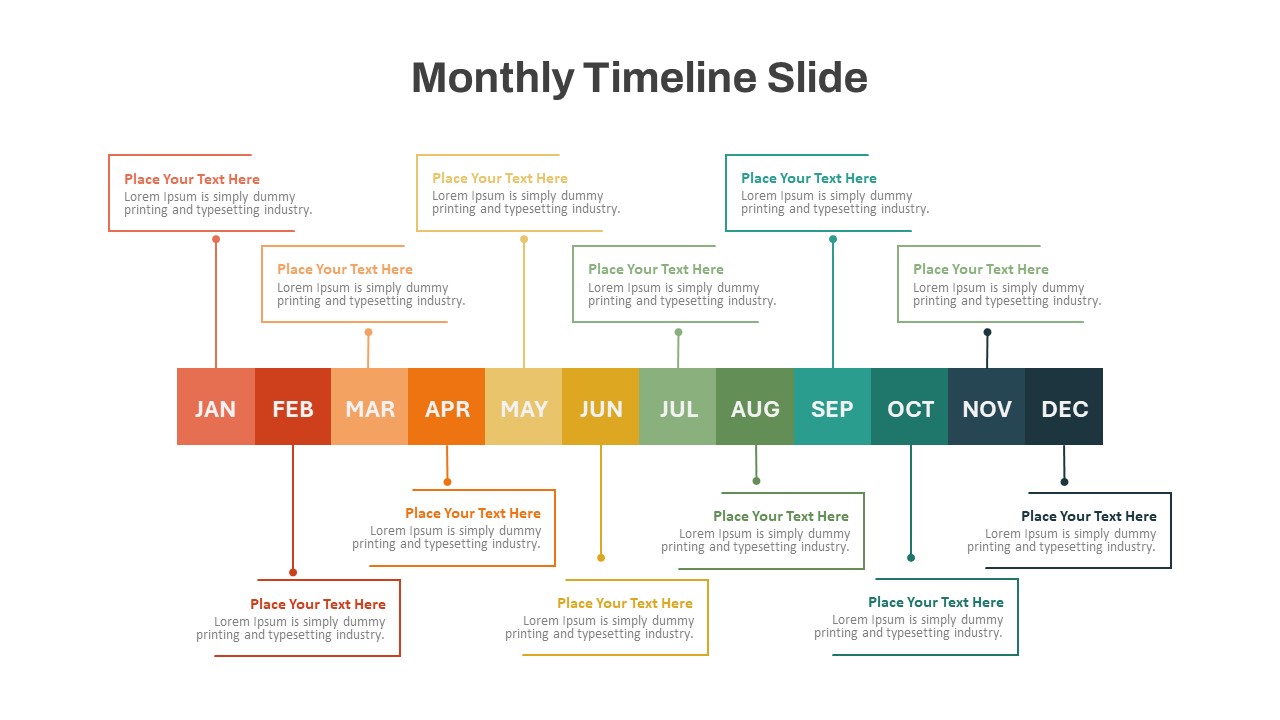
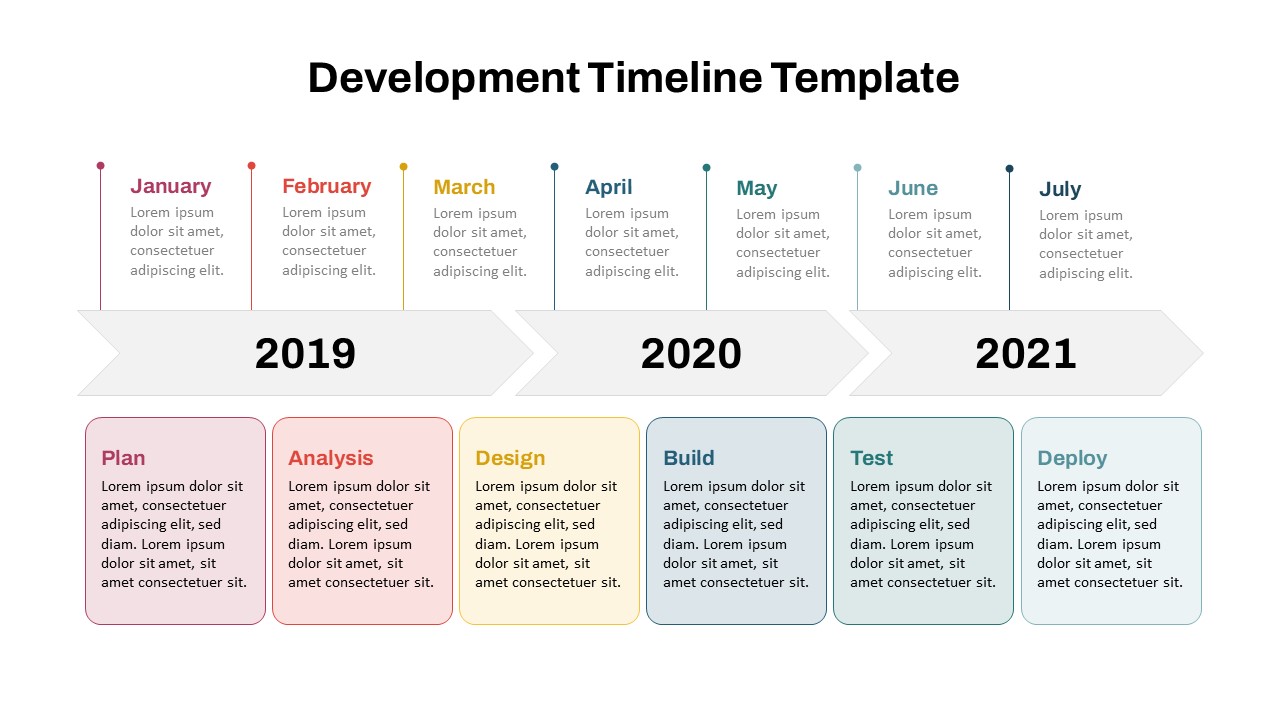
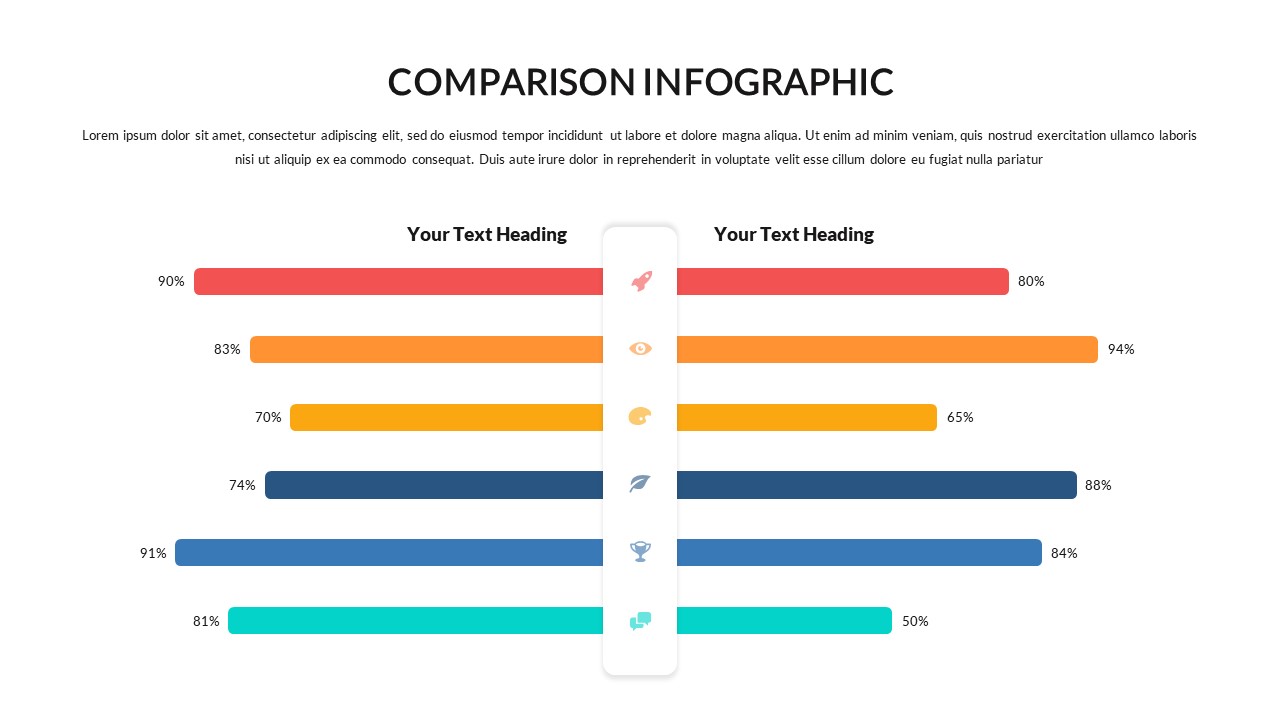
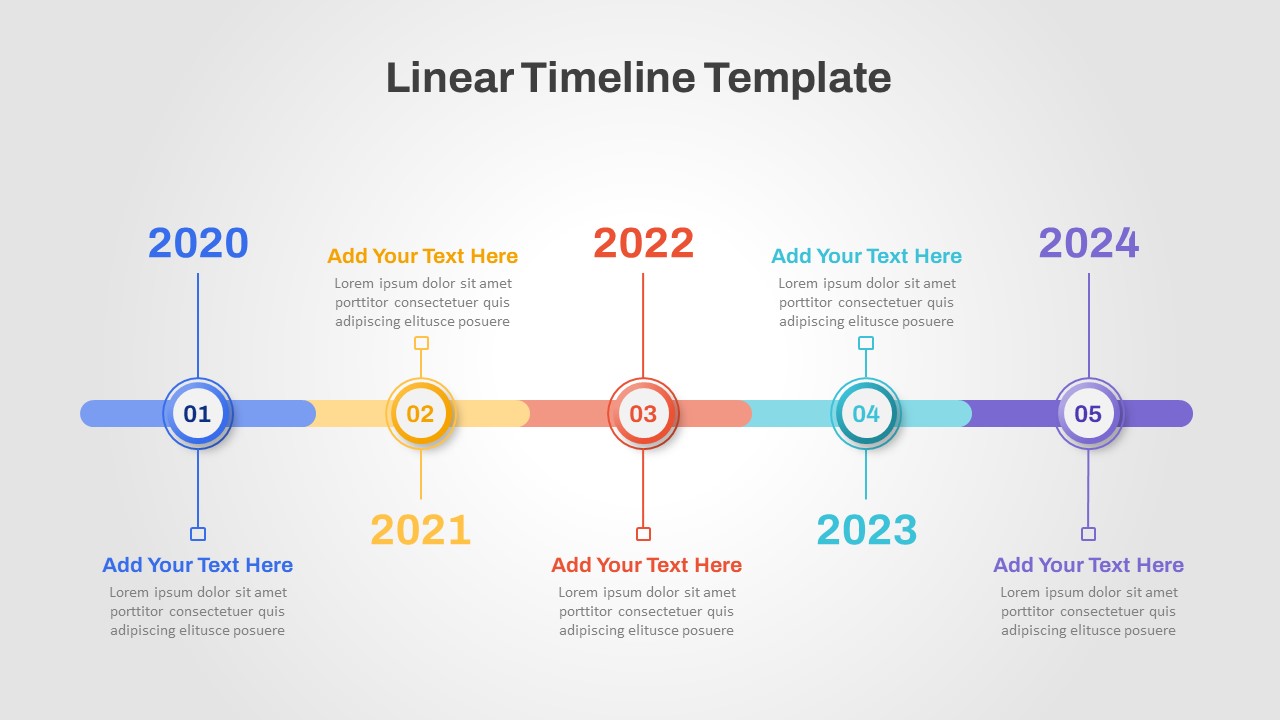
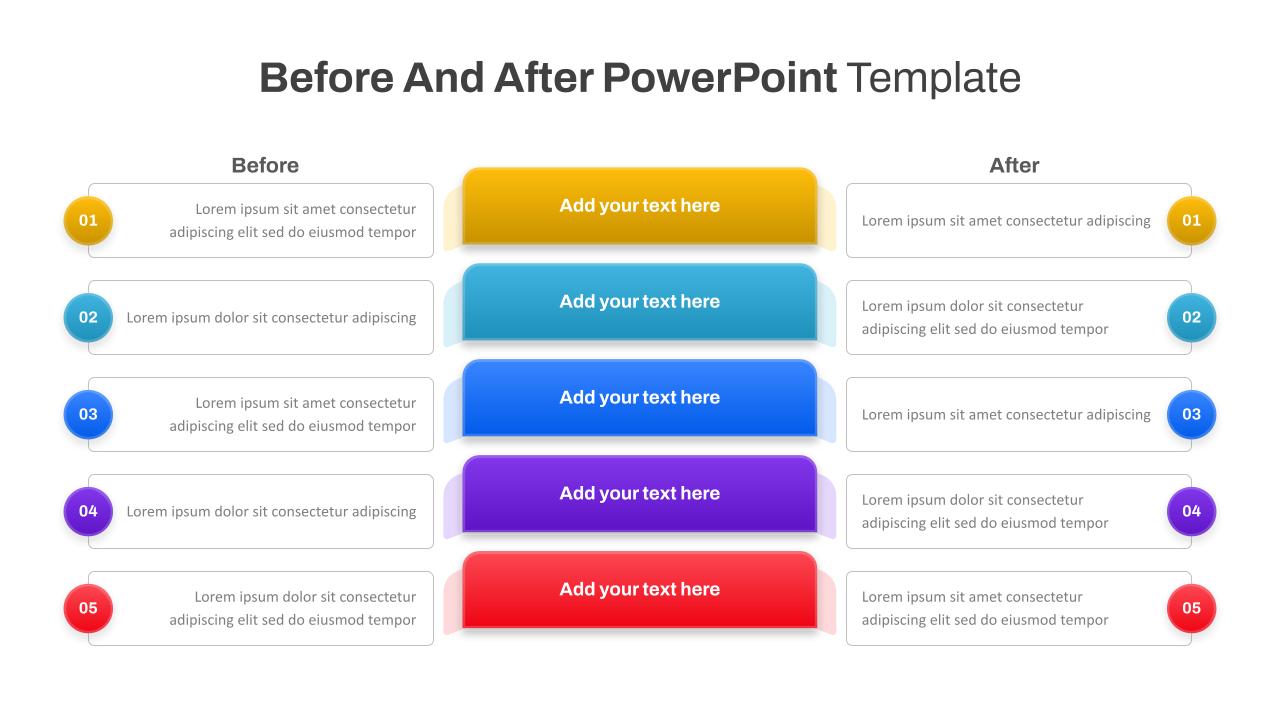
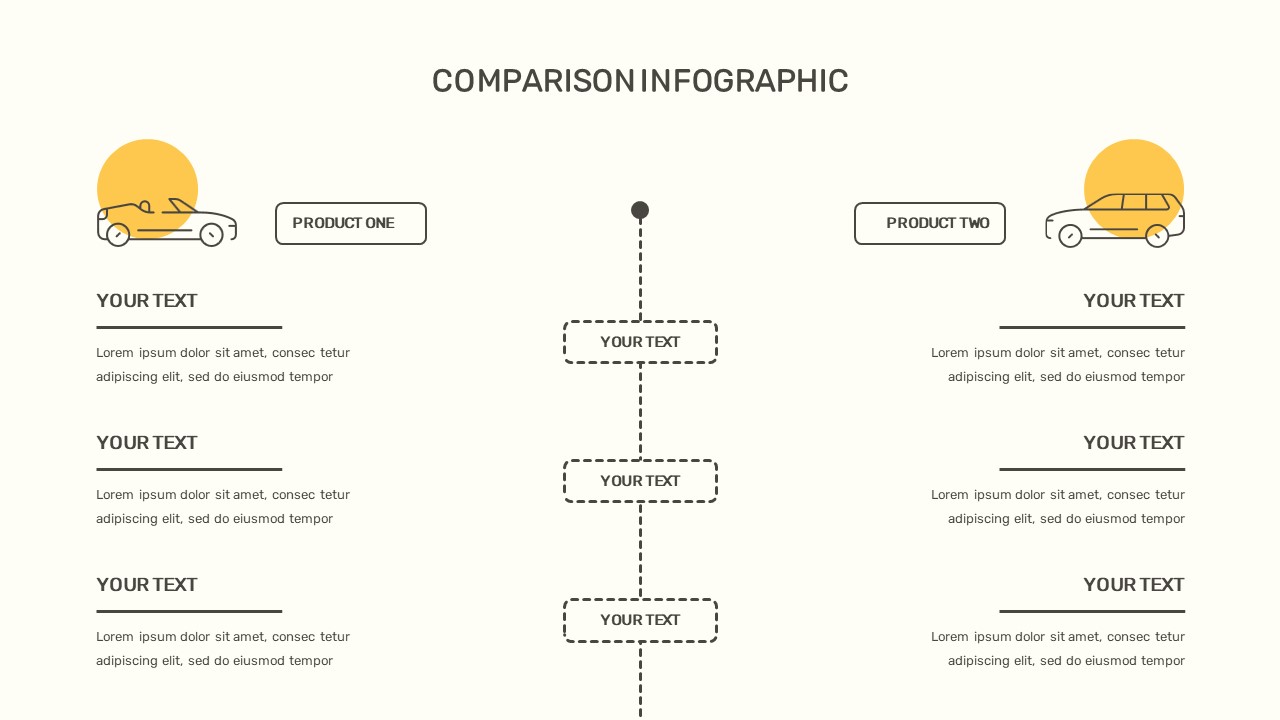
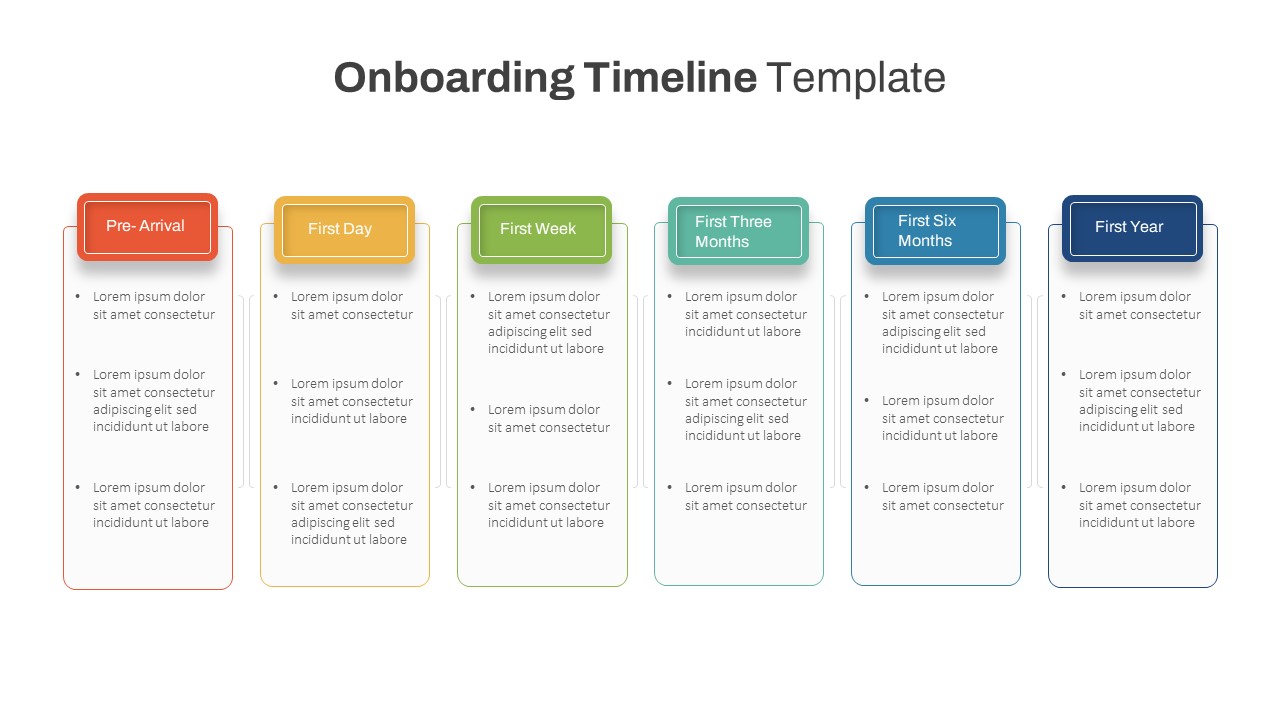
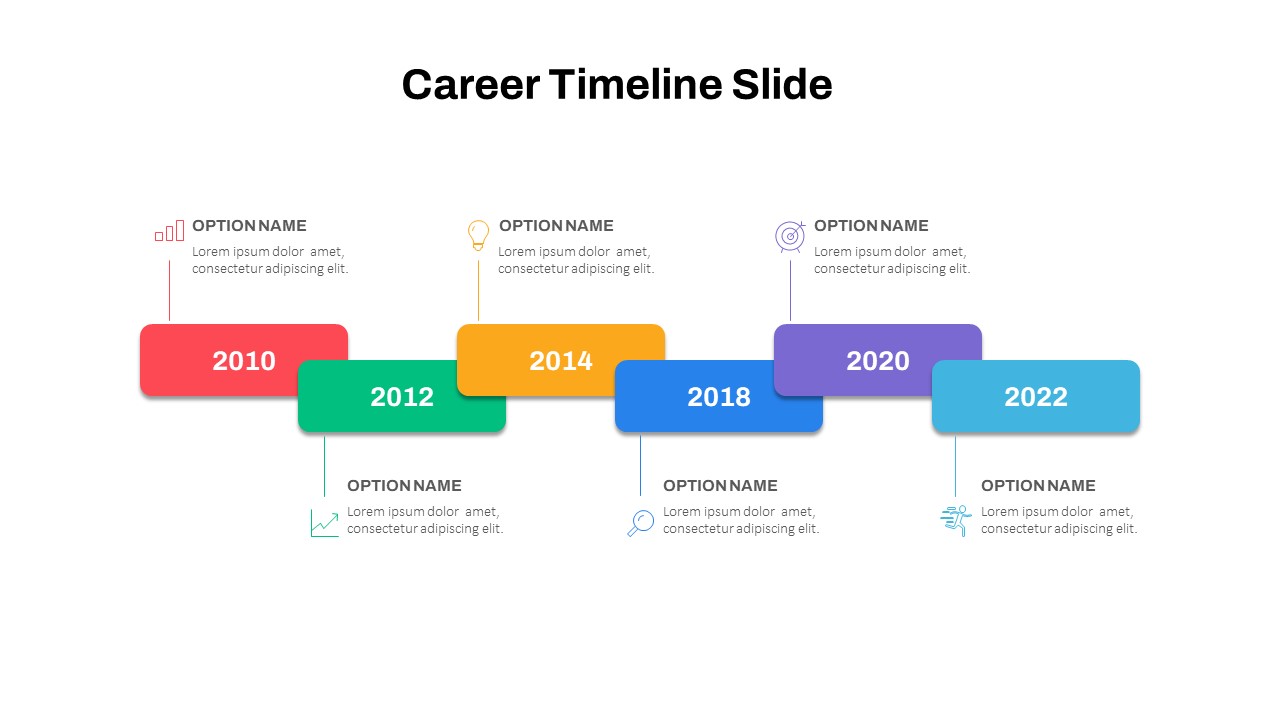
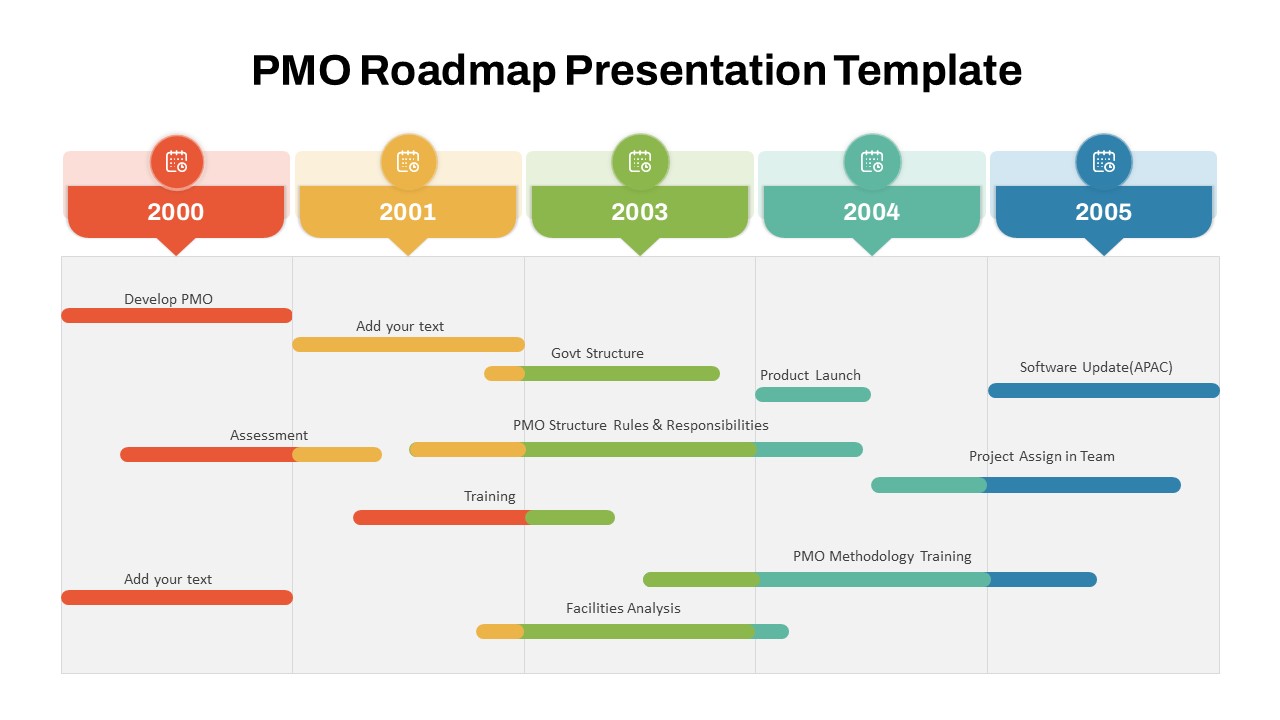
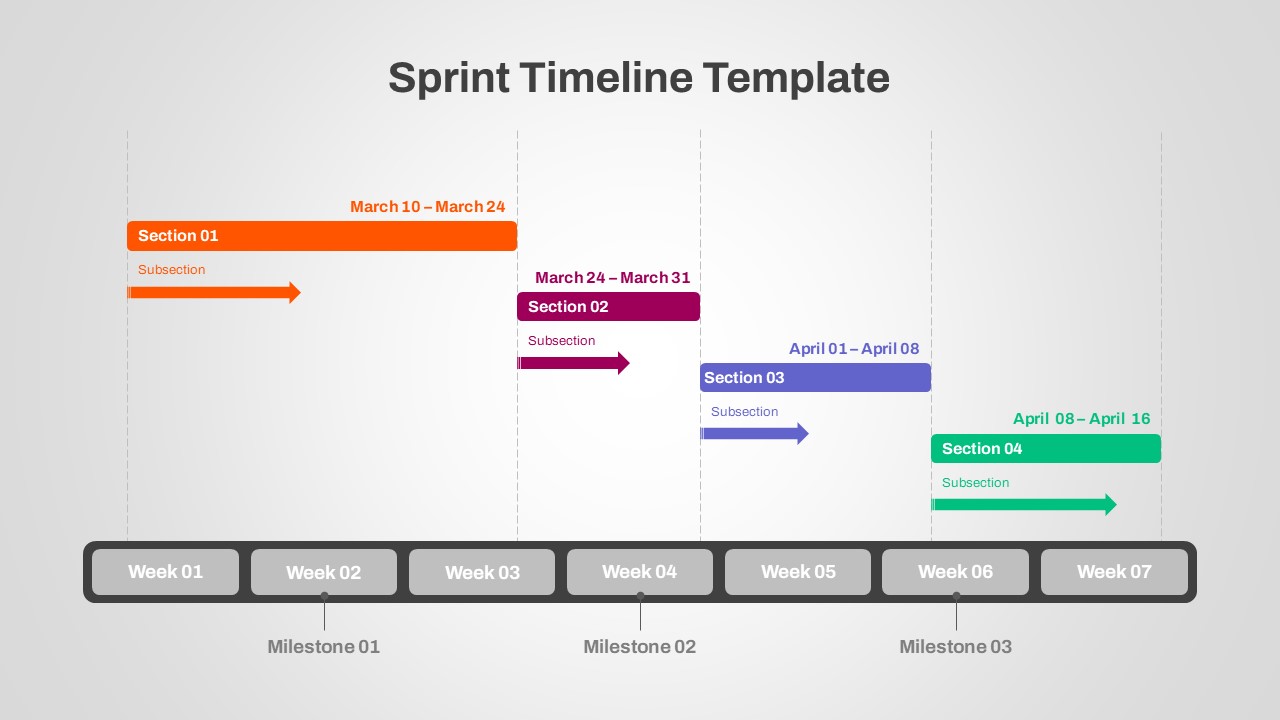
The Timeline Comparison Chart Template is an effective tool designed to help you visually compare progress, performance, or milestones between two entities over a multi-year timeline. This PowerPoint timeline comparison template is perfect for business professionals, analysts, and project managers who need to track and present comparative data over several years. The comparison PowerPoint slide chart displays parallel progress bars for each year, allowing you to clearly see the performance of Business 01 versus Business 02 from 2021 to 2027.
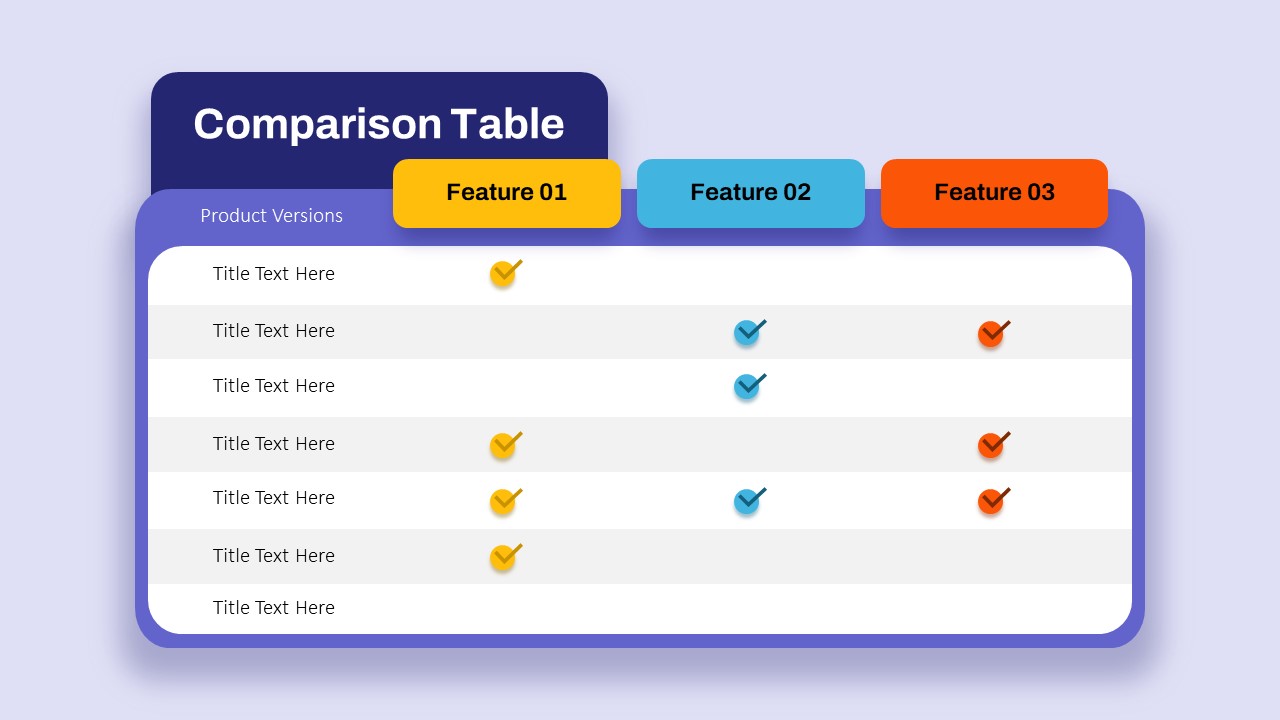
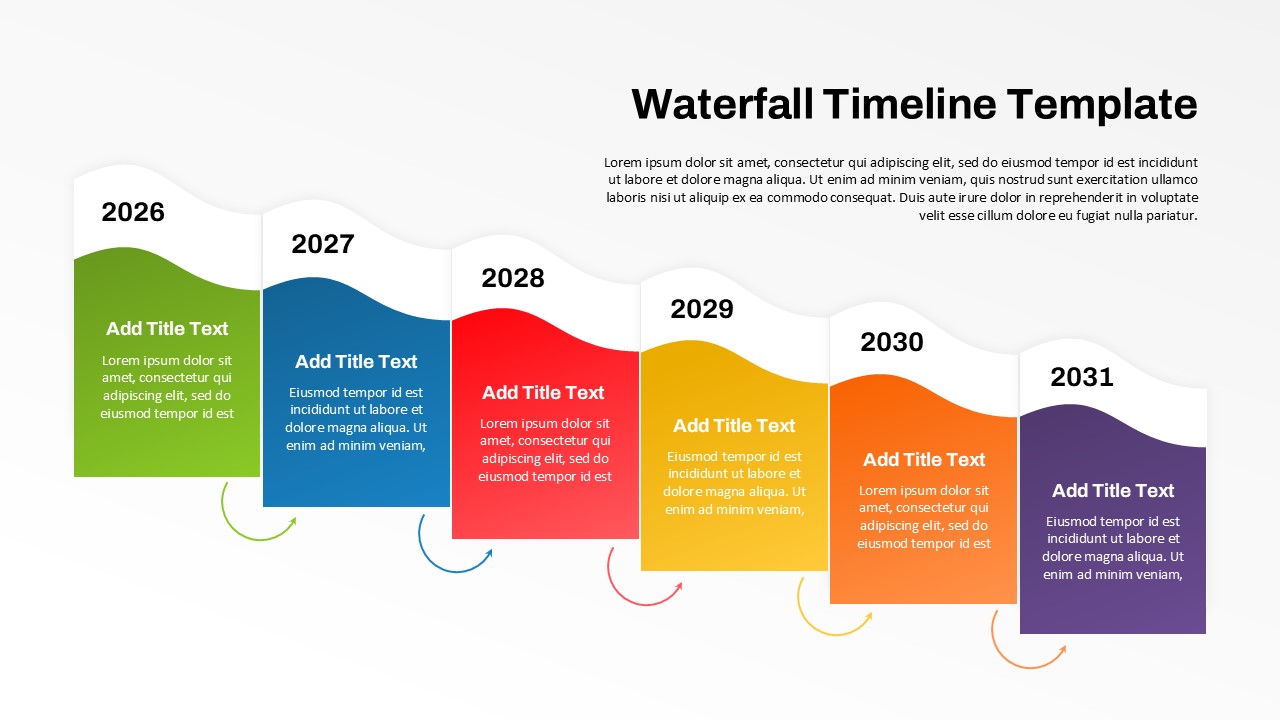
Each year is represented by a horizontal bar, with percentages indicating the progress or achievement levels of each business. The gradient color scheme enhances readability, making it easy to distinguish between the two entities being compared. This visual format is ideal for presenting data in a way that is both informative and engaging, ensuring that your audience can quickly grasp the differences and trends over time.
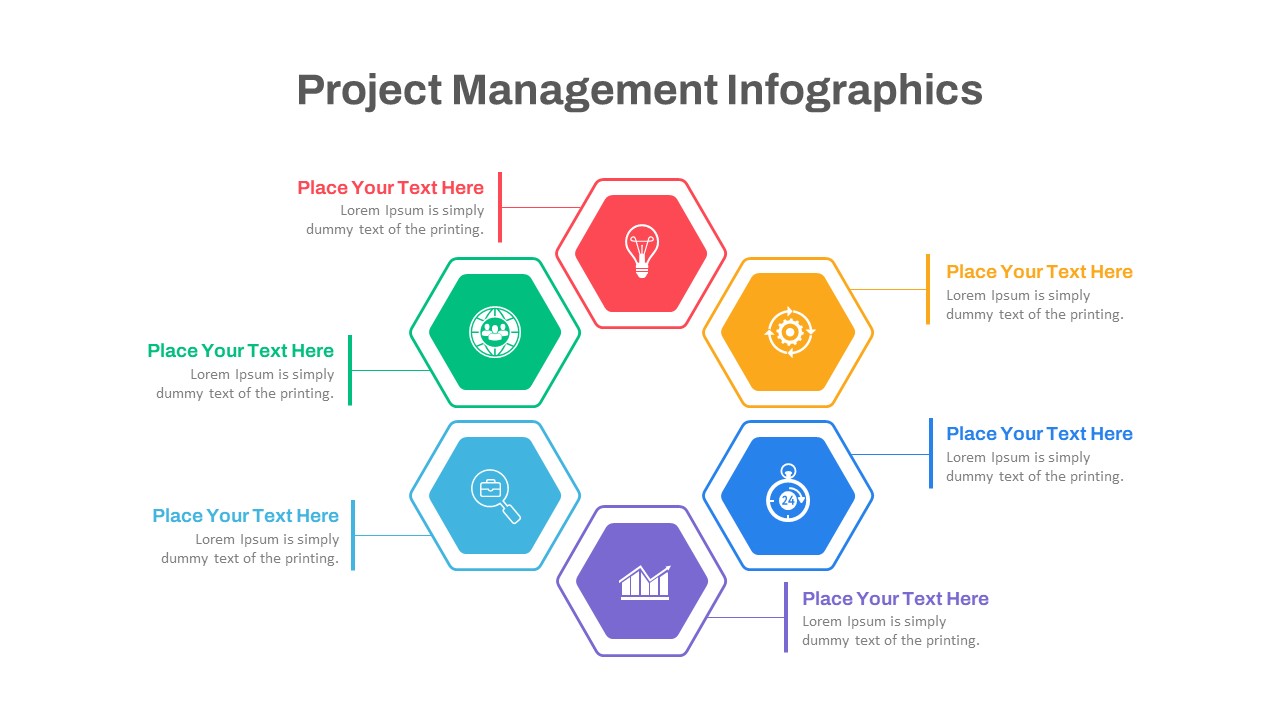
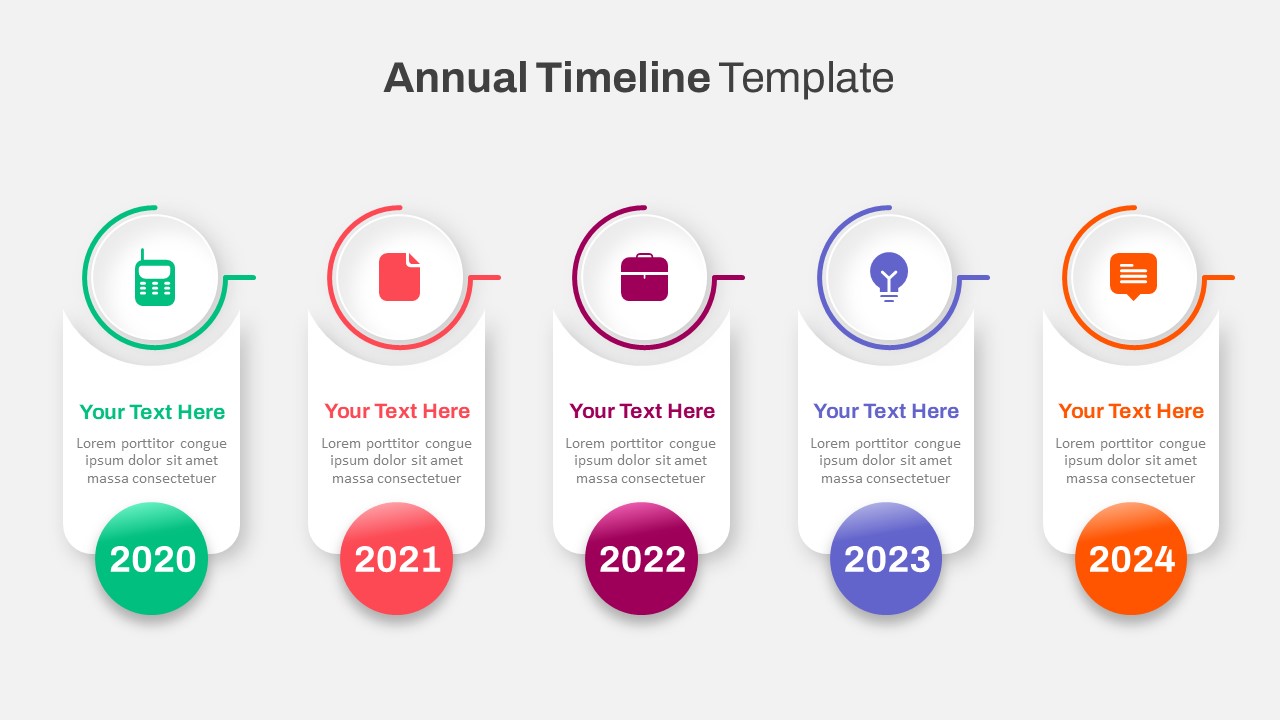
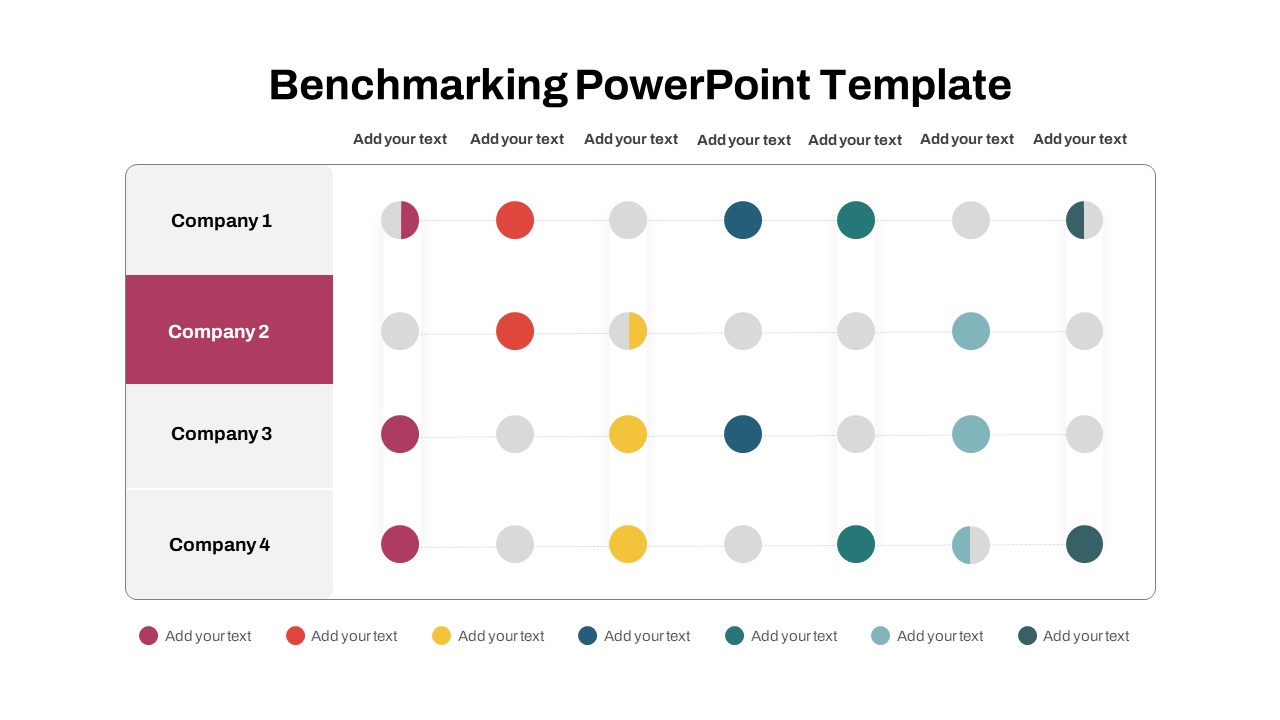
The Timeline Comparison Chart Template is highly versatile, suitable for a wide range of applications including financial performance reviews, project timeline comparisons, growth tracking, and competitive analysis. Its clean and modern design ensures that the focus remains on the data, making your presentations both professional and impactful.
See more

Aspect Ratio
16:9Item ID
SKT01054
Features of this template
Other User Cases of the Template:
Financial performance analysis, project progress tracking, growth trend analysis, annual report comparisons, strategic planning sessions, business performance reviews, competitive benchmarking, product development timelines, market share analysis, KPI tracking presentations.FAQs
You May Also Like These Presentation Templates


- Free
- Free


- Free
- Free
- Free

- Free
- Free
- Free
- Free
- Free
- Free