PPT SWOT Bar Chart Template for Scenario Comparison Presentation

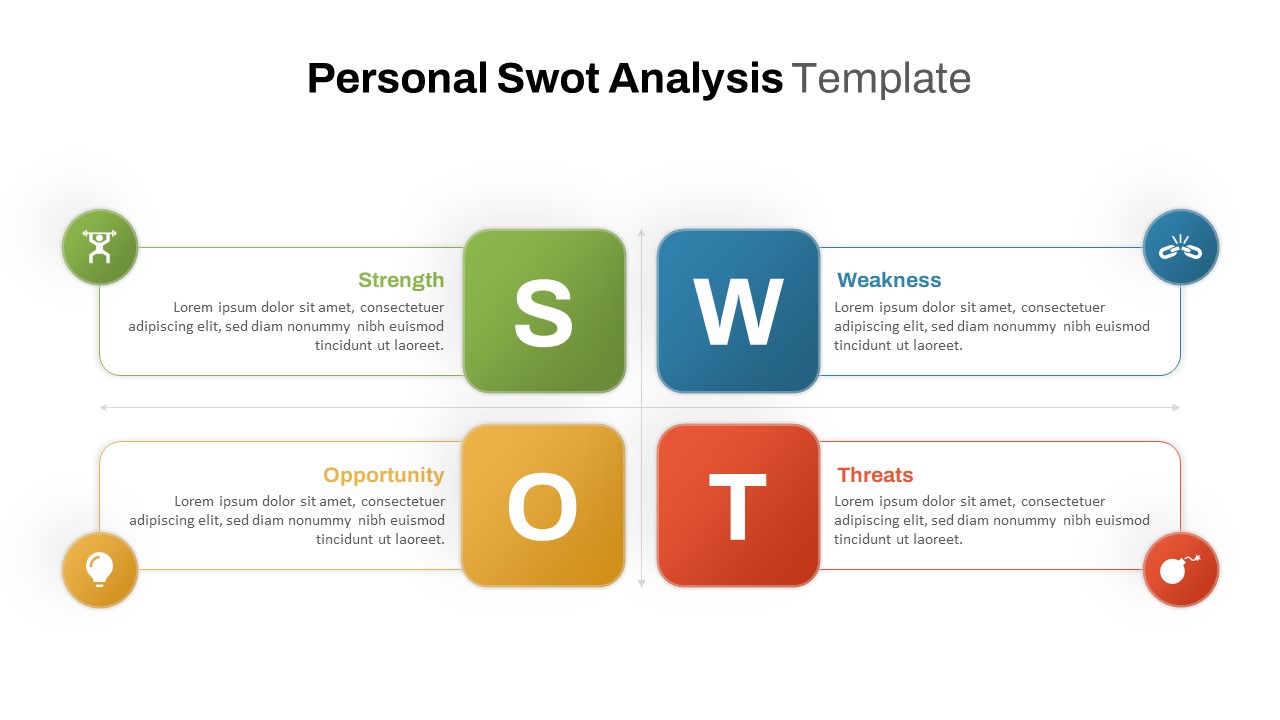
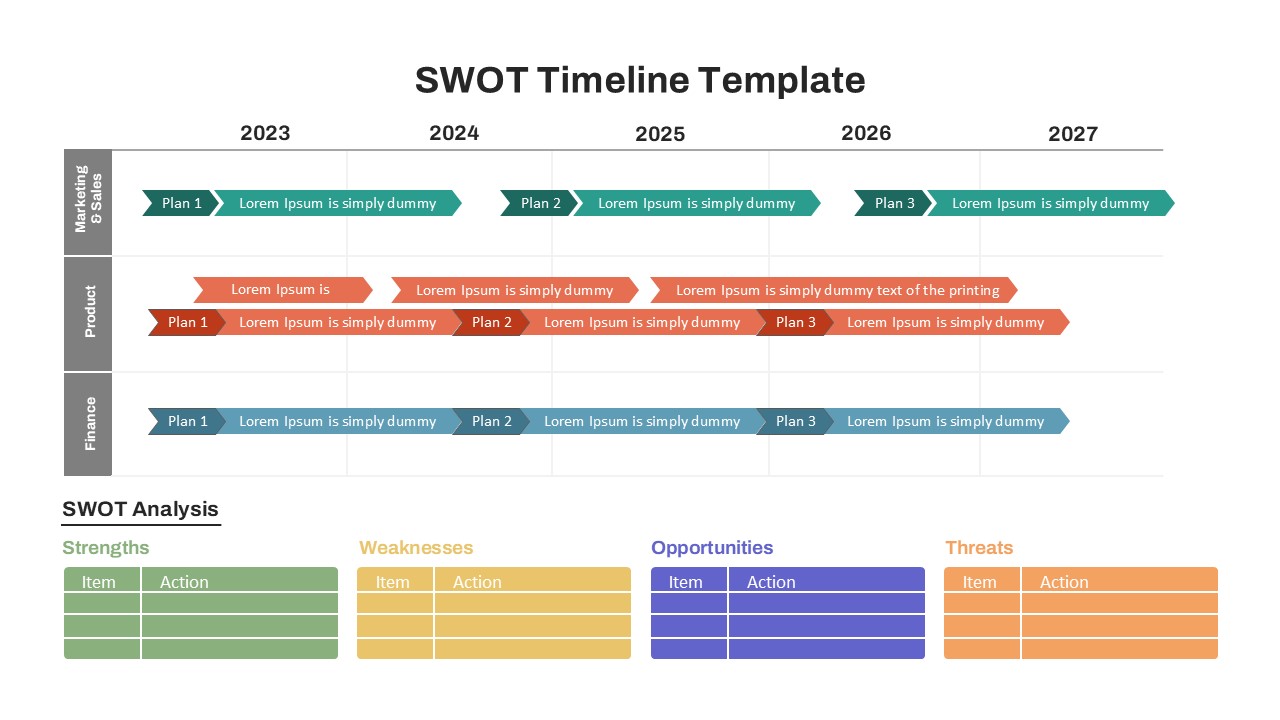
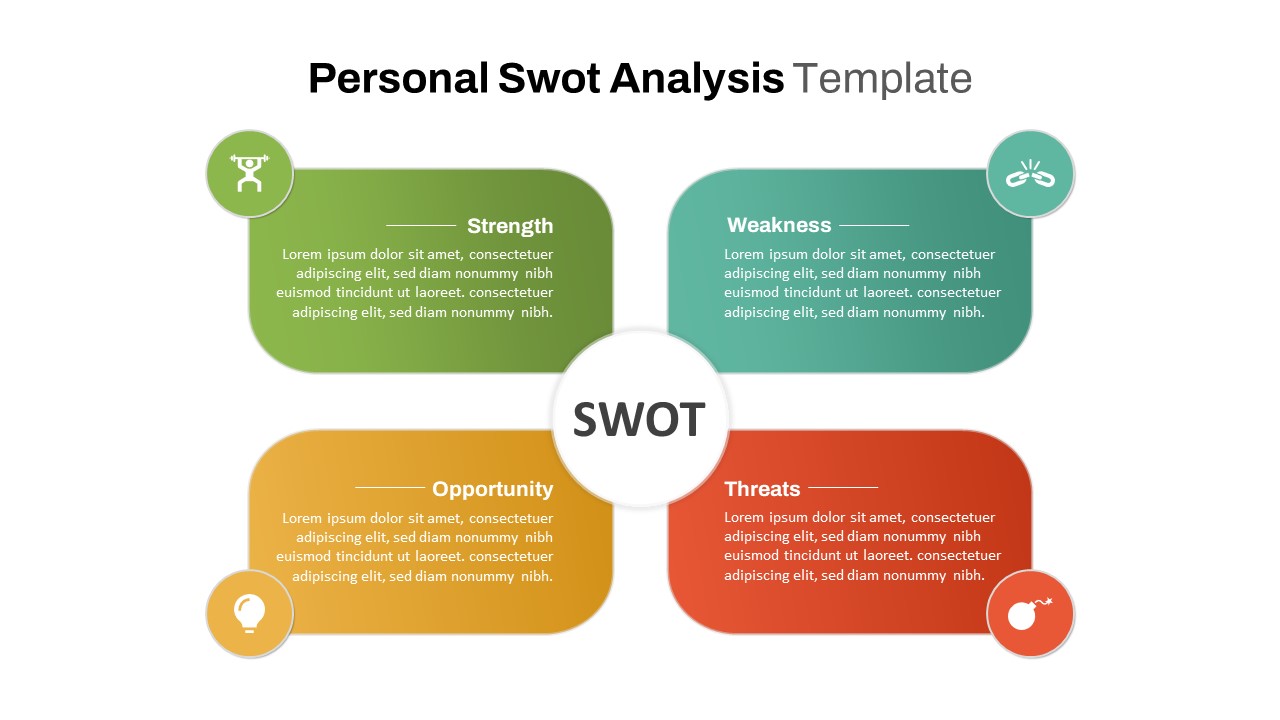
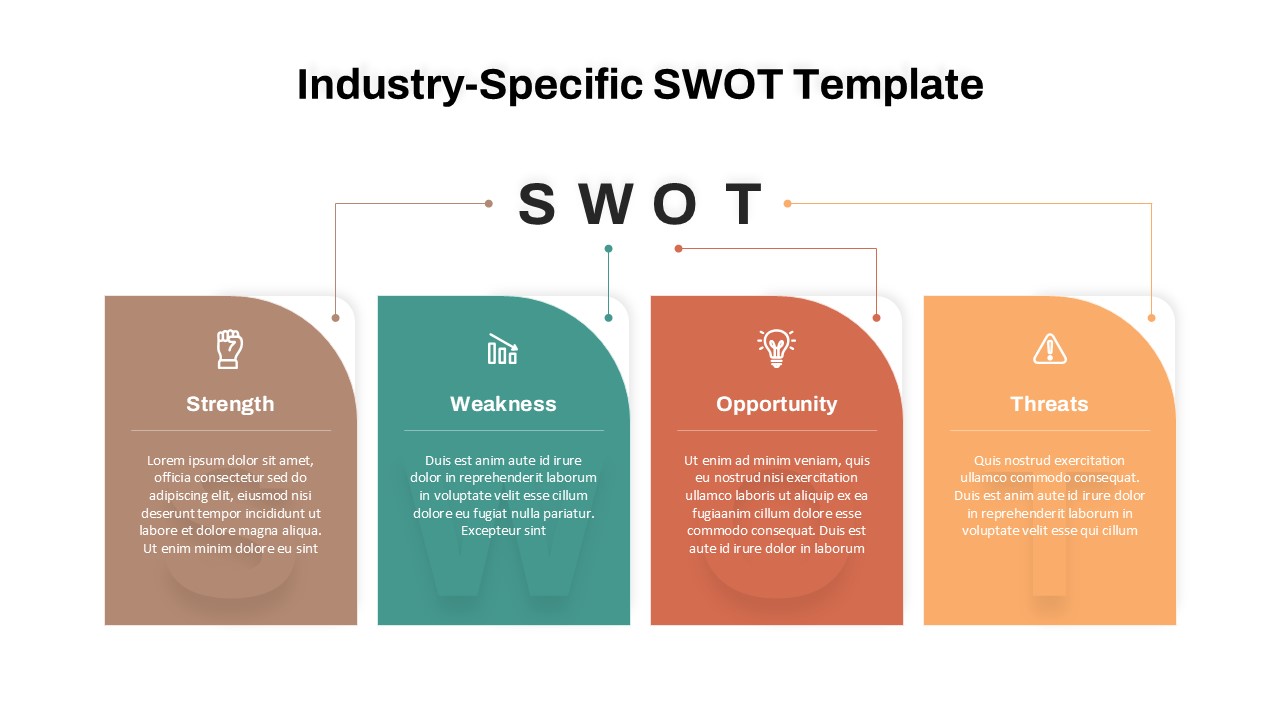
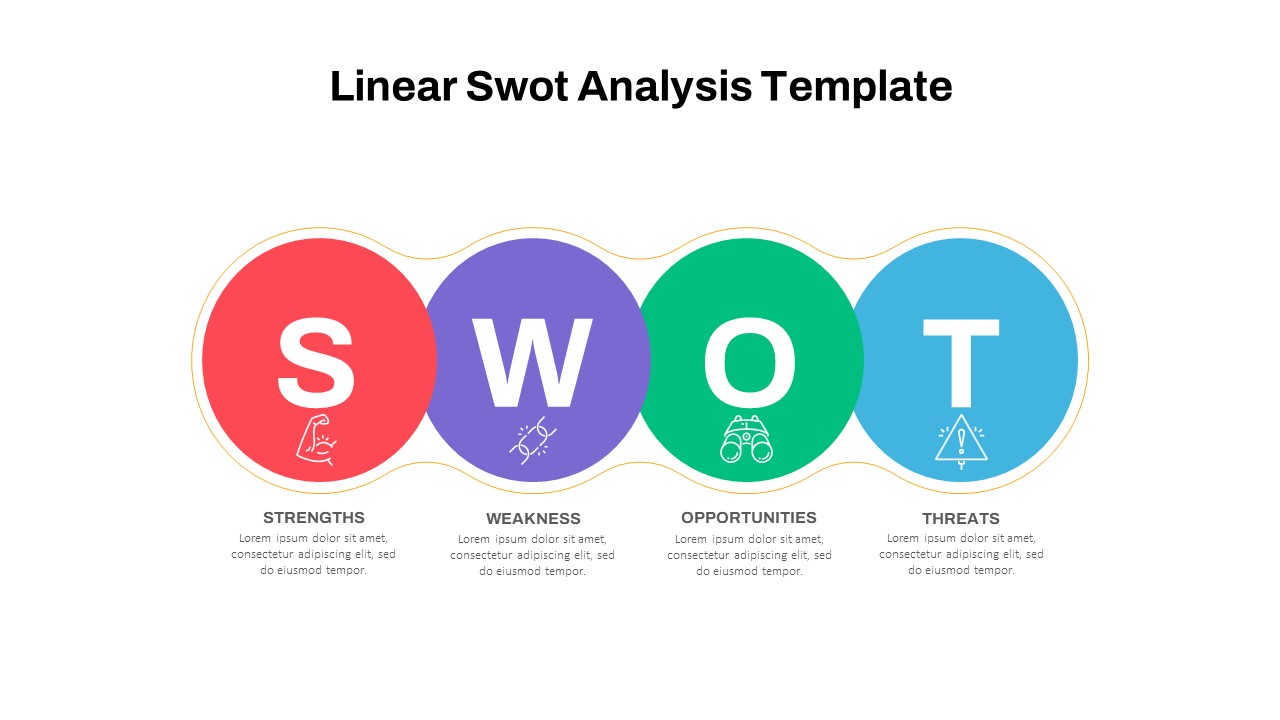
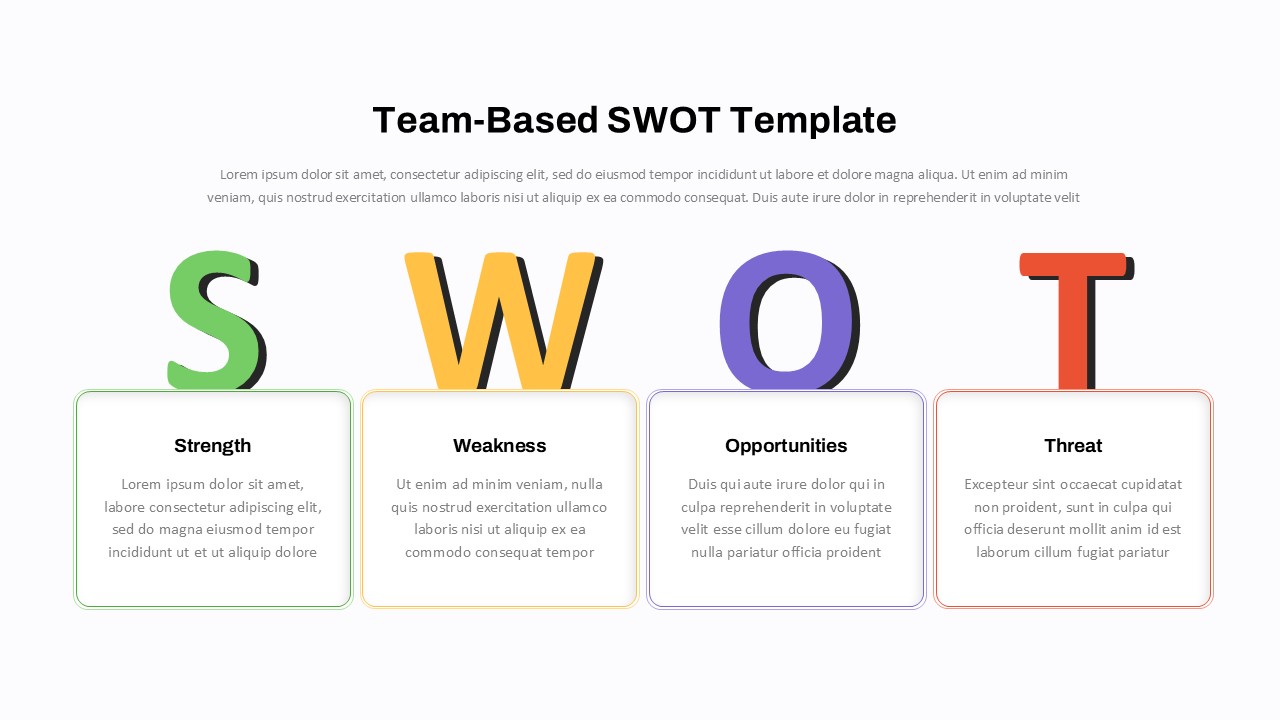
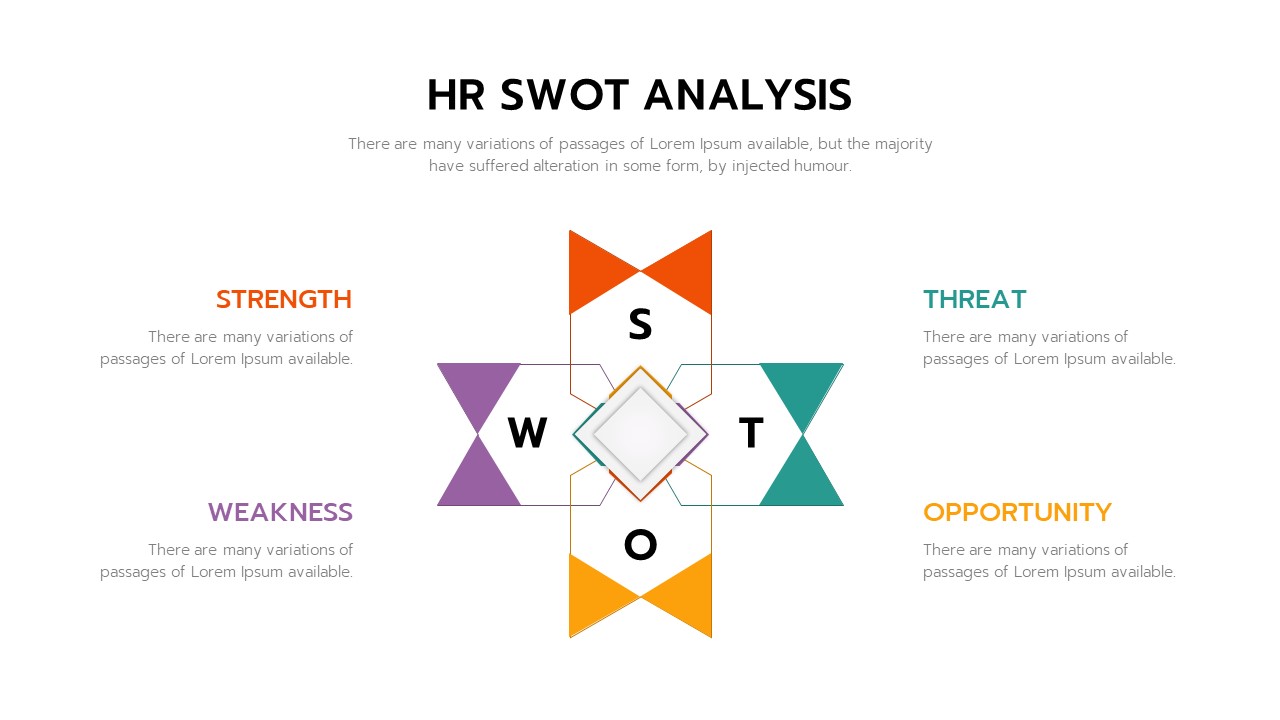
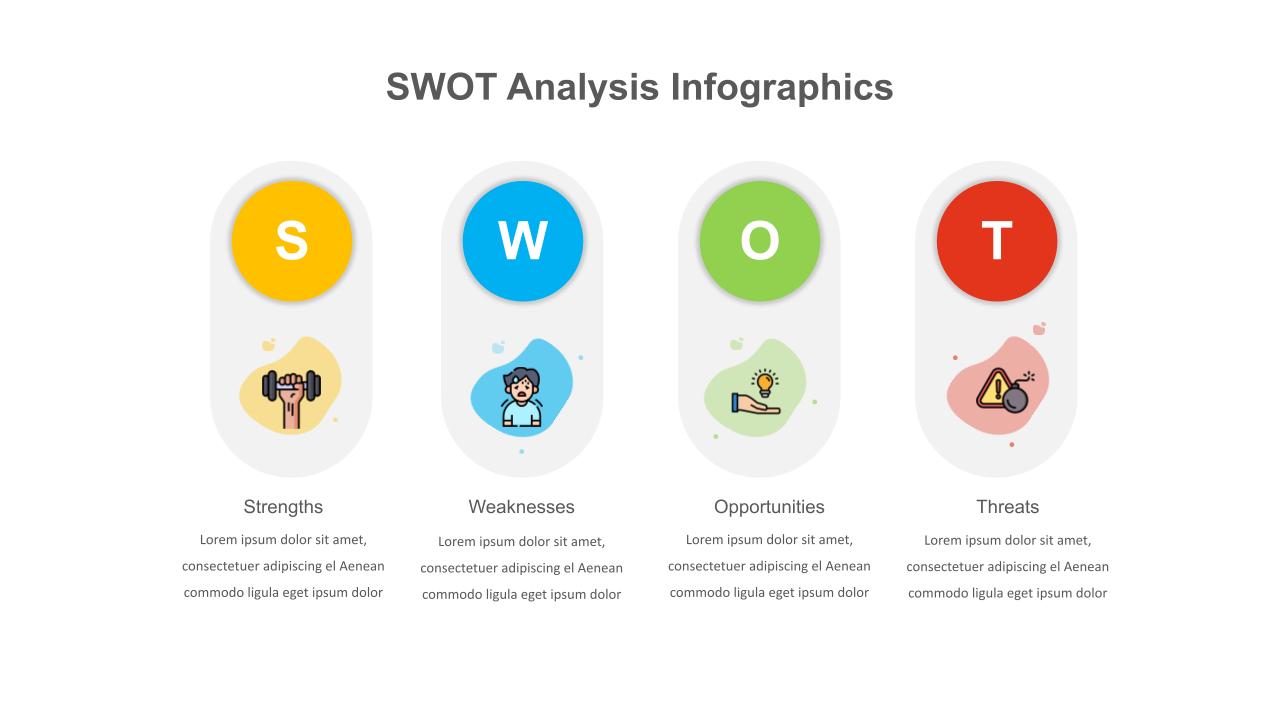
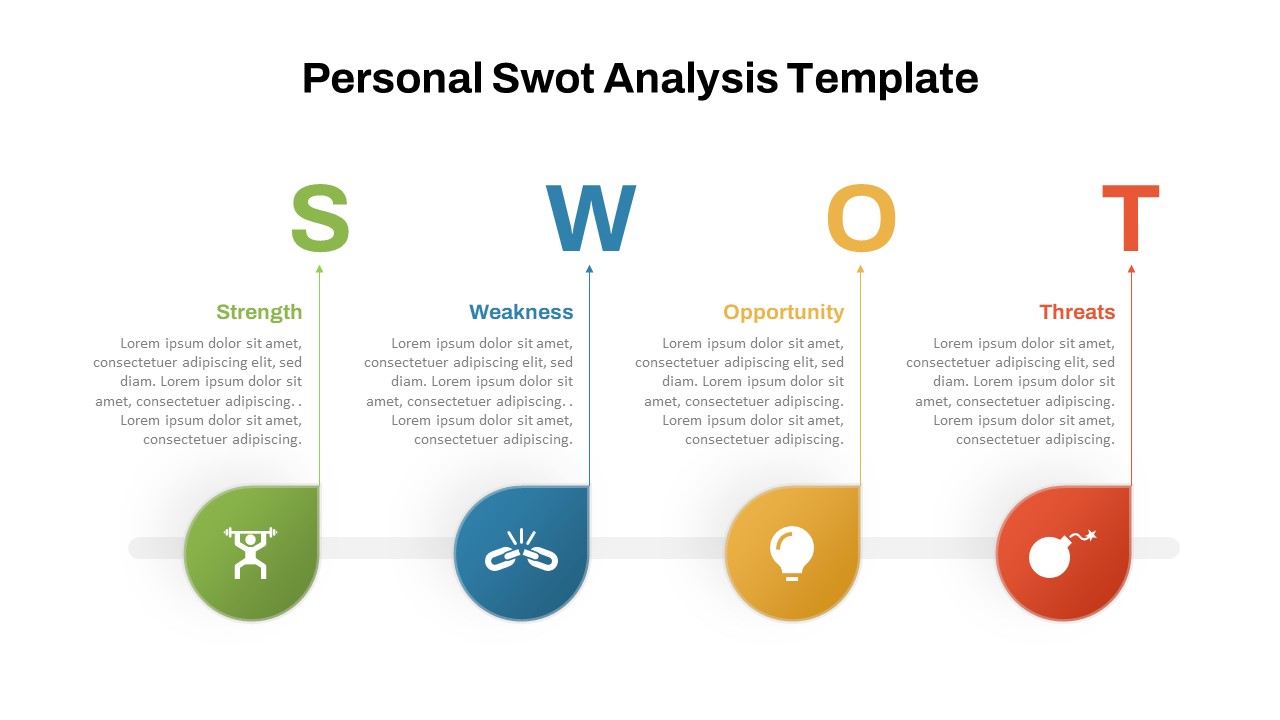
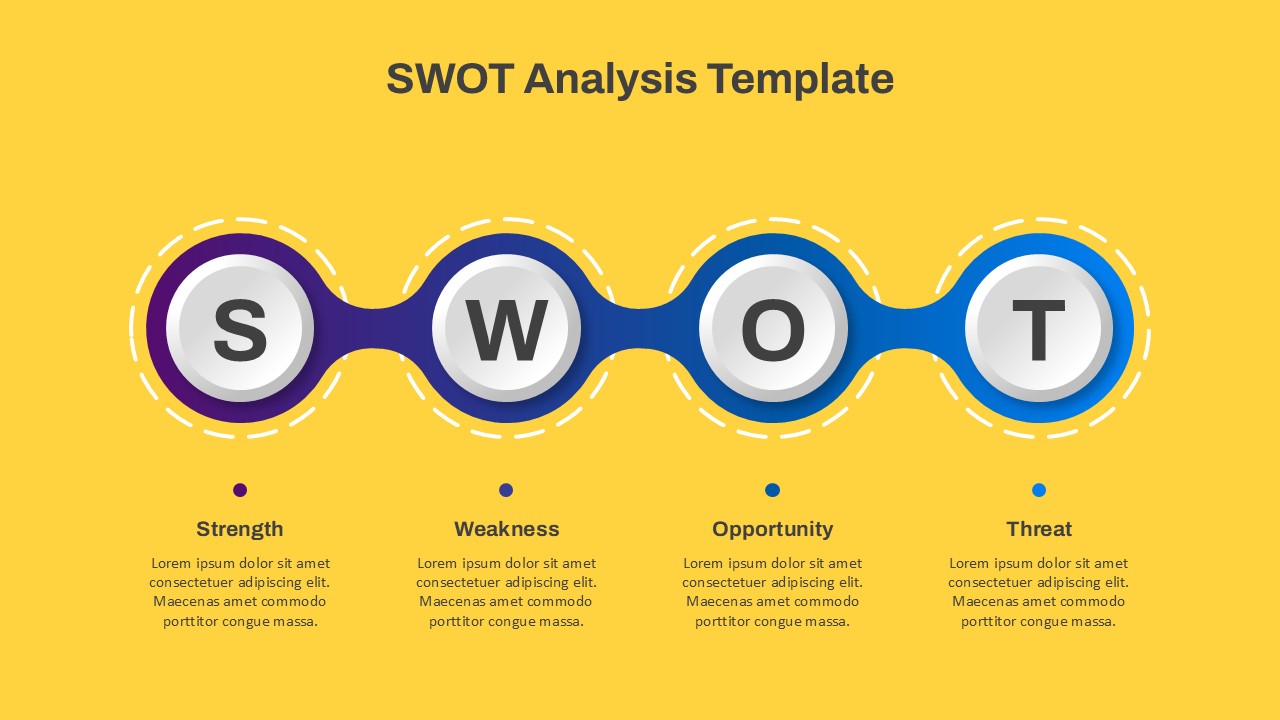
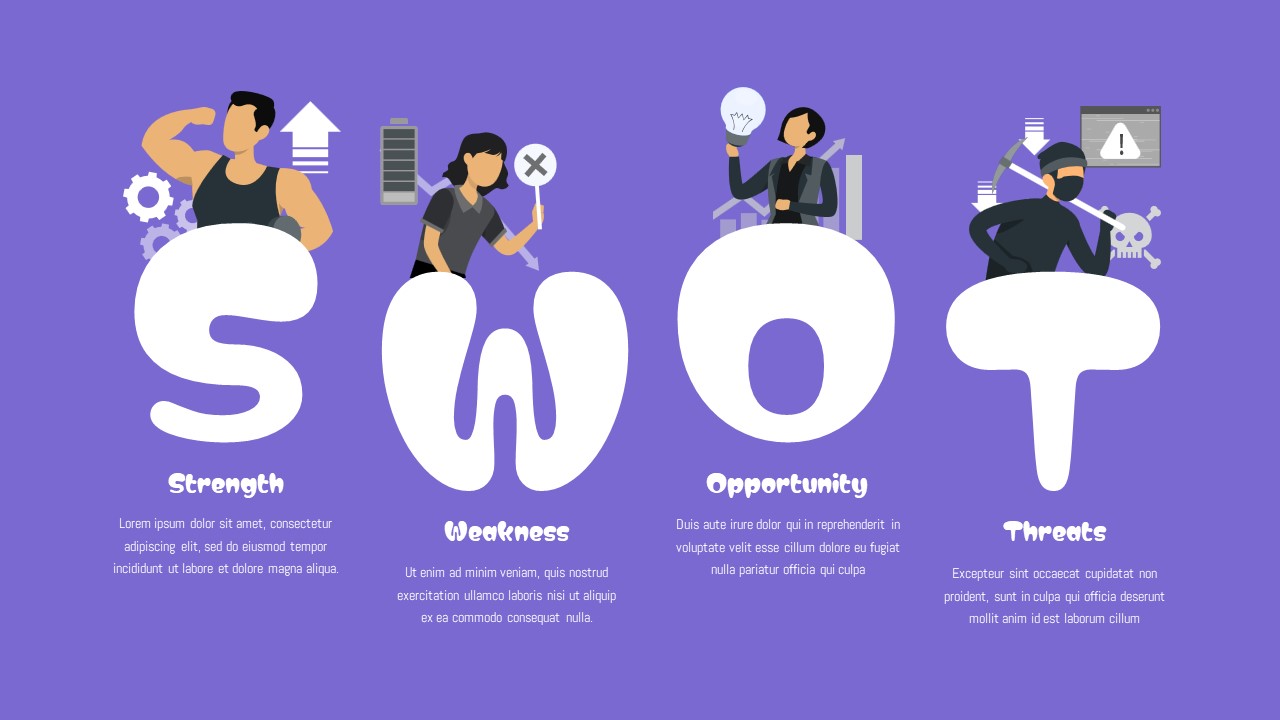
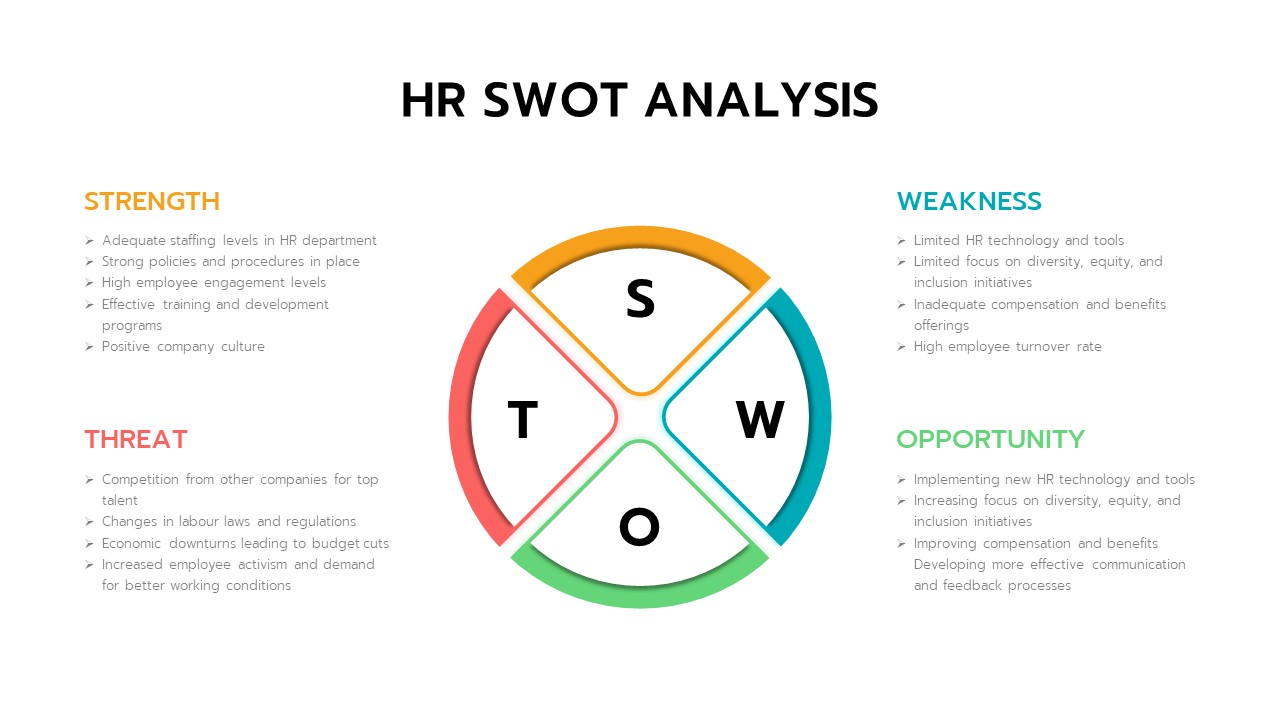
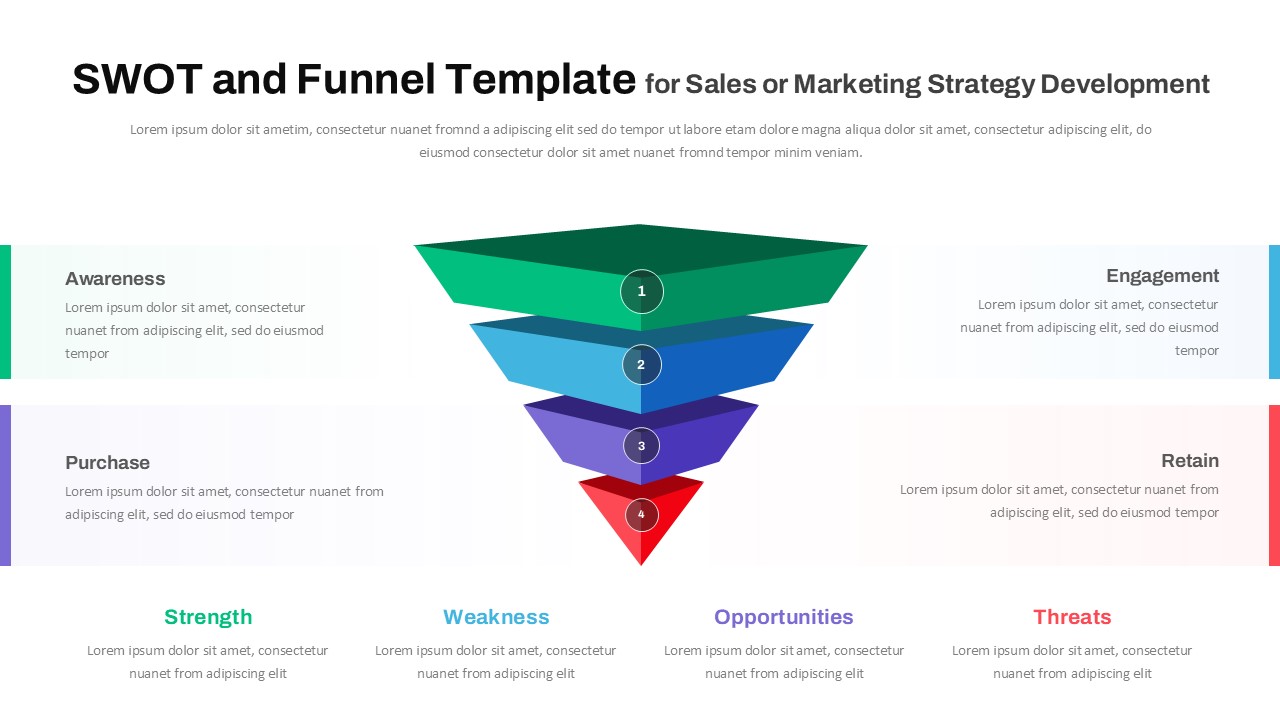
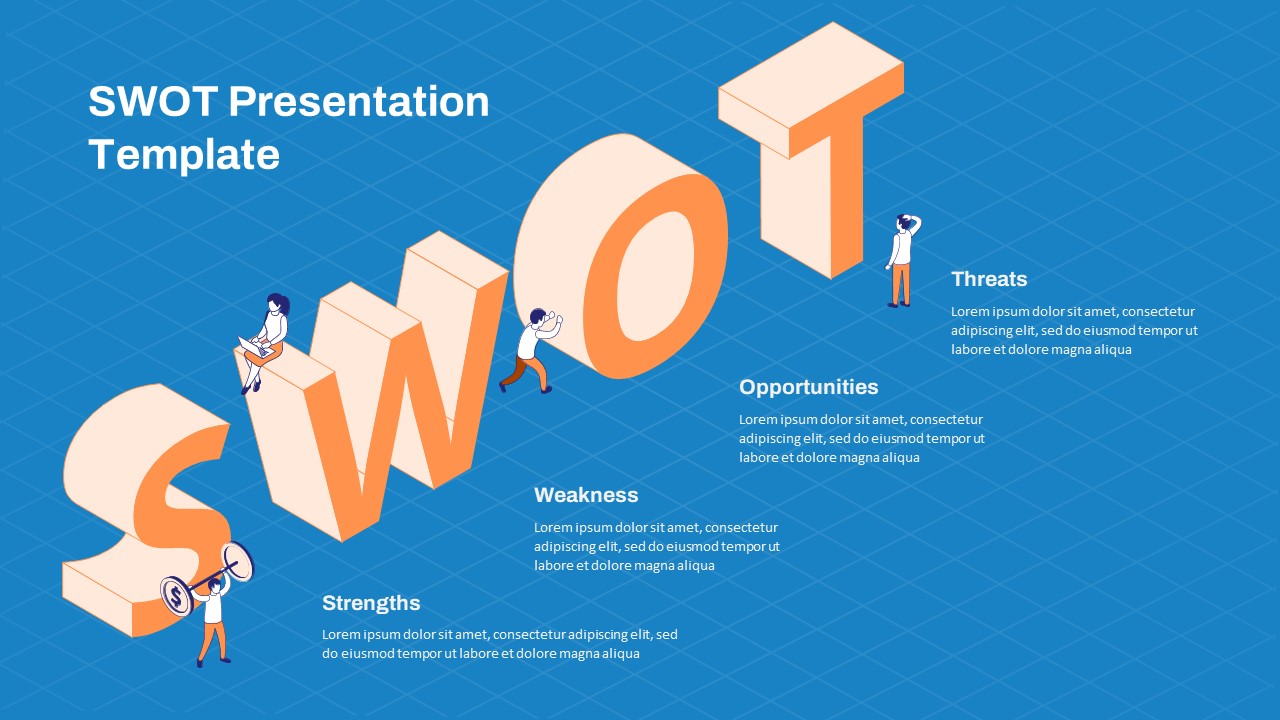
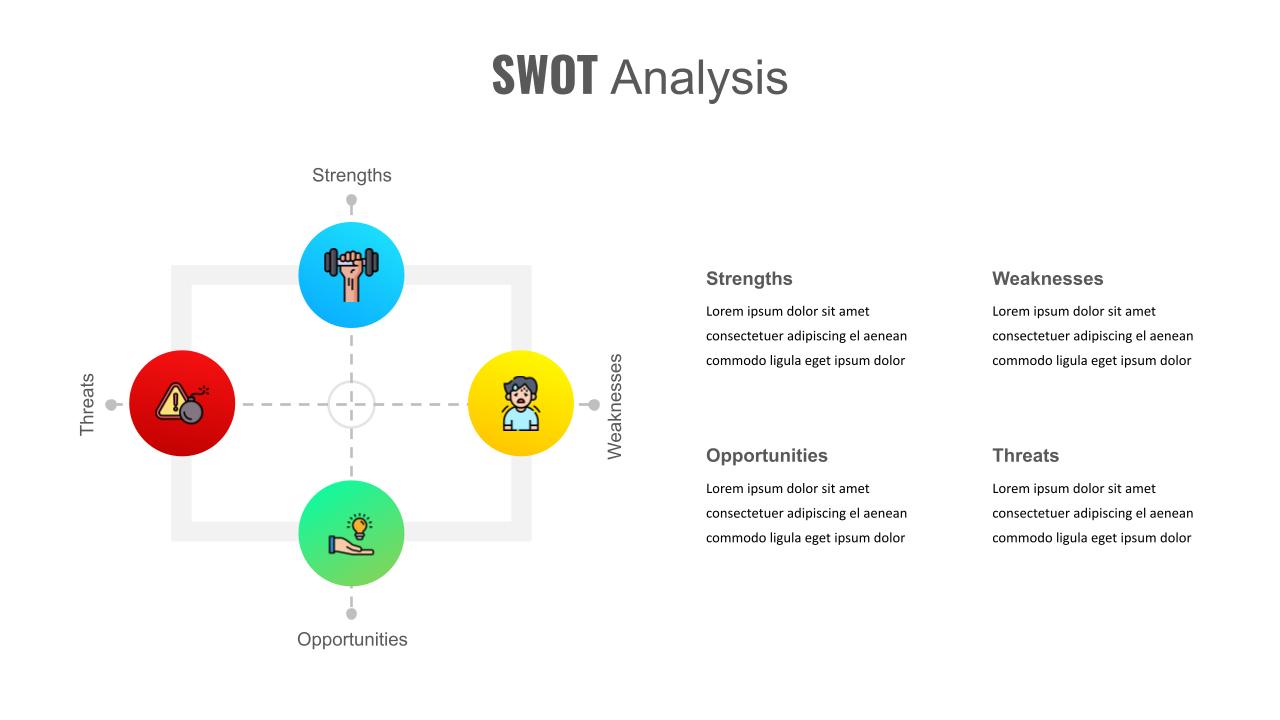
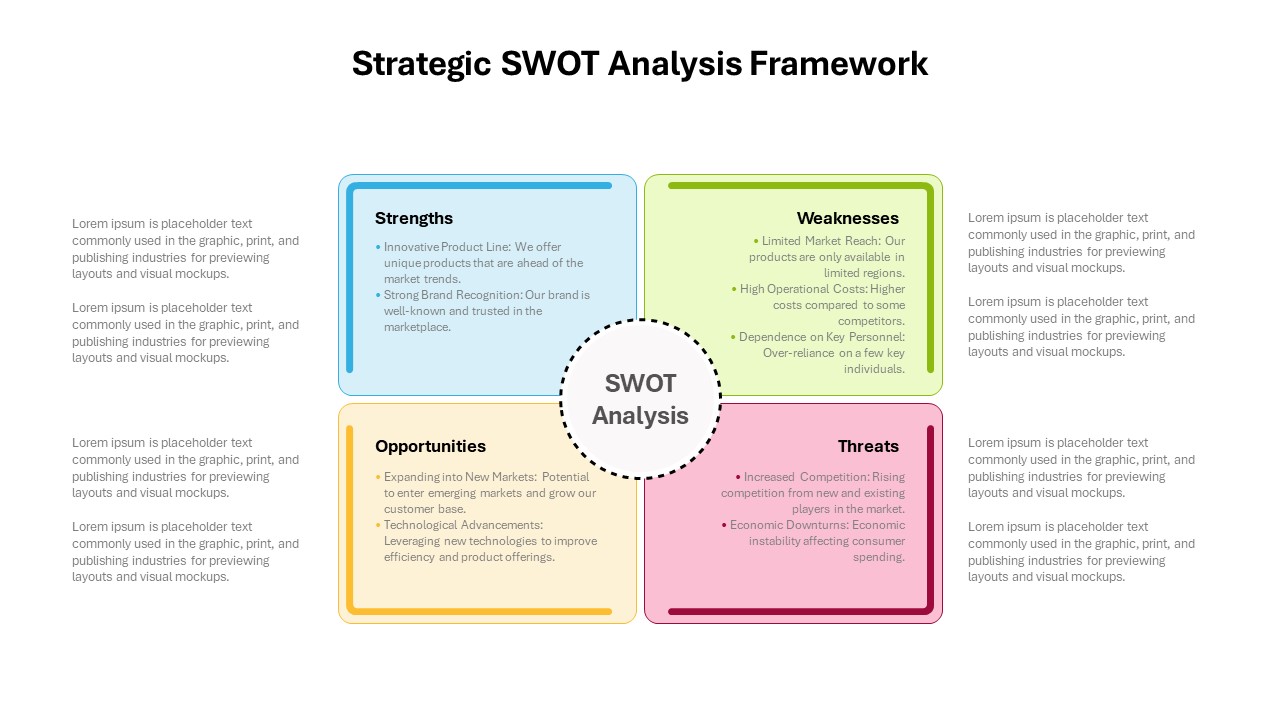
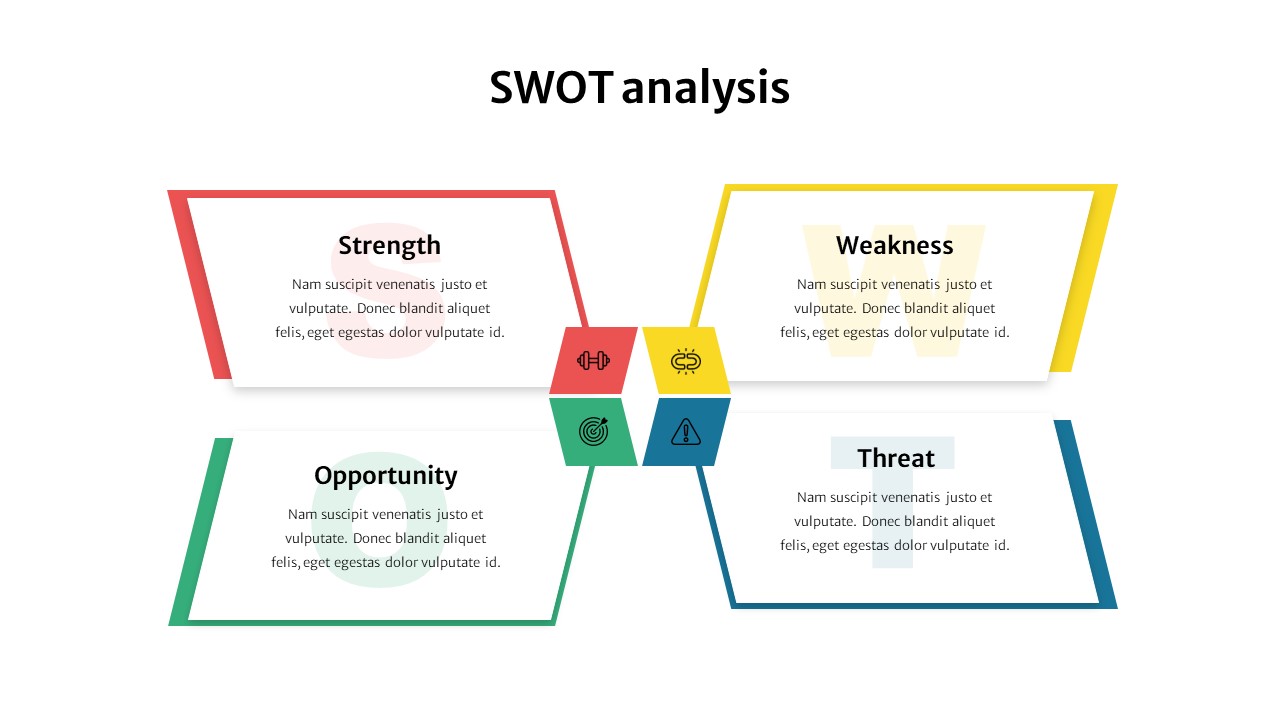
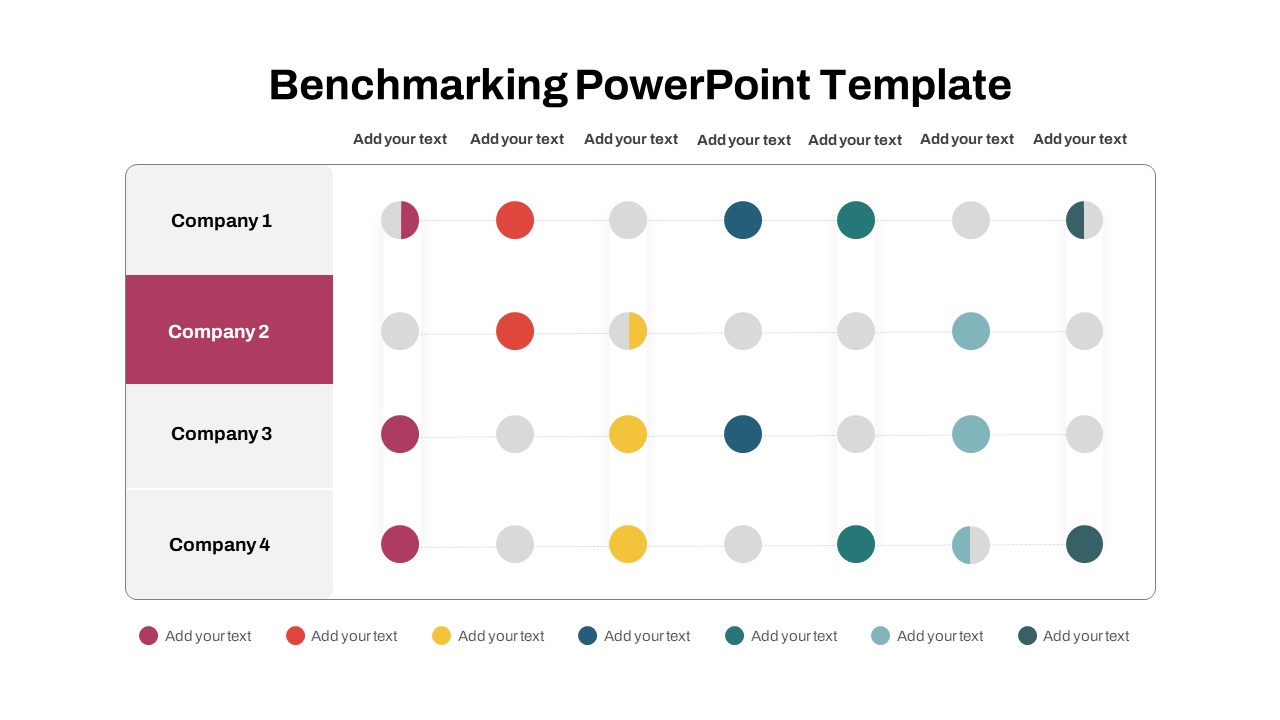
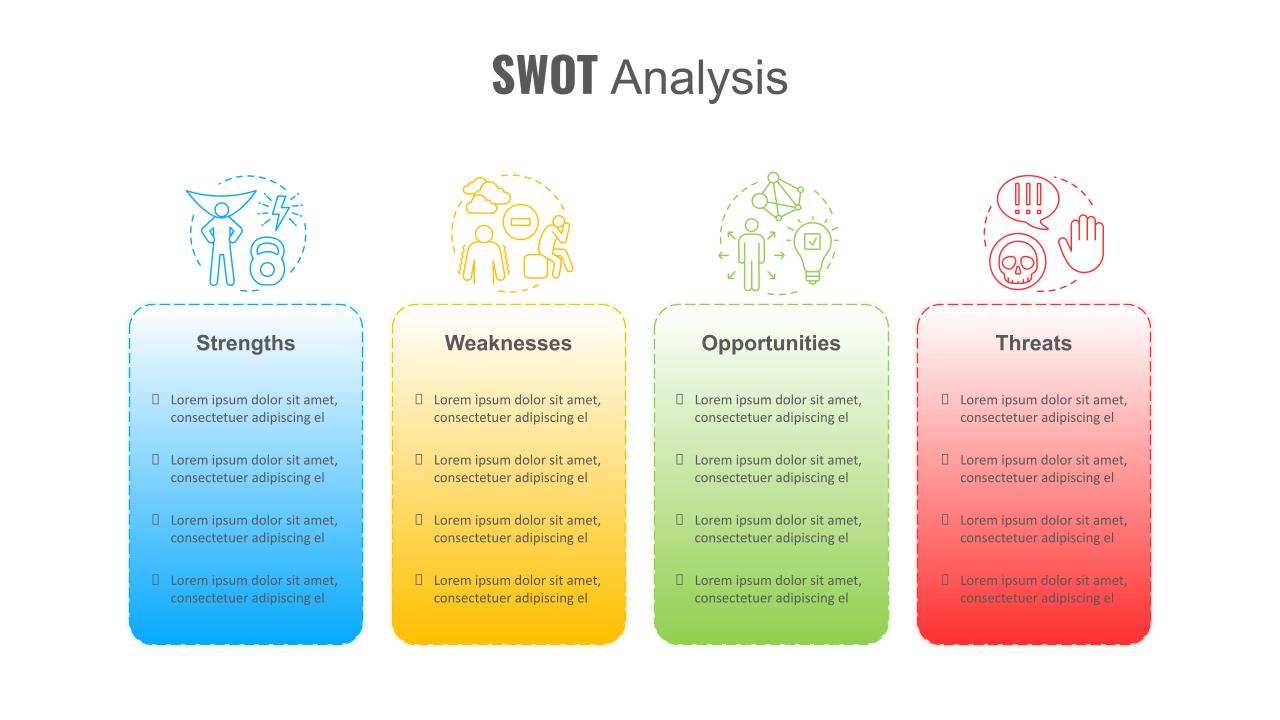
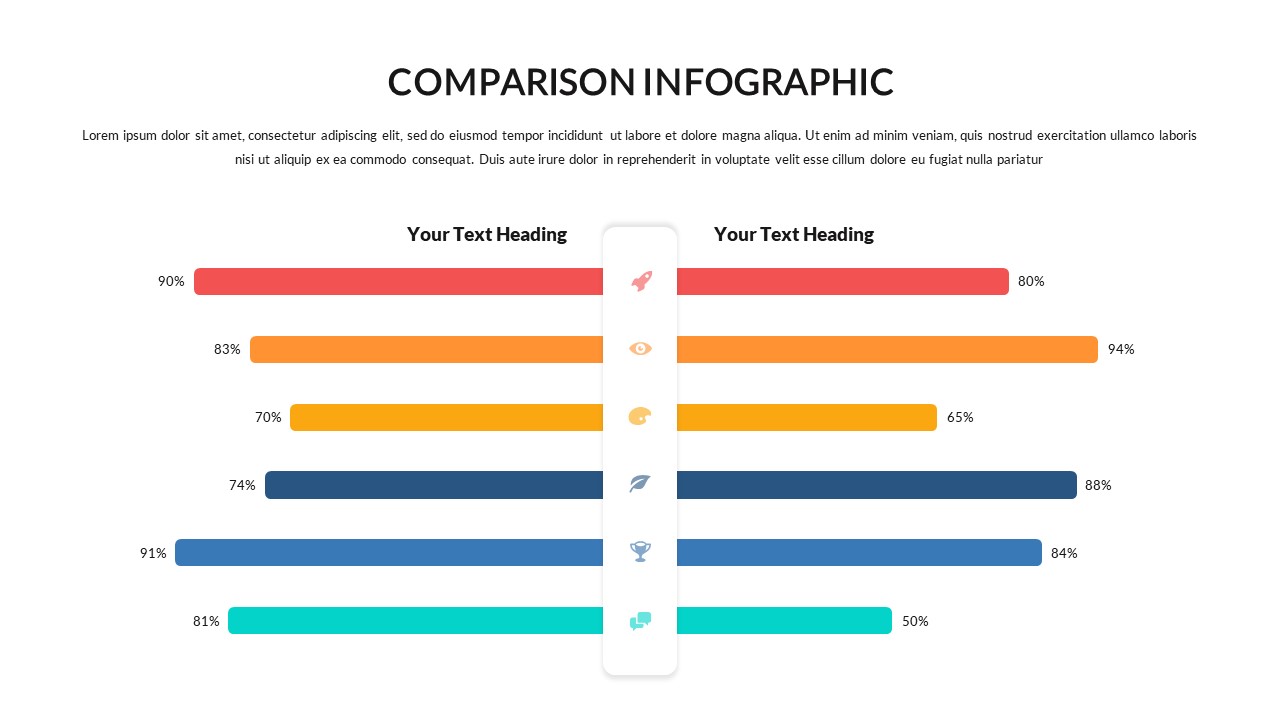
The PPT SWOT Bar Chart Template is an effective tool for comparing strengths, weaknesses, opportunities, and threats across multiple scenarios. This SWOT Analysis PPT Slide template integrates the popular SWOT analysis framework with a bar chart format, making it easier to visualize and rank different aspects of various business strategies, projects, or competitive landscapes. The horizontal bars, color-coded to represent each SWOT component (green for Strength, yellow for Weakness, blue for Opportunity, and red for Threat), allow for a quick, side-by-side comparison of up to four scenarios.
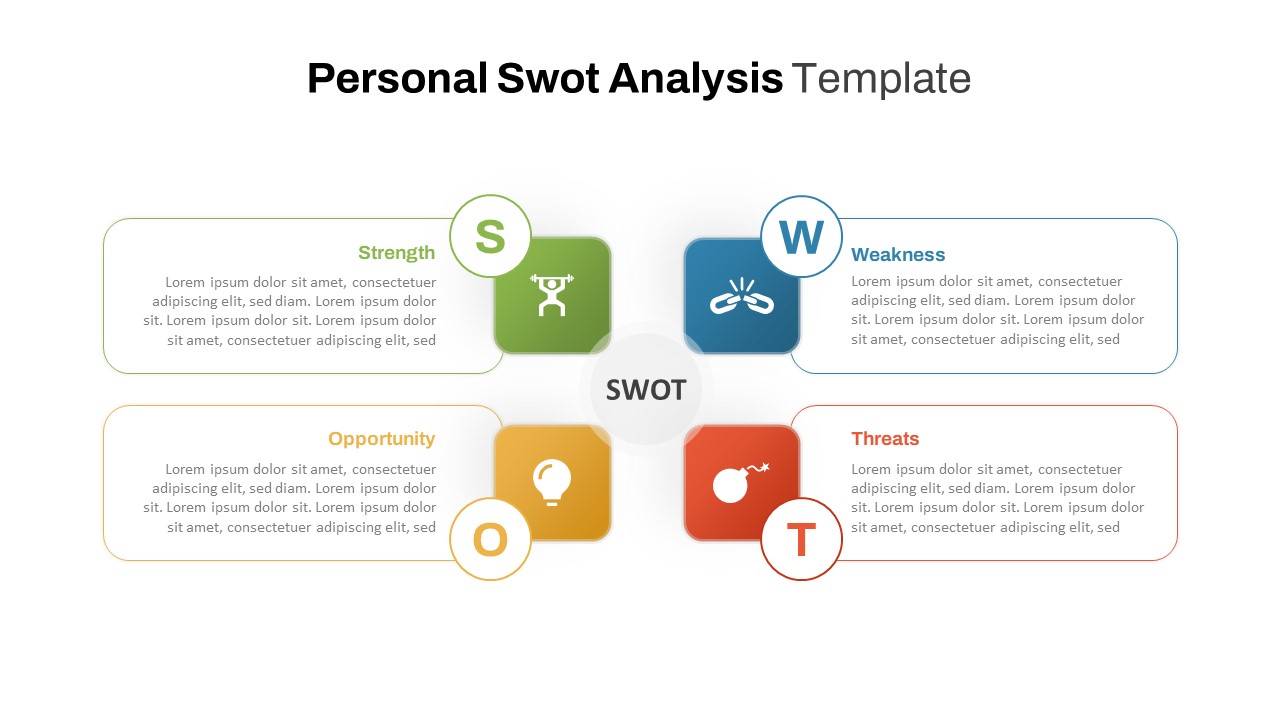
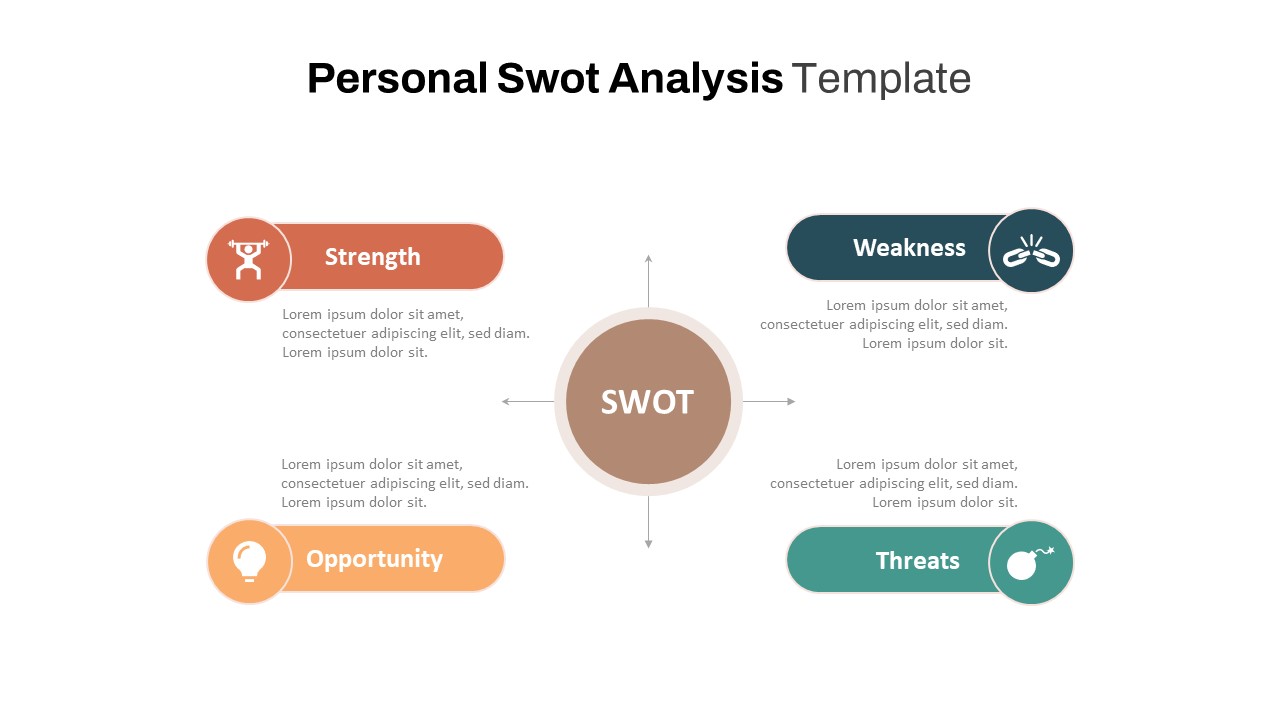
The template is perfect for business professionals, strategists, and consultants who need to analyze different scenarios and make informed decisions. Whether you are evaluating a new product launch, analyzing market entry strategies, or reviewing internal performance, this template provides a structured and visually clear way to present your findings. The side panel further breaks down each SWOT element with detailed descriptions, helping to provide deeper insights into the data being compared.
Customizable and easy to edit, this template is compatible with both PowerPoint and Google Slides, allowing for flexibility in creating presentations. You can modify colors, text, and data values to align with your specific analysis needs, making it a versatile tool for strategic planning sessions, board meetings, and performance reviews.
See more

Aspect Ratio
16:9Item ID
SKT01678
Features of this template
Other User Cases of the Template:
Business strategy evaluation, product launch comparison, market analysis, competitor benchmarking, risk assessment, project performance review, internal audit, resource allocation analysis, financial planning, decision-making presentations.FAQs
You May Also Like These Presentation Templates


- Free
- Free

- Free

- Free
- Free
- Free

- Free