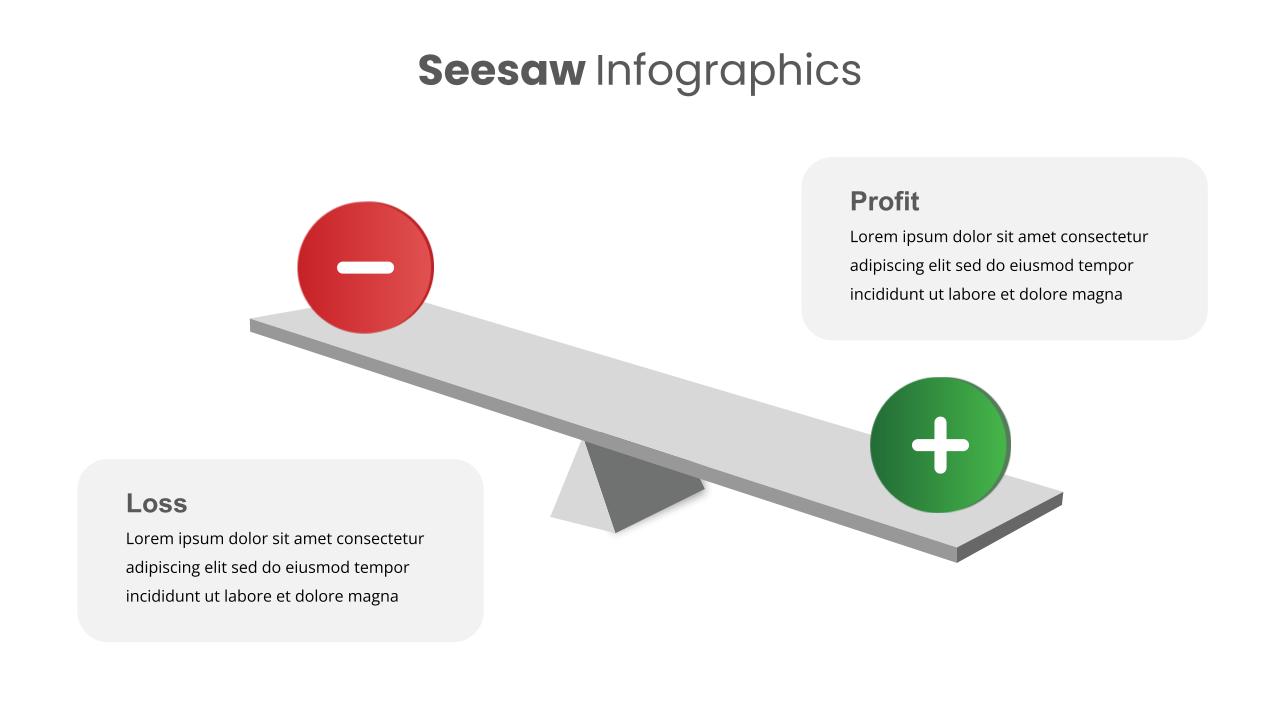
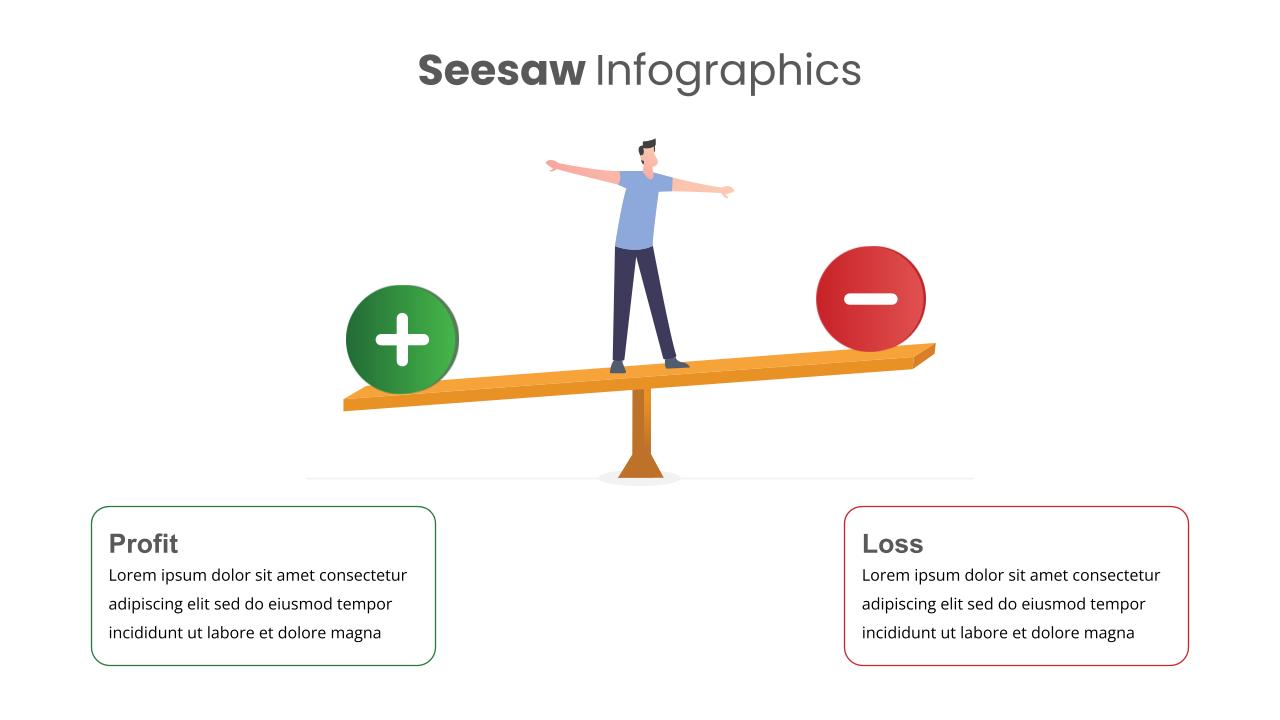
Profit vs Loss Analysis Stock Market Template

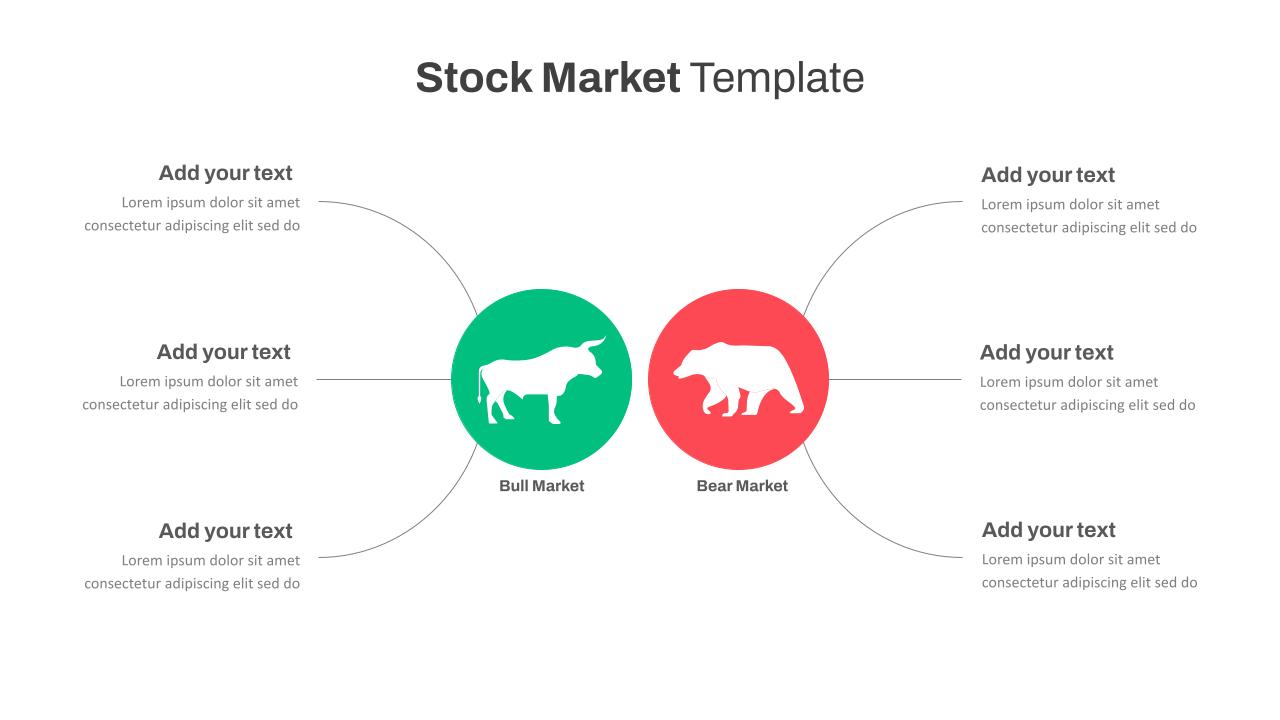
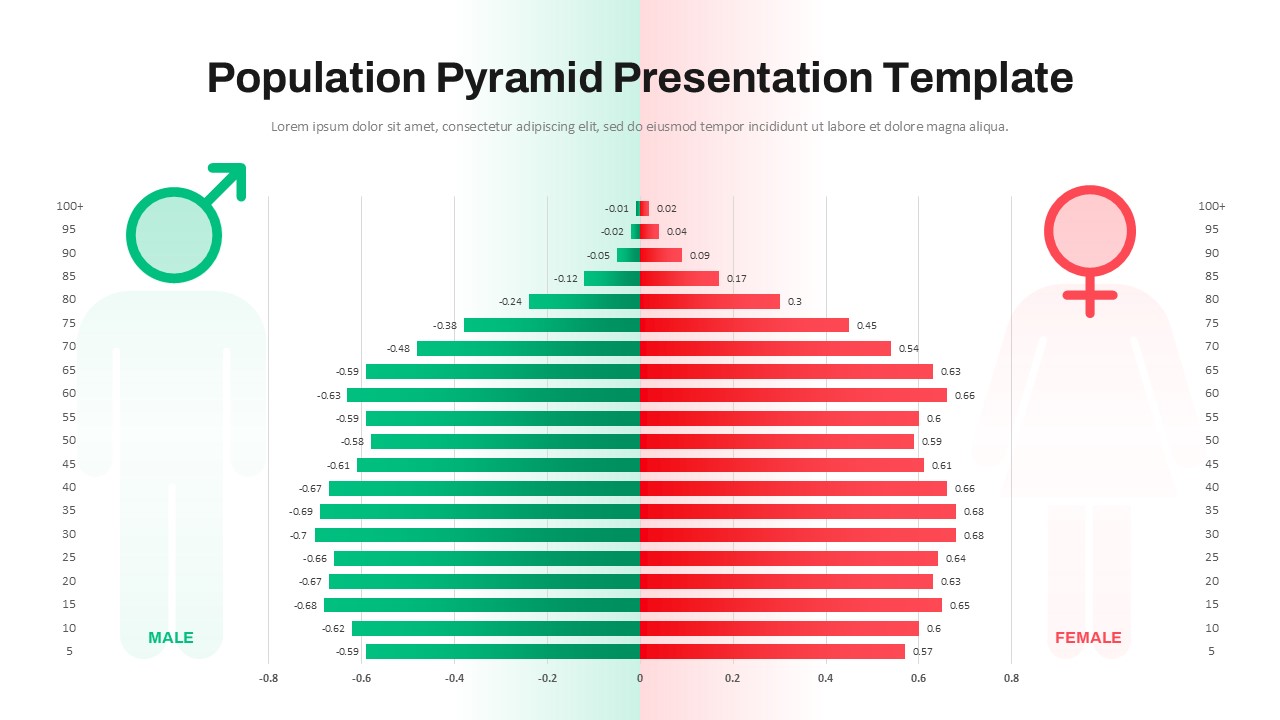
The Stock Market PowerPoint Presentation template provides a visually clear and concise way to present financial data, focusing on the trends of profit and loss in stock market performance. The template uses a simple yet effective design featuring bar charts in green and red, representing profit and loss, respectively. This structured layout makes it easy for presenters to explain financial outcomes, market fluctuations, and investment strategies to stakeholders, investors, or colleagues.
With its clean and professional design, this PowerPoint presentation graphics template is ideal for business professionals, financial analysts, or stock market educators. The use of contrasting colors—green for profits and red for losses—enables quick comprehension of complex data sets, making it perfect for presentations on financial reports, quarterly earnings, market trends, and investment portfolio reviews. Each section of the template can be customized to fit specific data points, ensuring a tailored presentation for any industry or market sector.
Fully compatible with both PowerPoint and Google Slides, this template power point business allows for seamless editing and collaboration , making it suitable for both in-person and virtual presentations. Its simplicity, combined with a sharp focus on financial performance, ensures that your message is conveyed effectively, whether you’re showcasing past performance, projecting future growth, or highlighting market risks.
See more

Aspect Ratio
16:9Item ID
SKT00933
Features of this template
FAQs
You May Also Like These Presentation Templates


- Free
- Free


- Free
- Free
- Free
- Free

- Free
- Free