Project Management Dashboard Template for PowerPoint & Google Slides
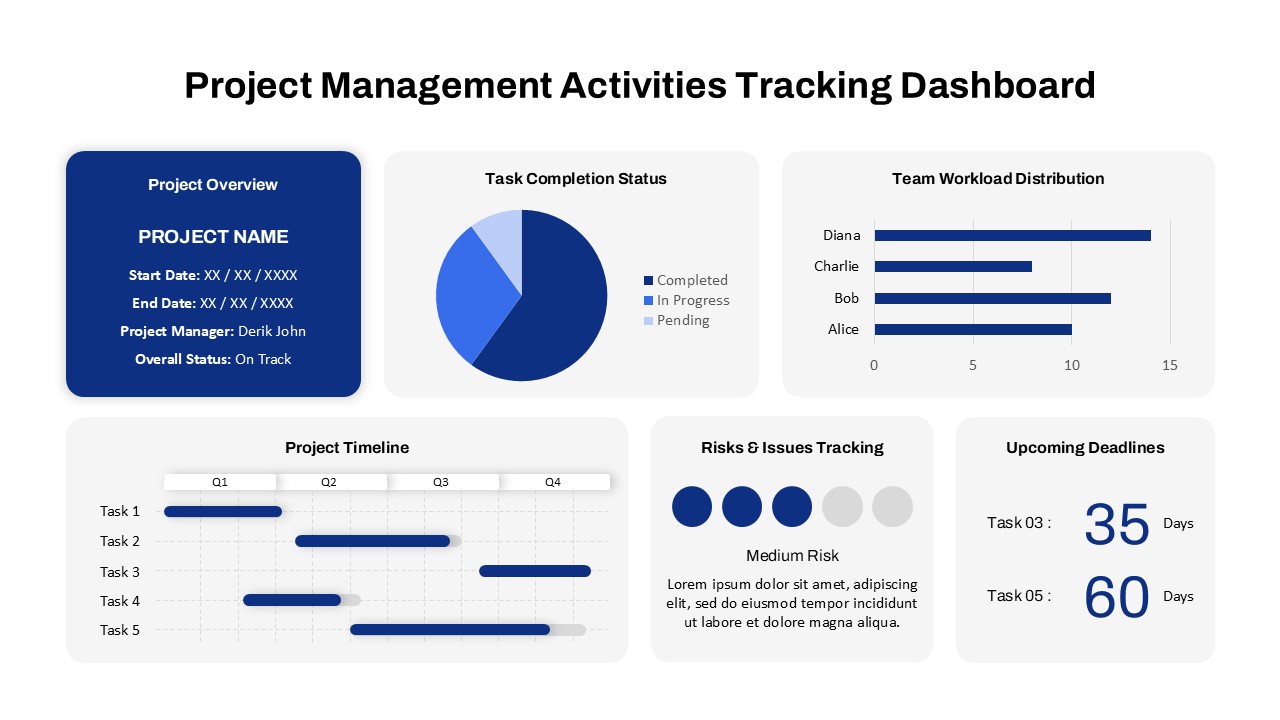
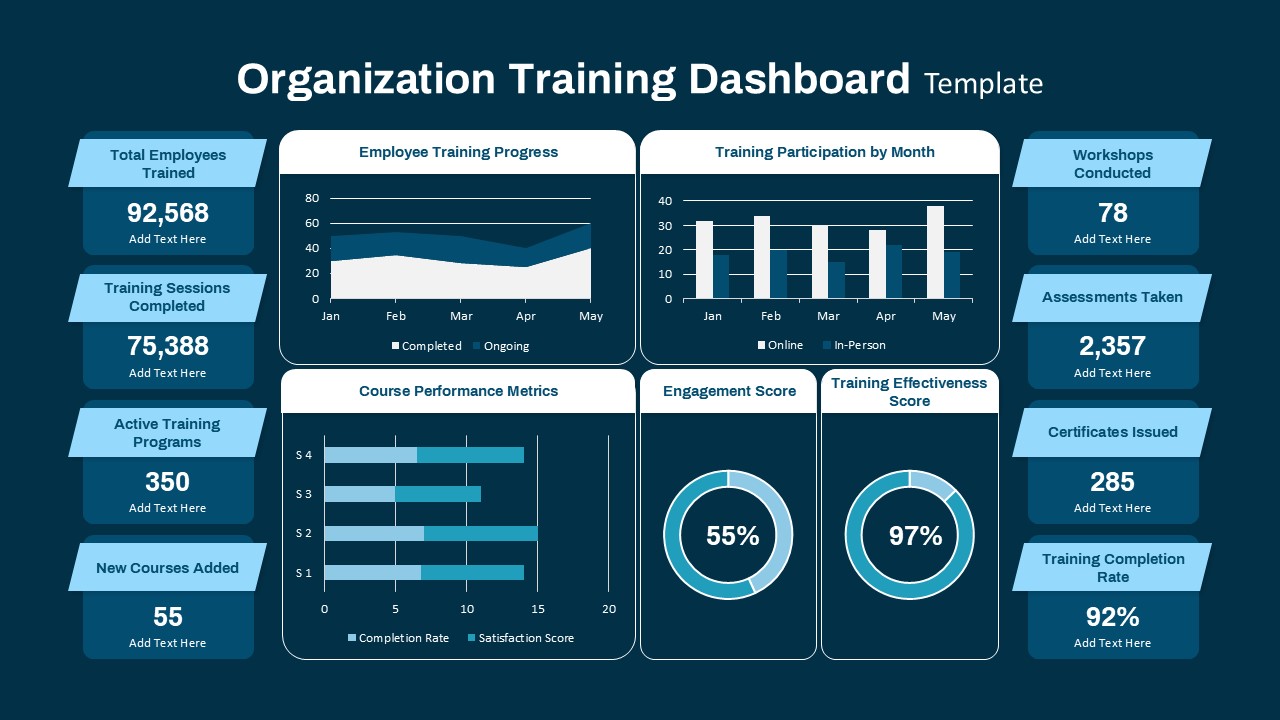
Stay in control of your projects with this visually organized Project Management Activities Tracking Dashboard Template, one of the most practical and professional project management dashboard examples available for presentations. Whether you’re managing internal teams, client deliverables, or product rollouts, this template offers a clean, data-driven layout to present key project metrics in one cohesive view.
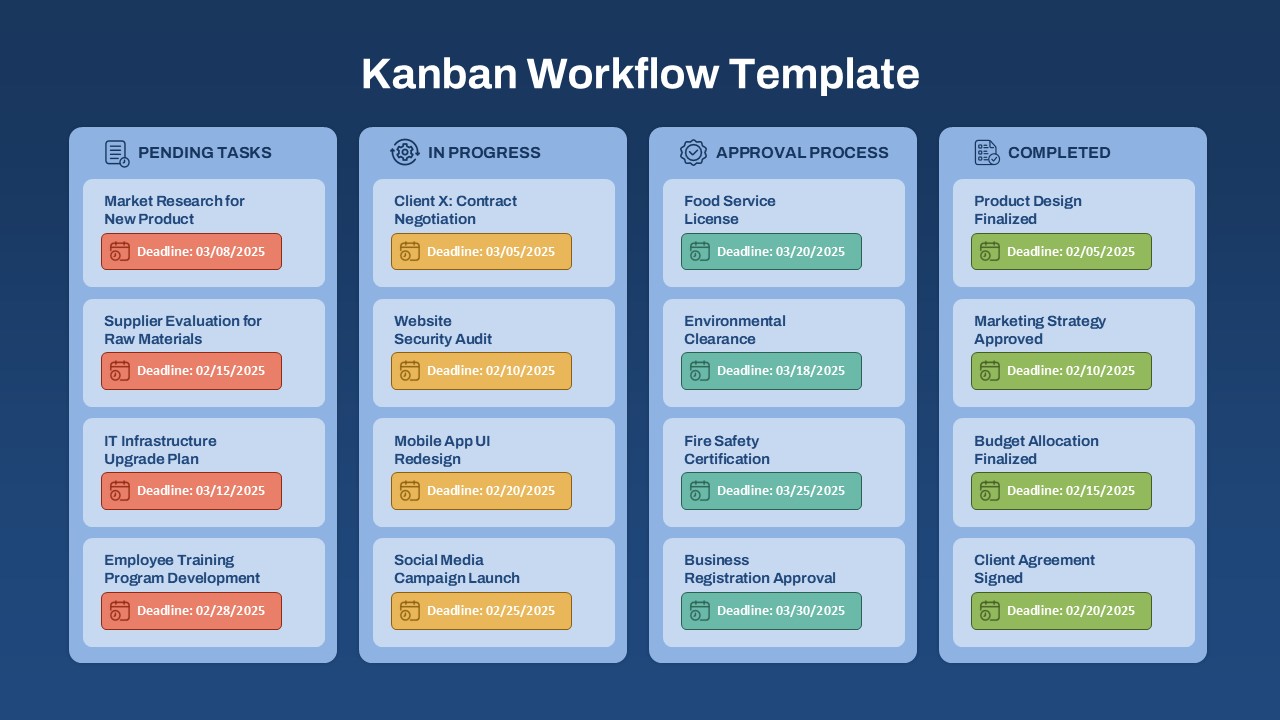
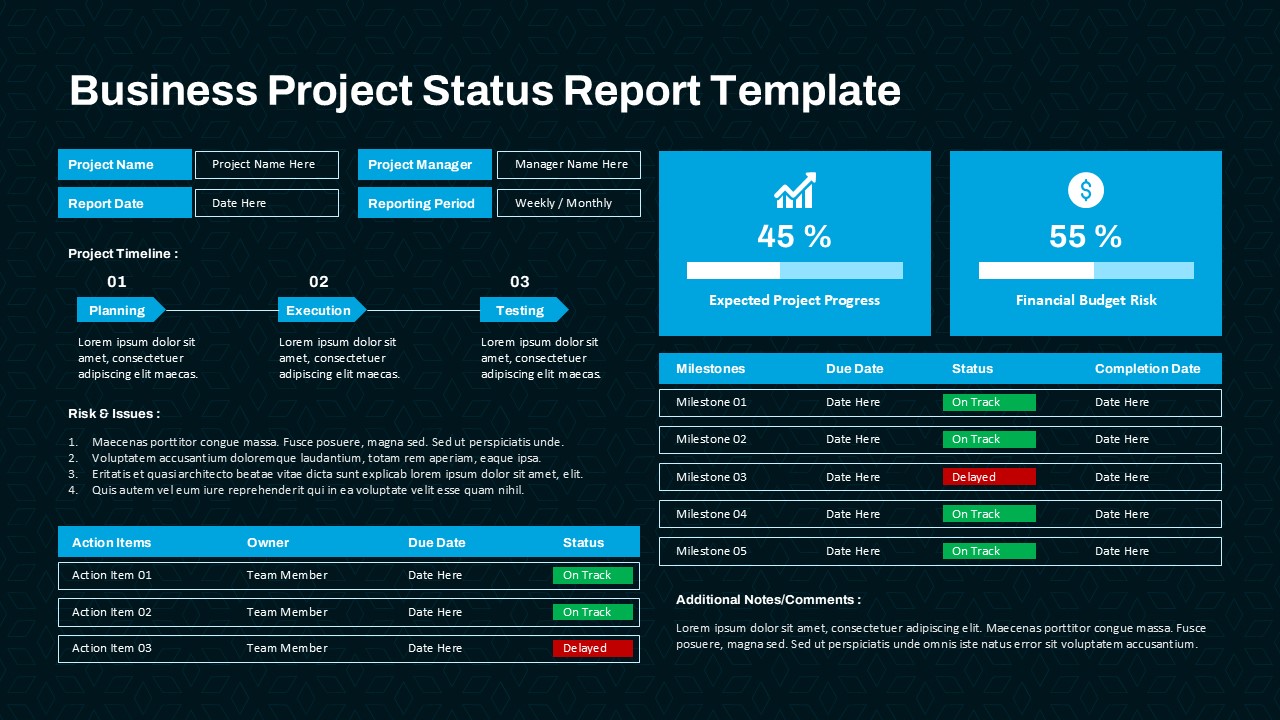
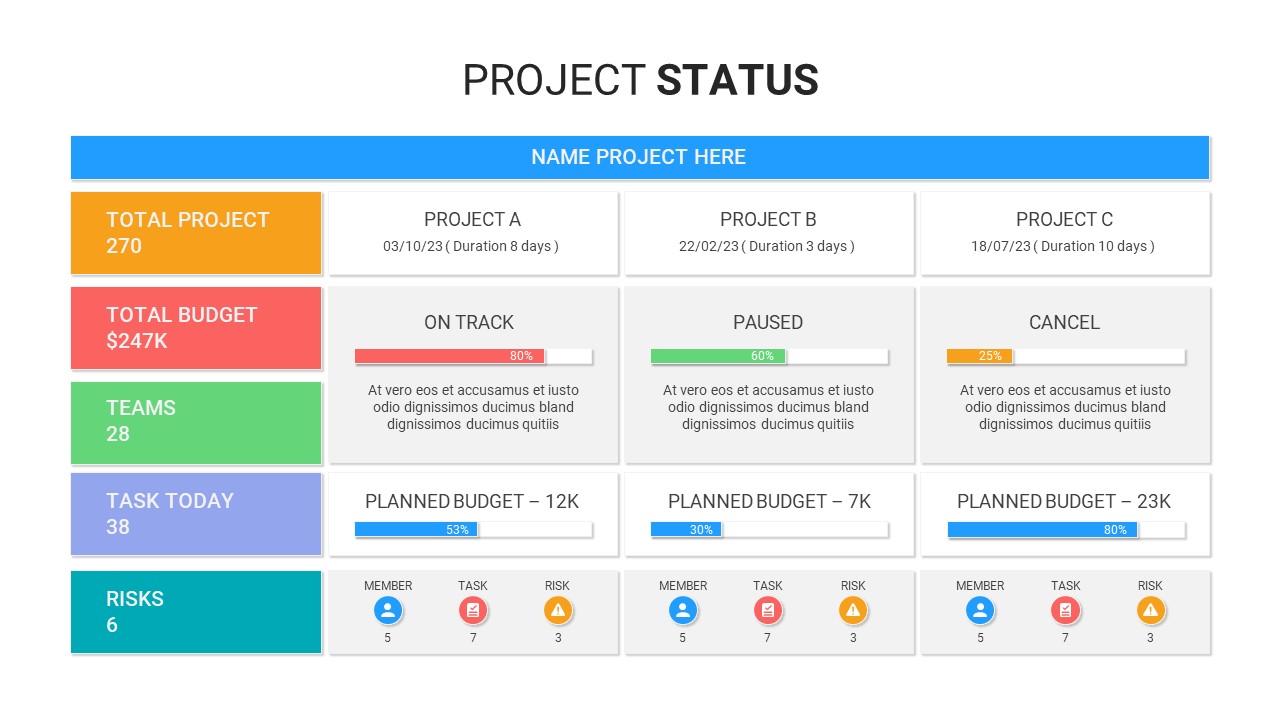
Divided into clearly defined panels, this template includes:
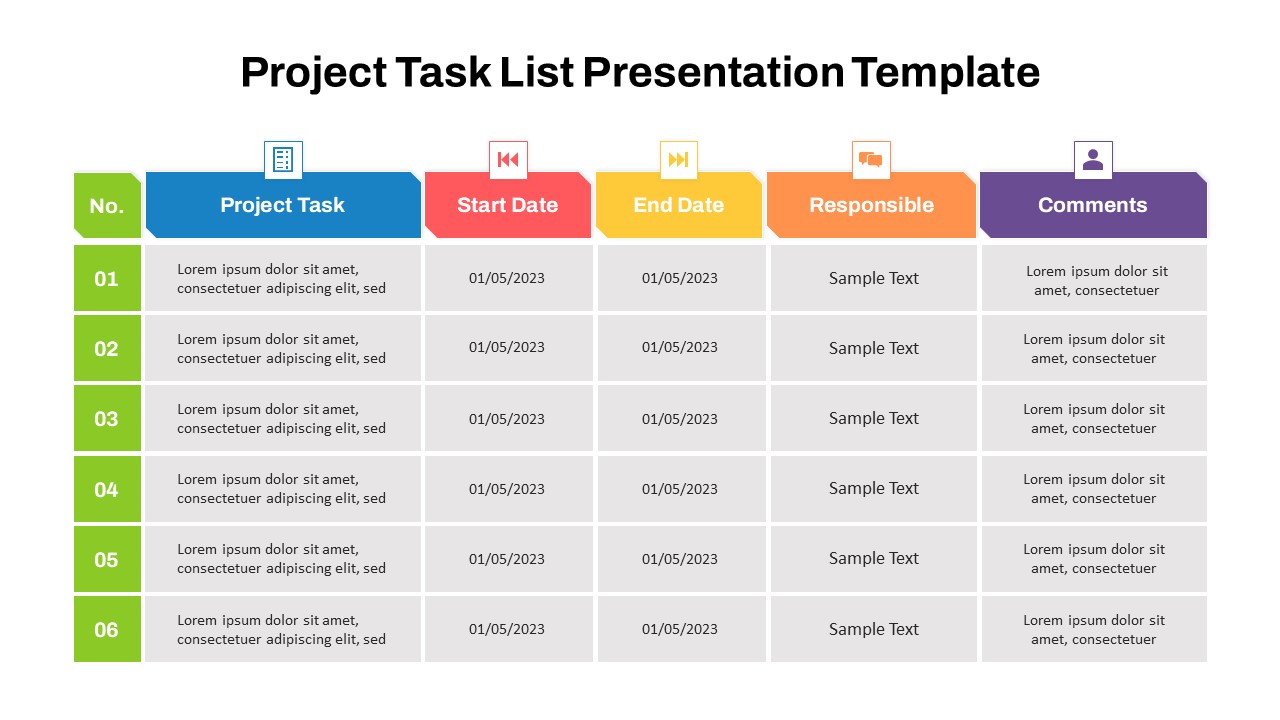
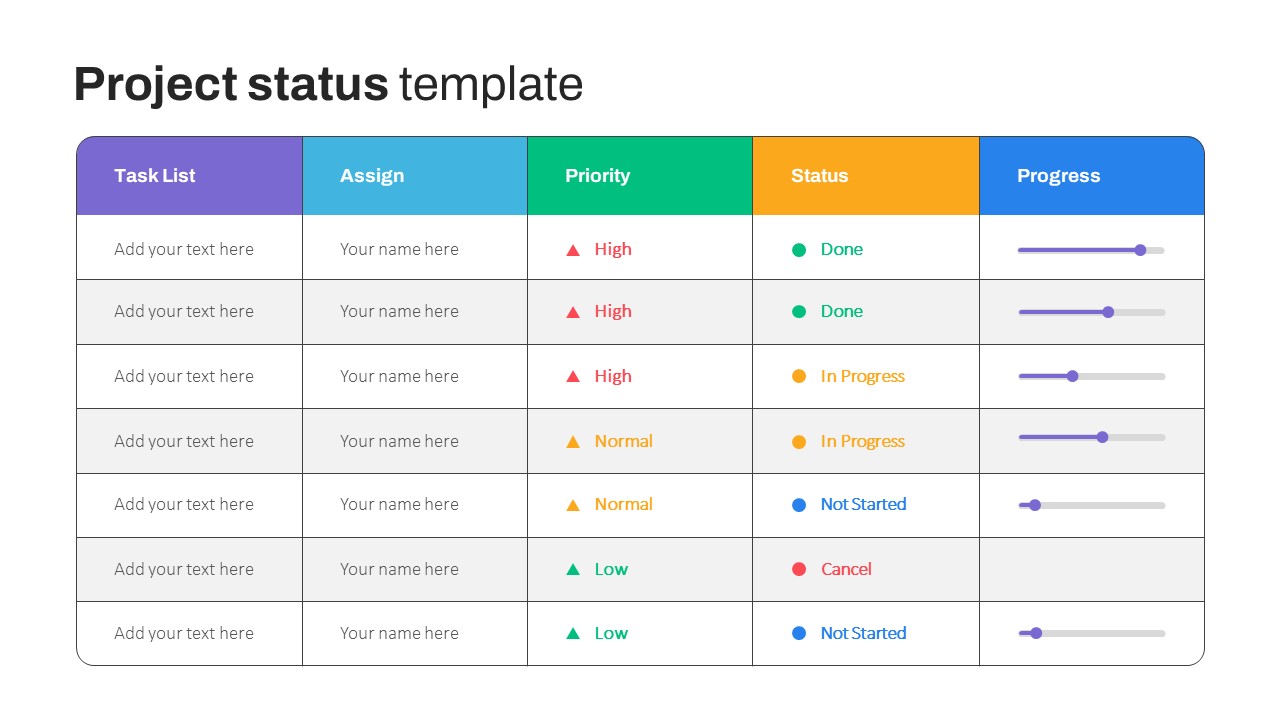
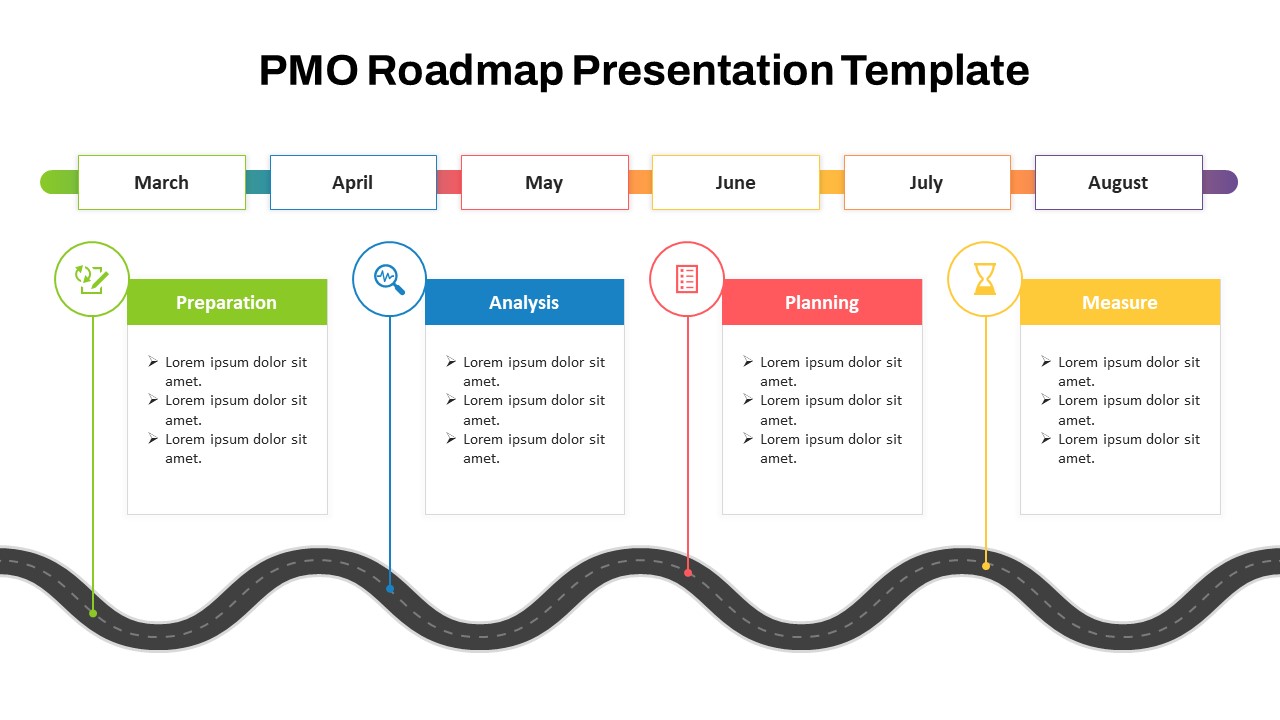
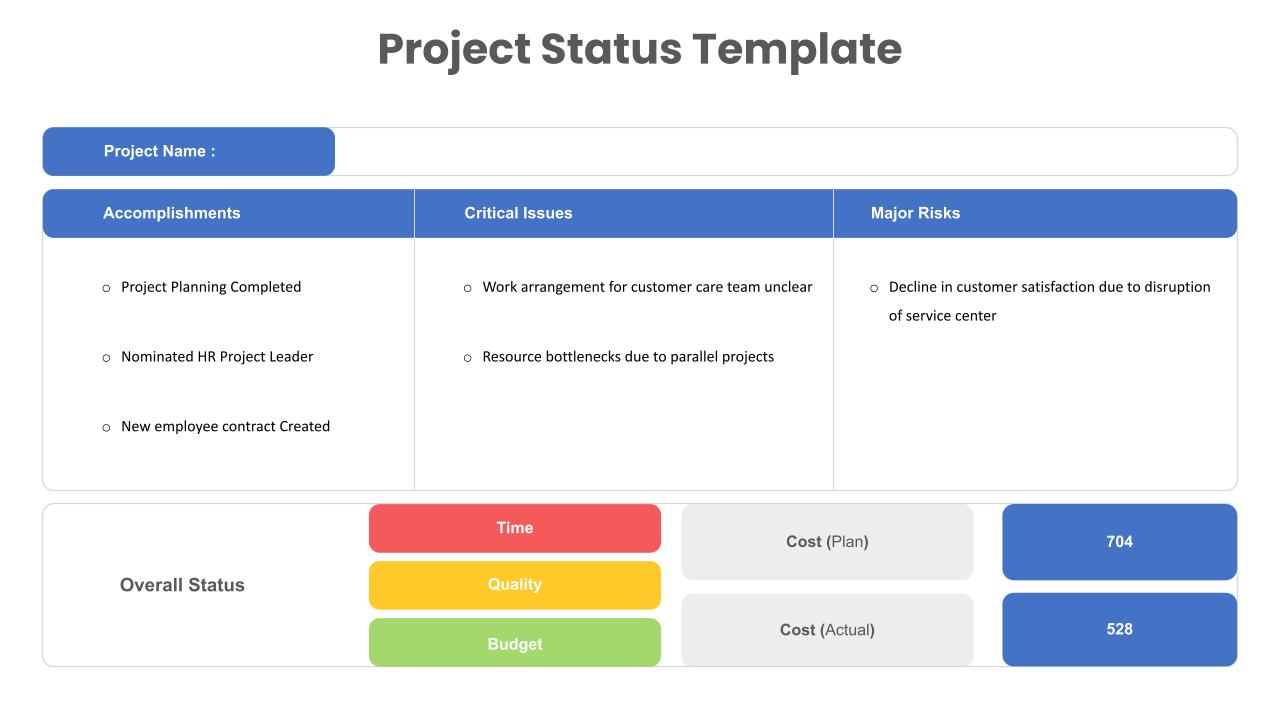
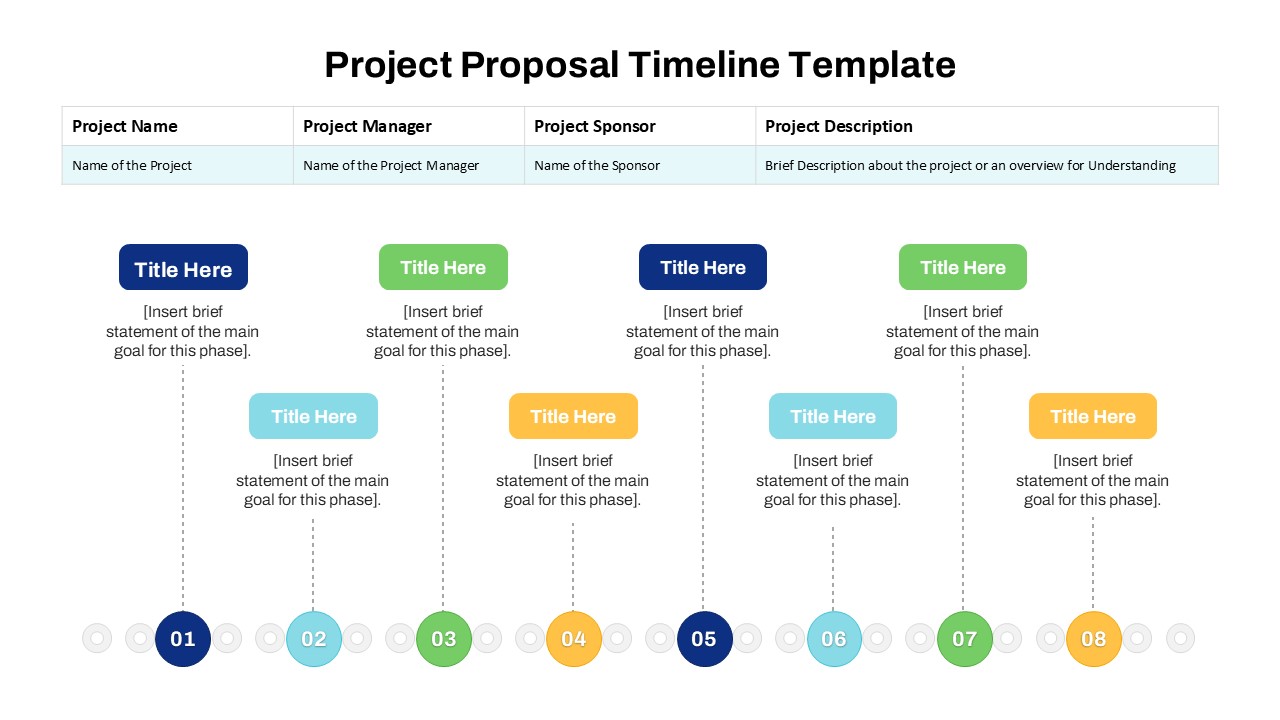
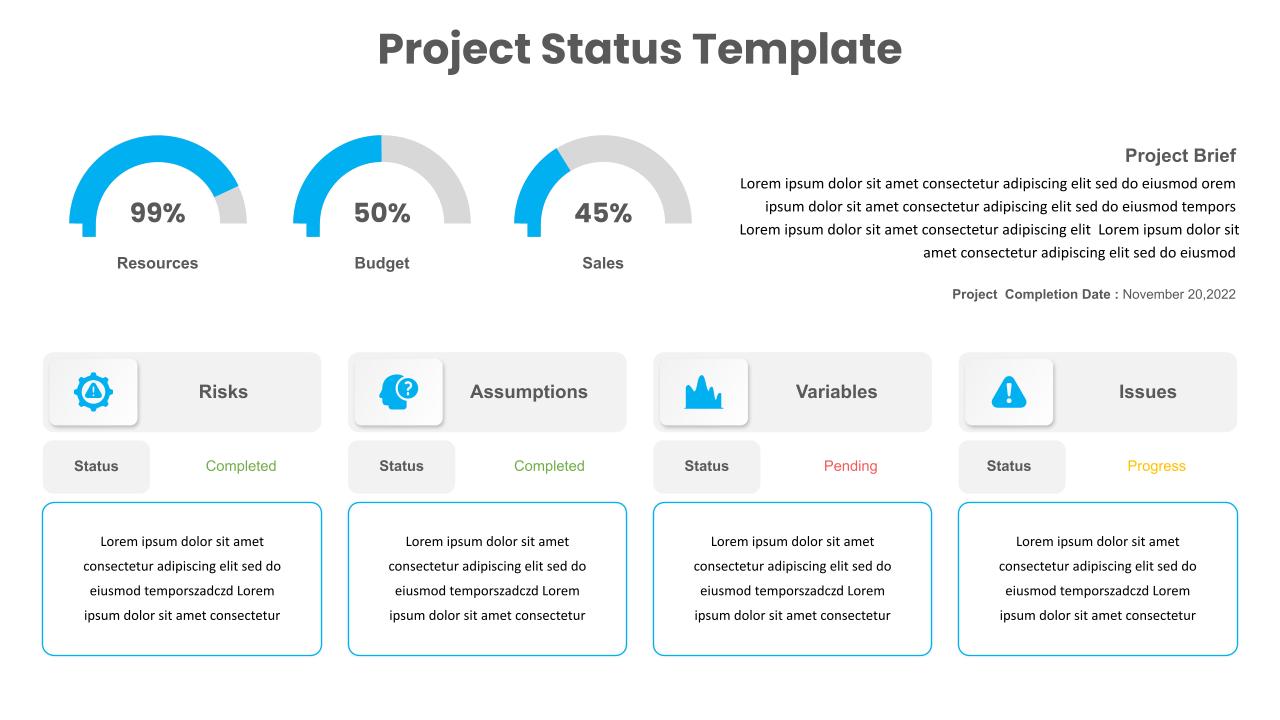
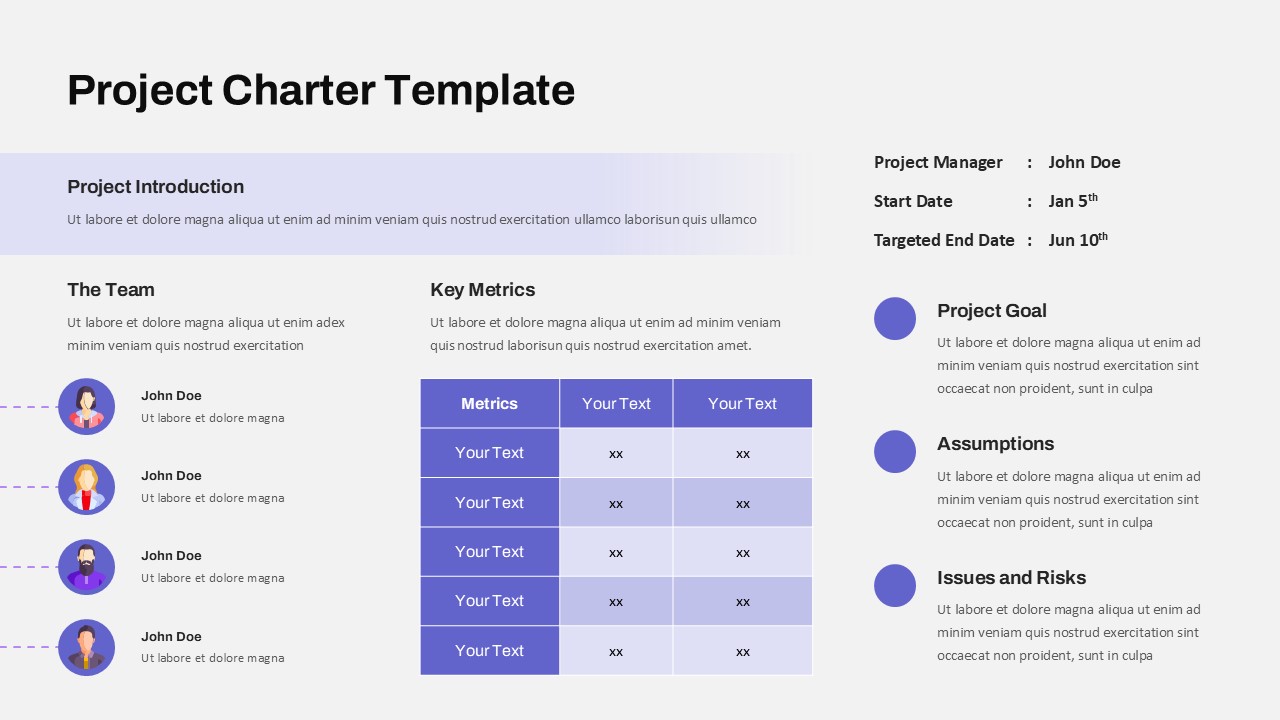
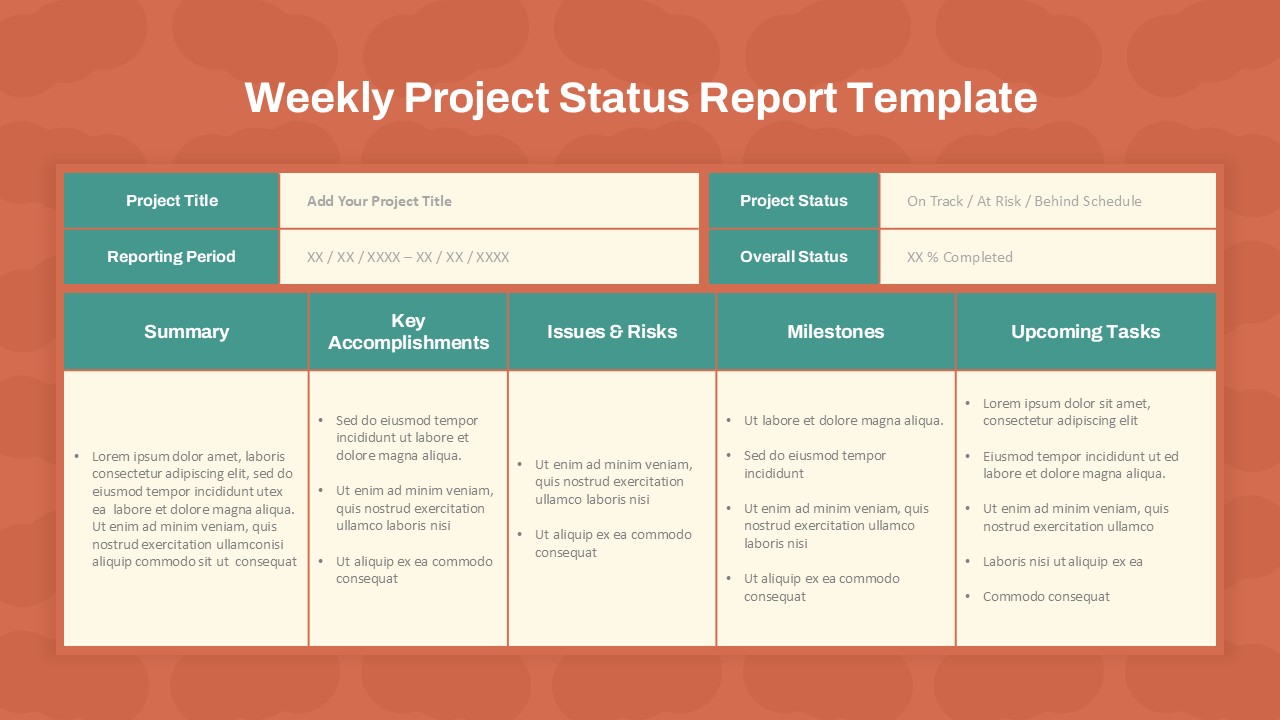
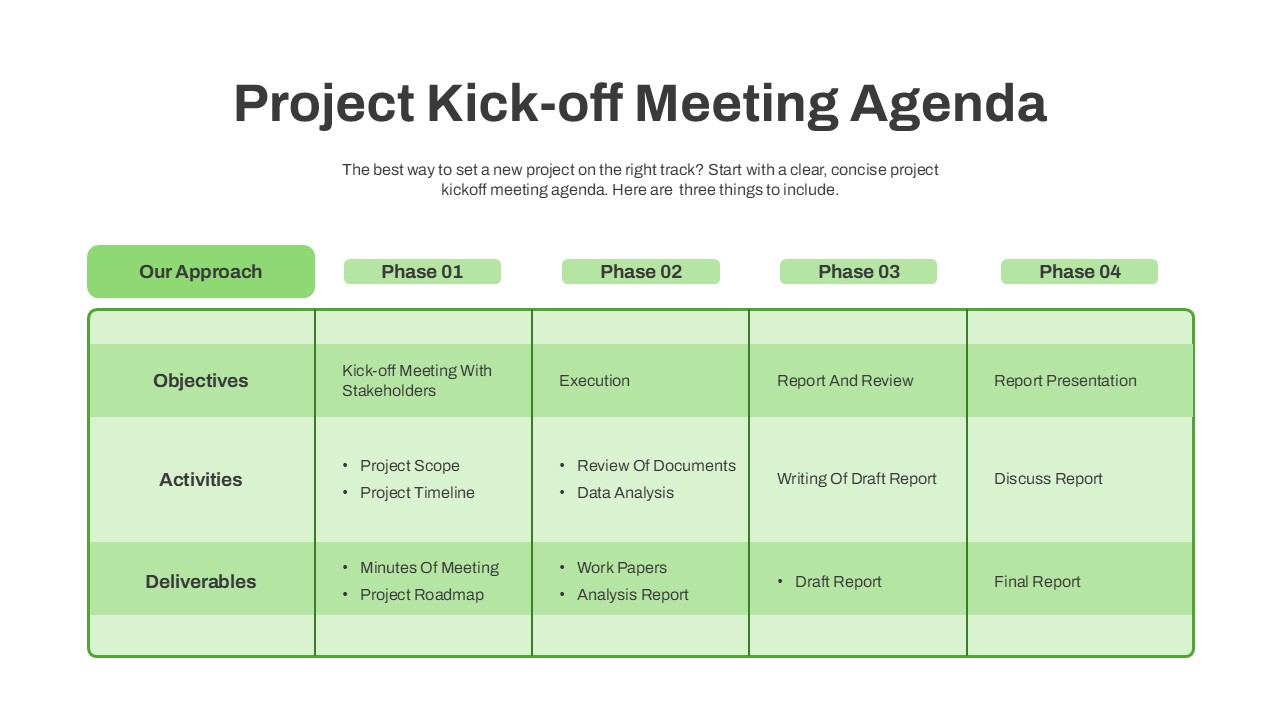
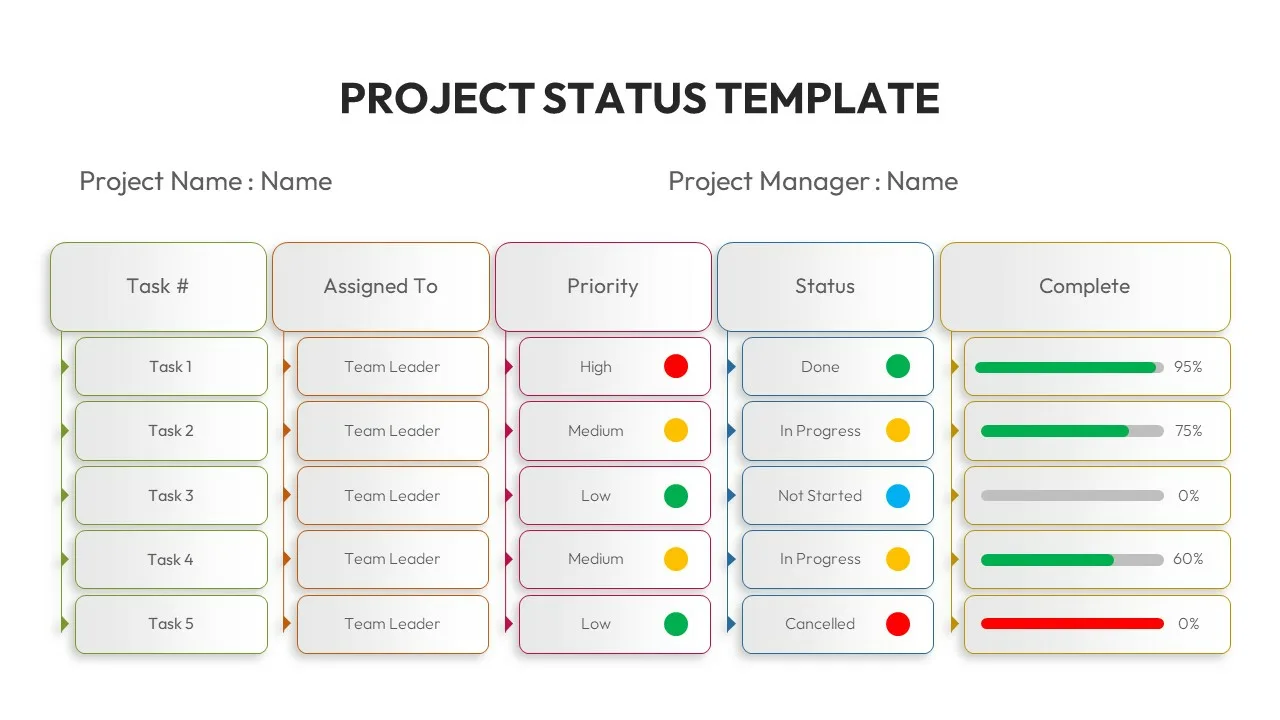
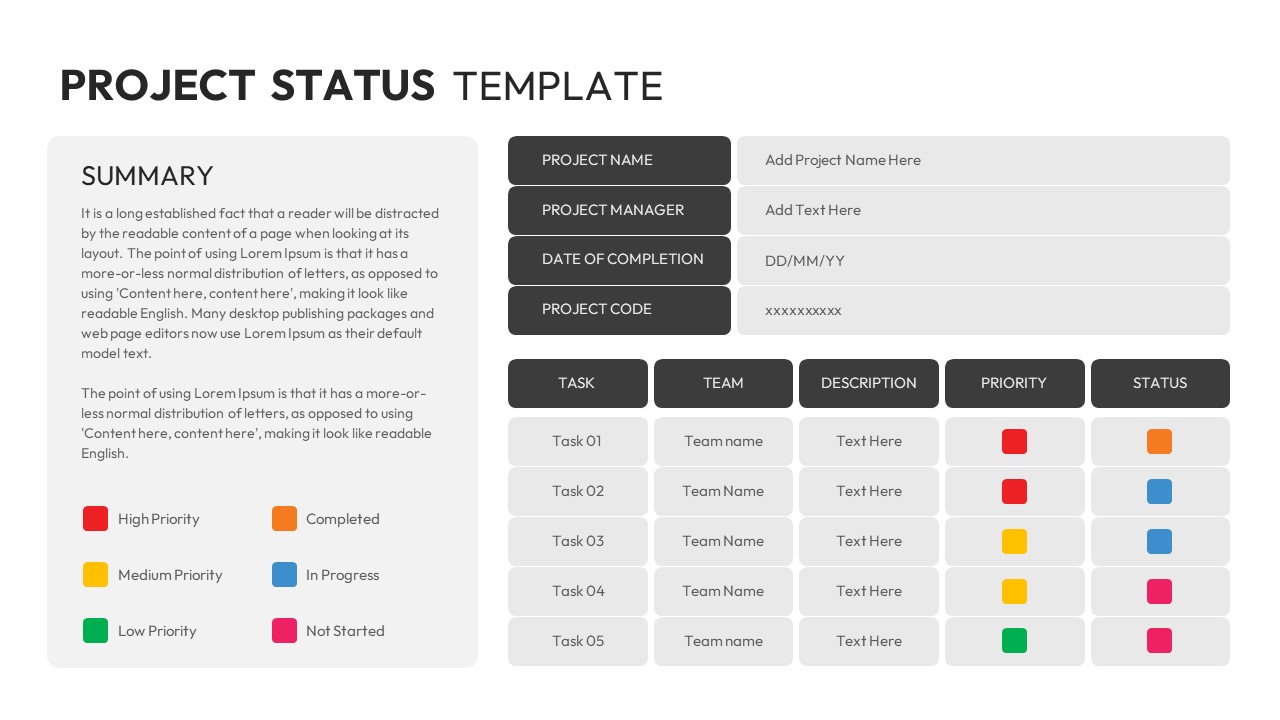
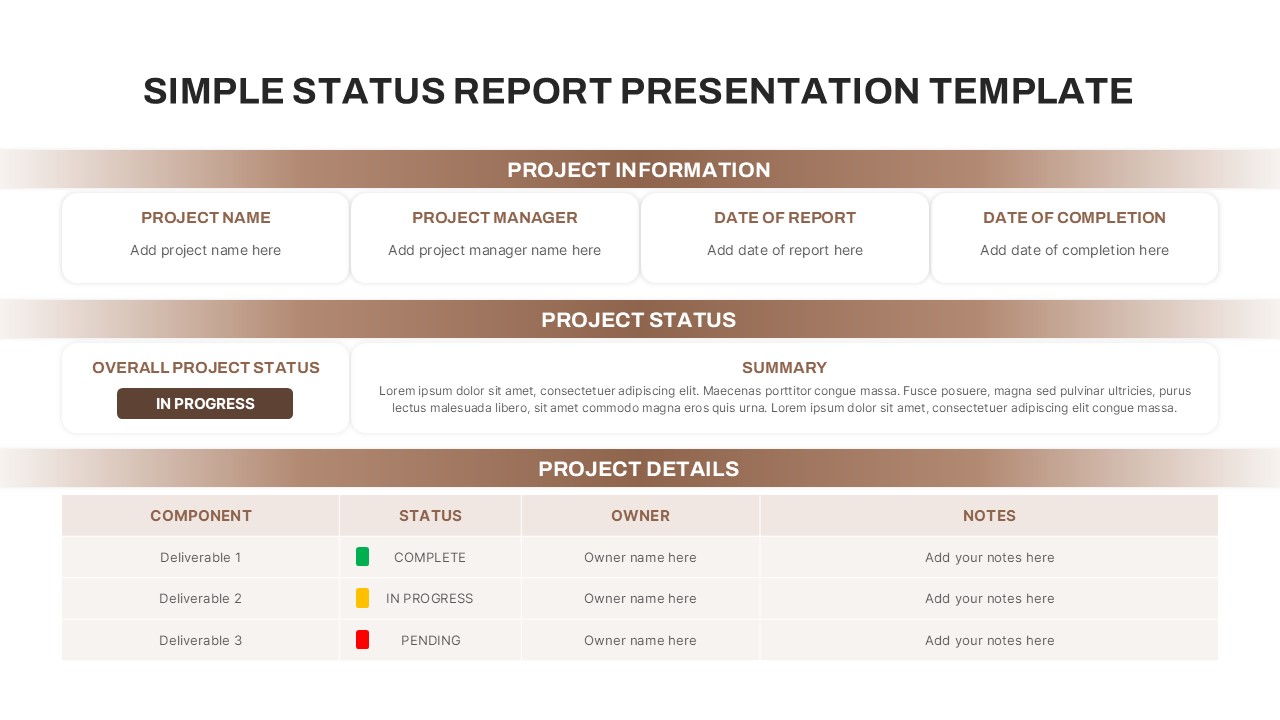
- Project Overview – Summarizes start/end dates, project manager, and overall progress
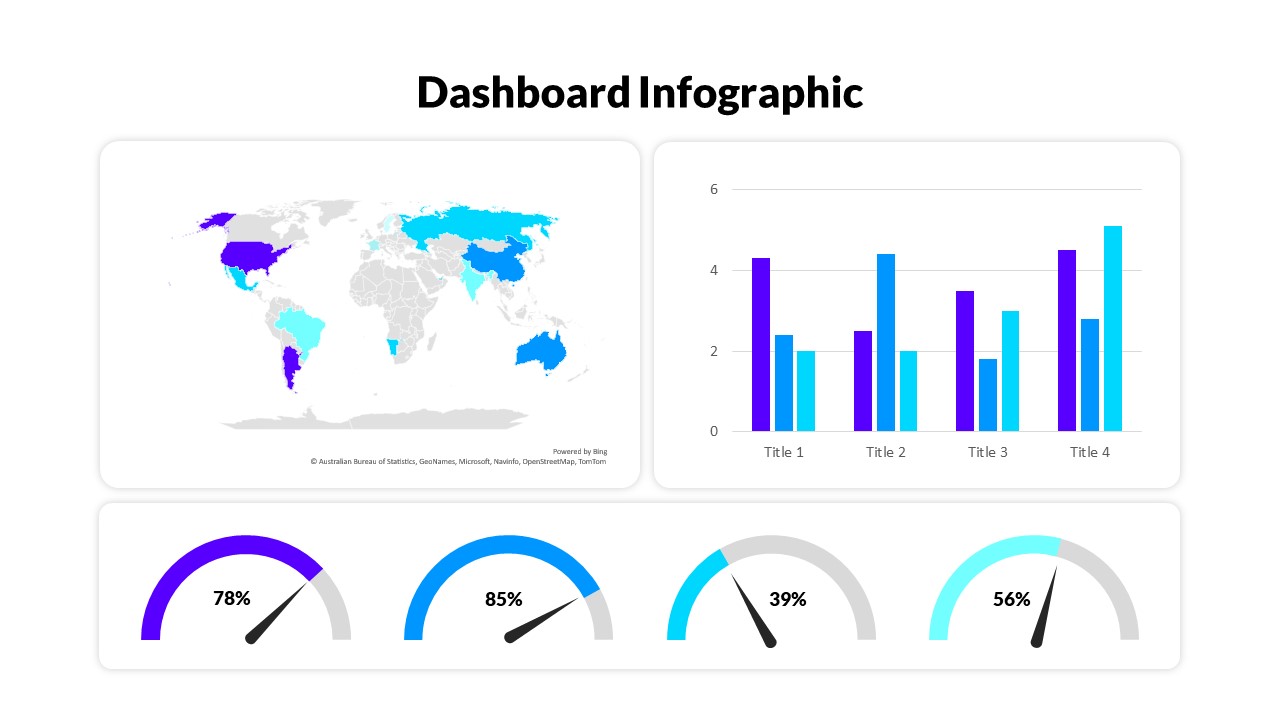
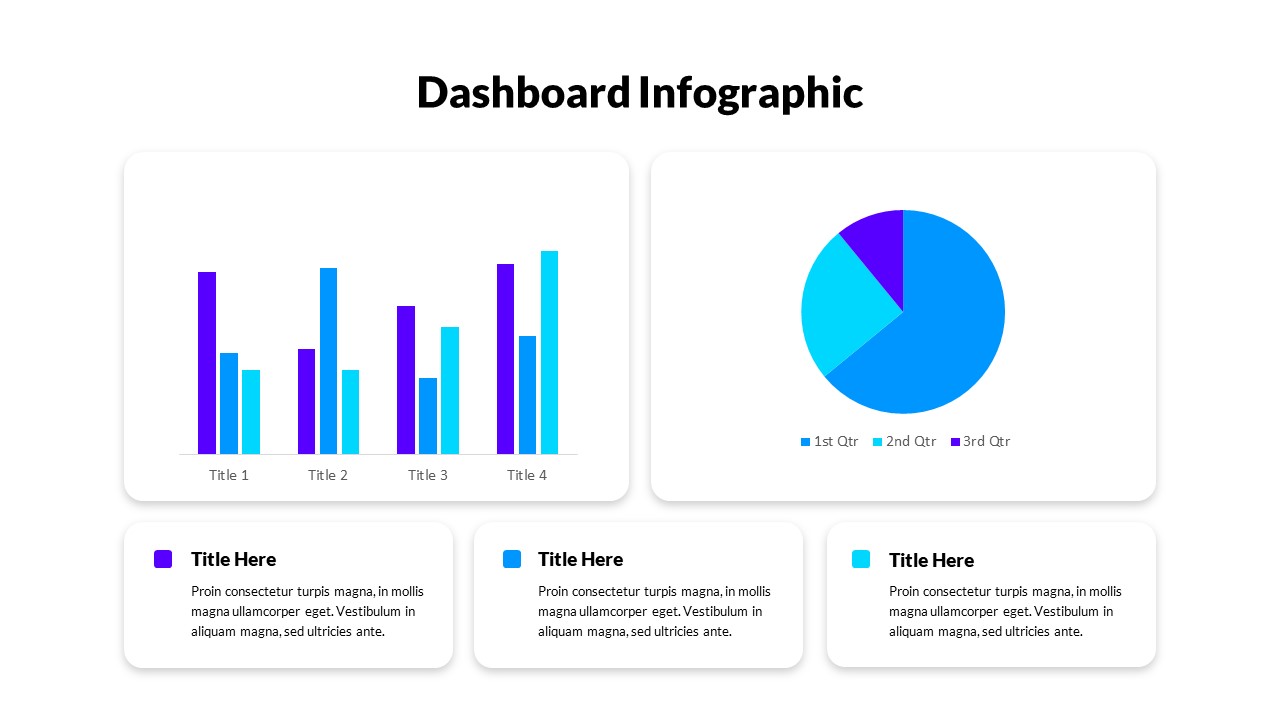
- Task Completion Status – Pie chart showing the percentage of completed, in-progress, and pending tasks
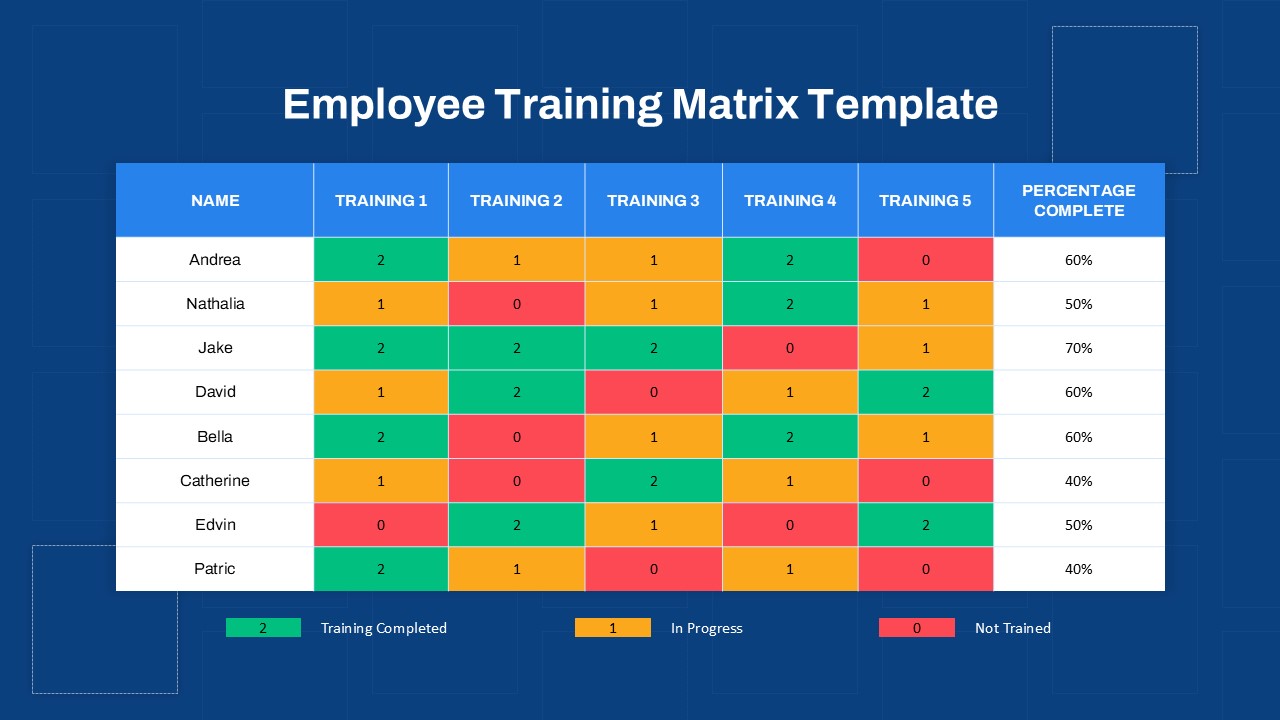
- Team Workload Distribution – Horizontal bar chart visualizing workload by team member
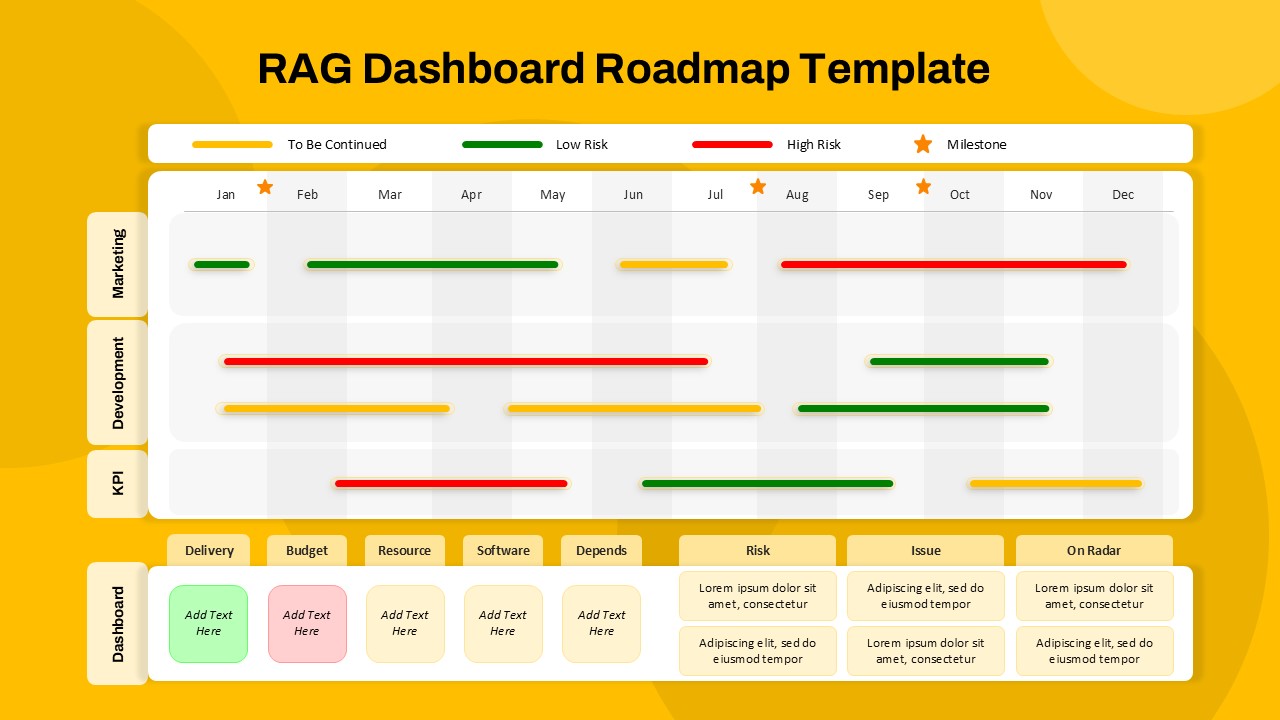
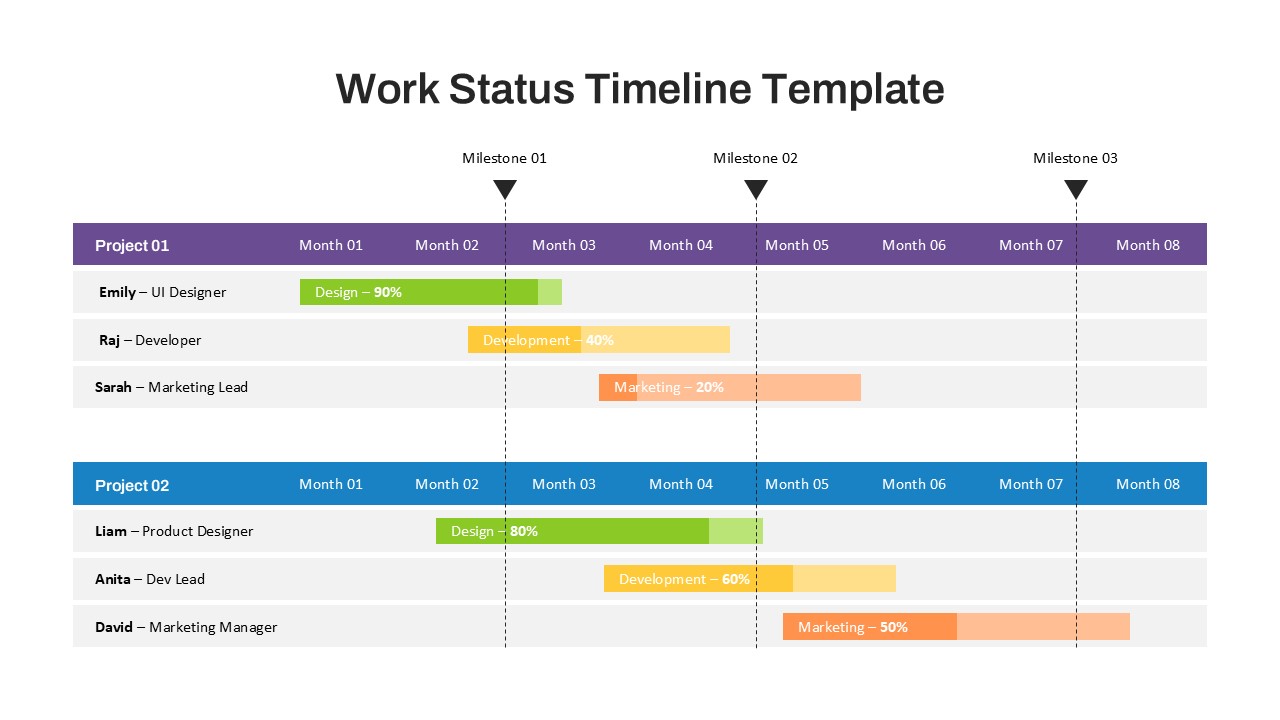
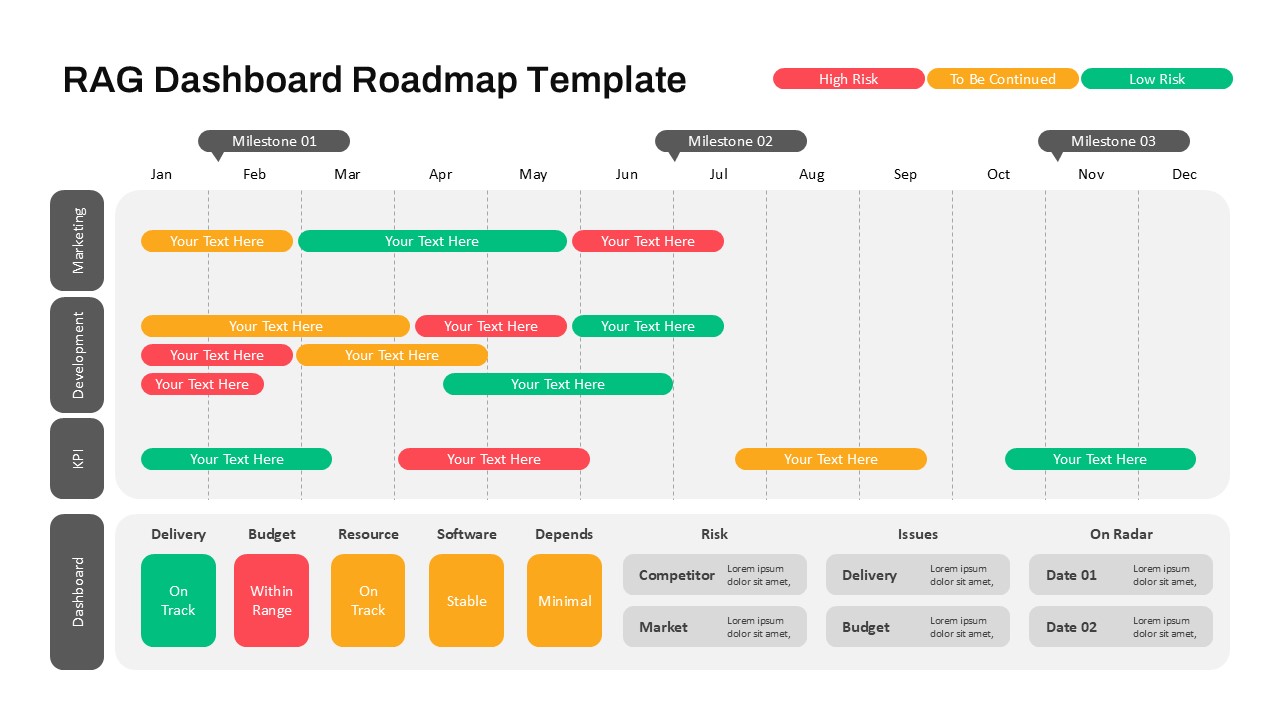
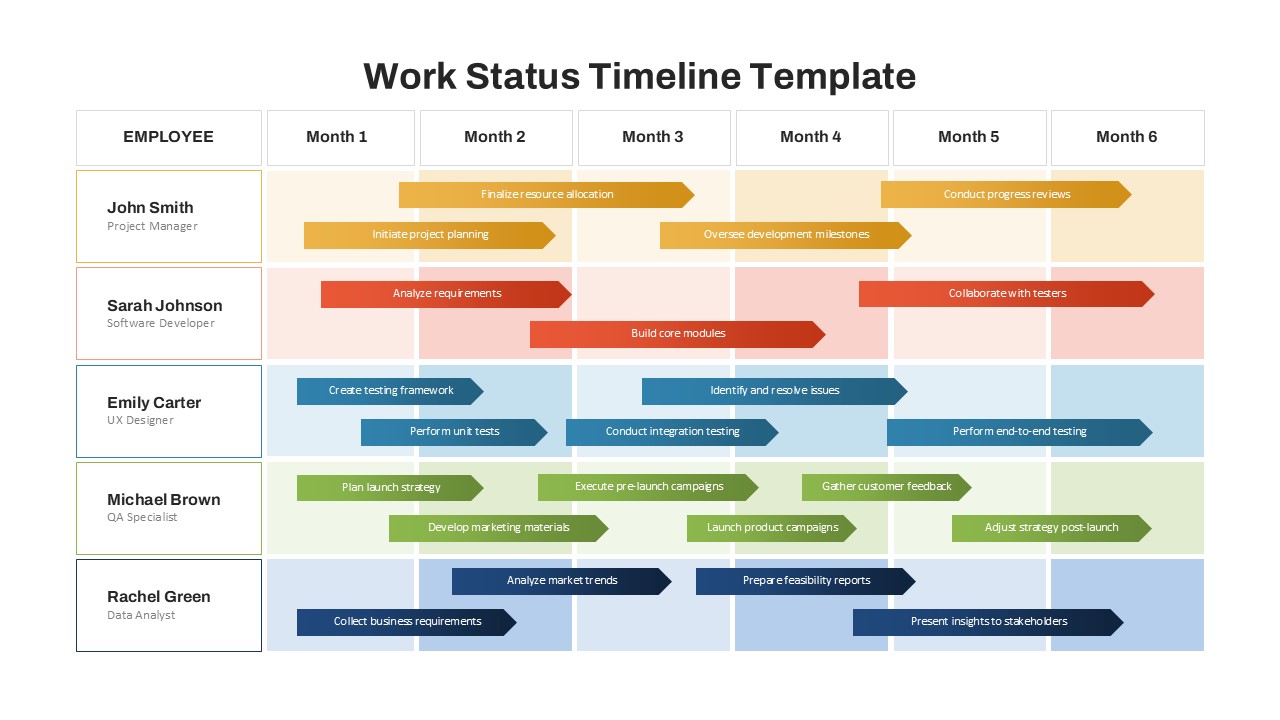
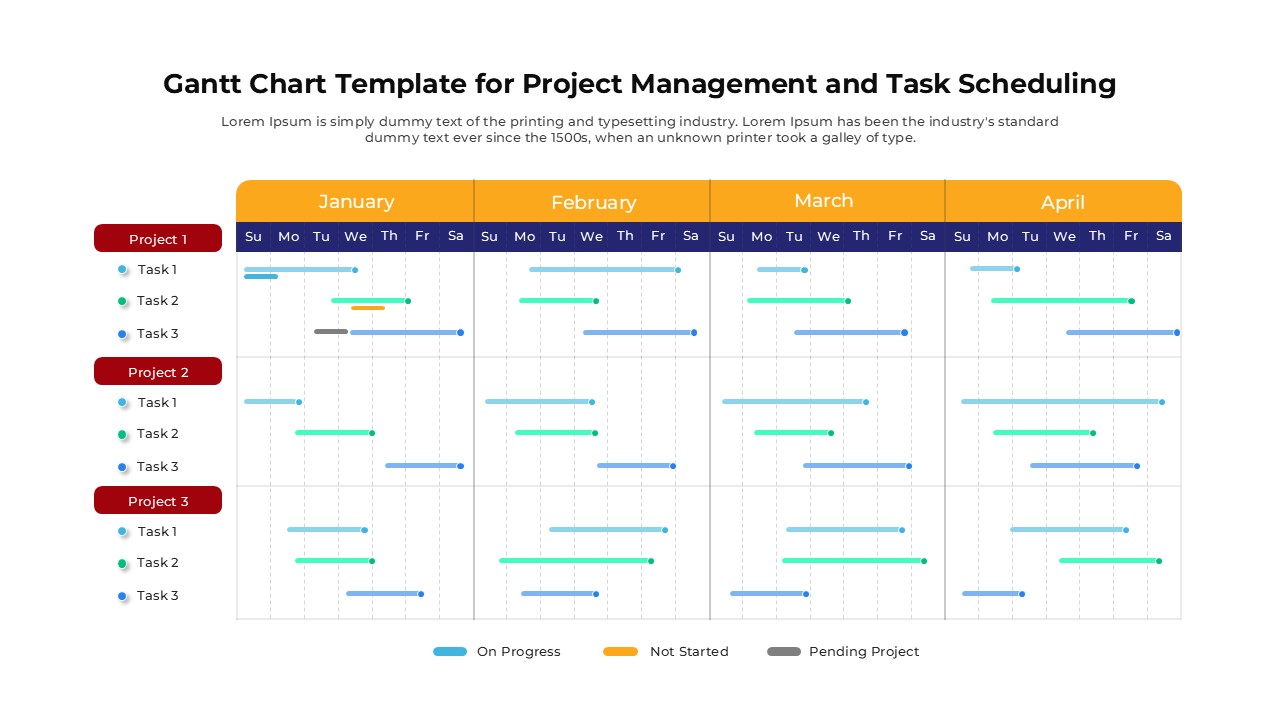
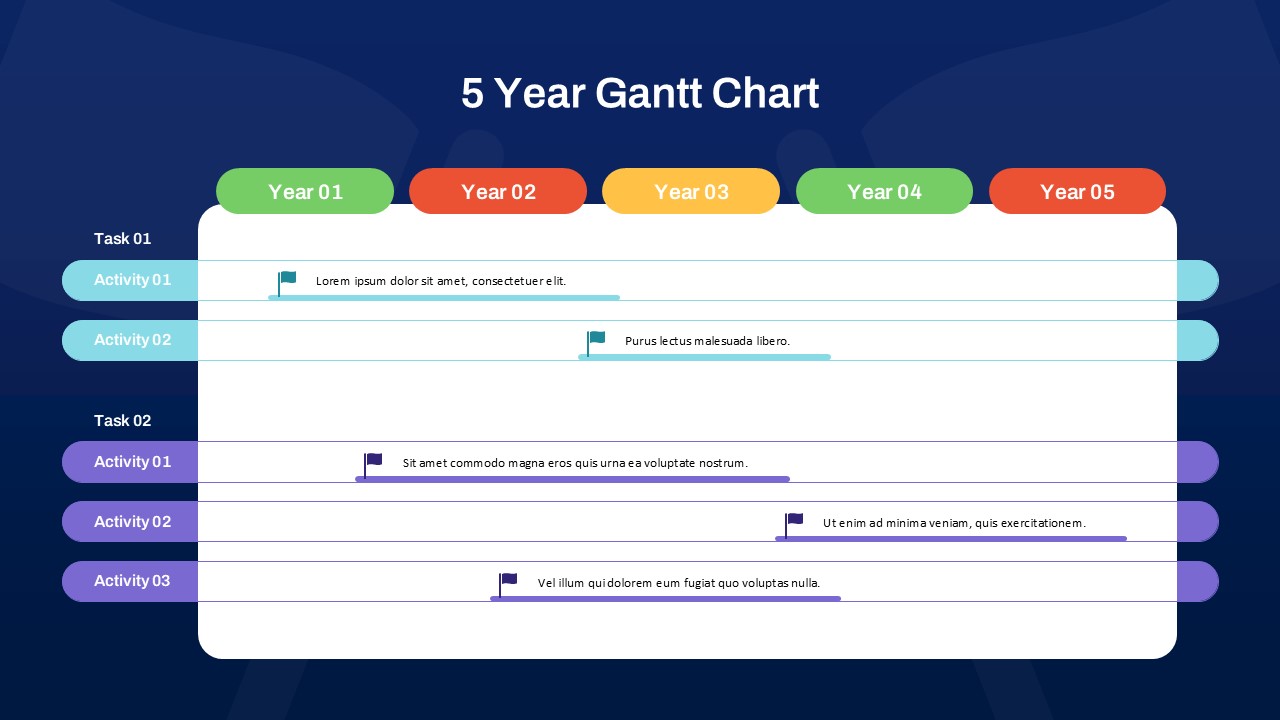
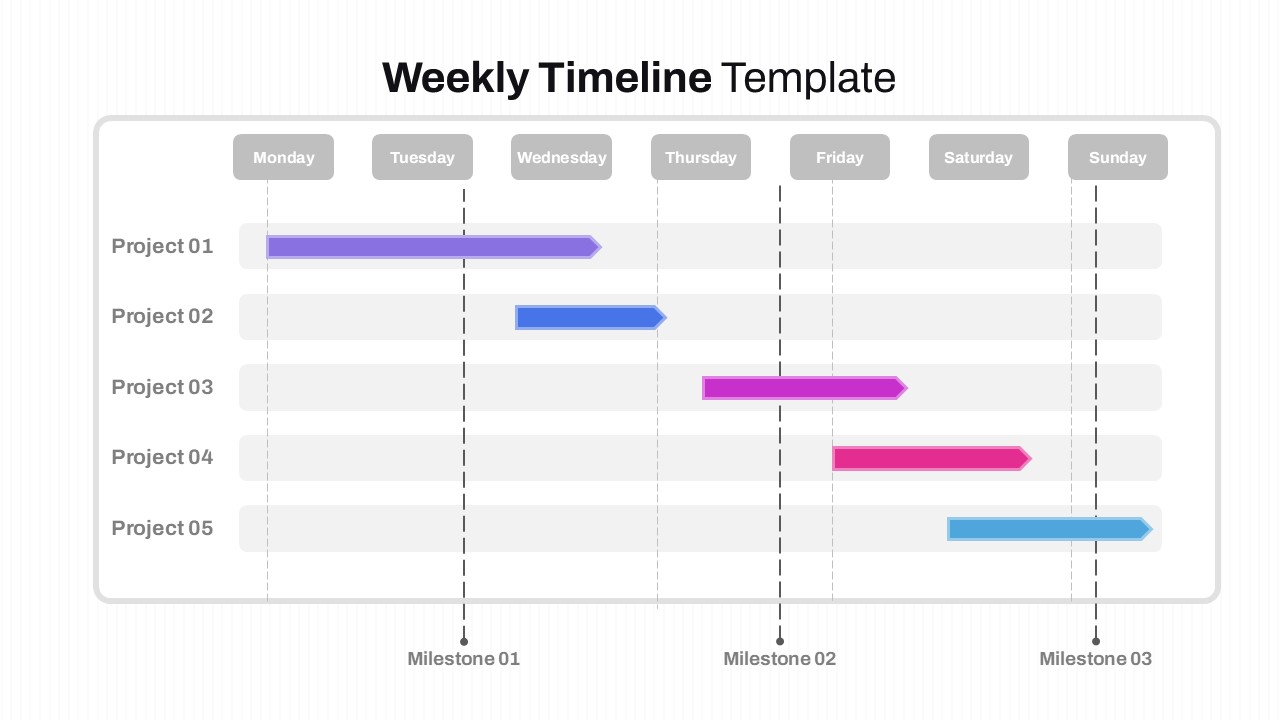
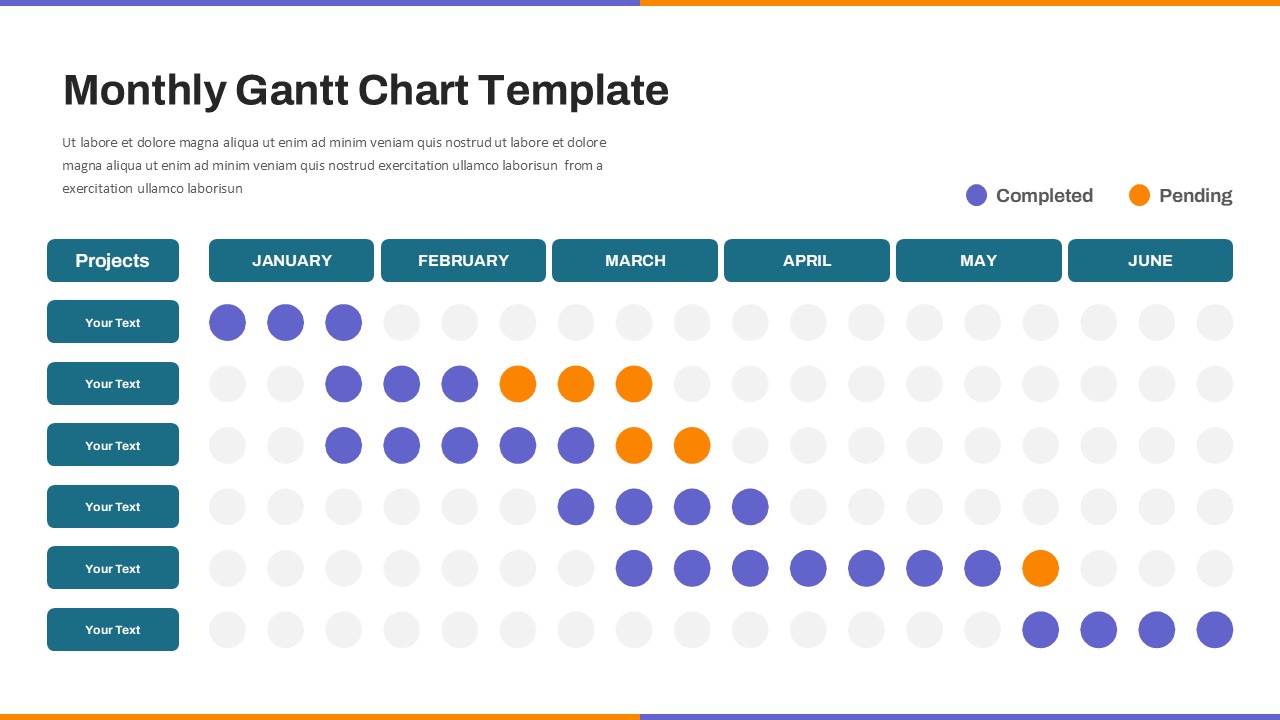
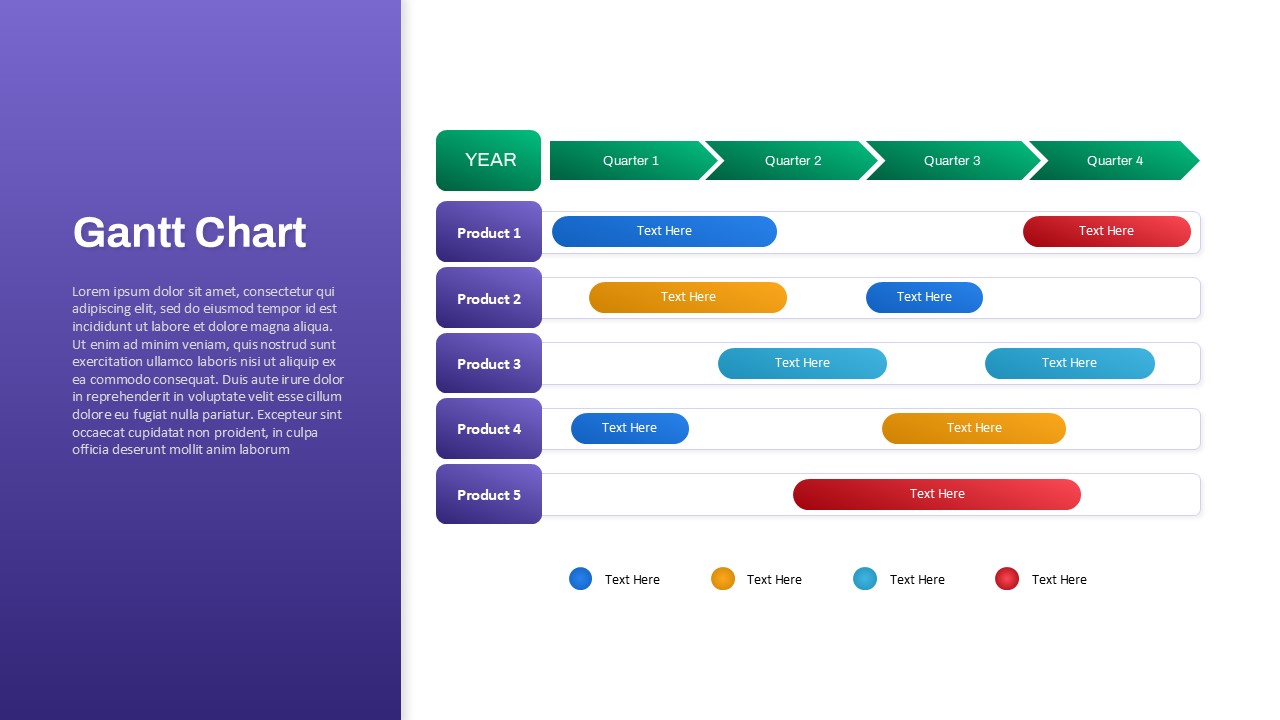
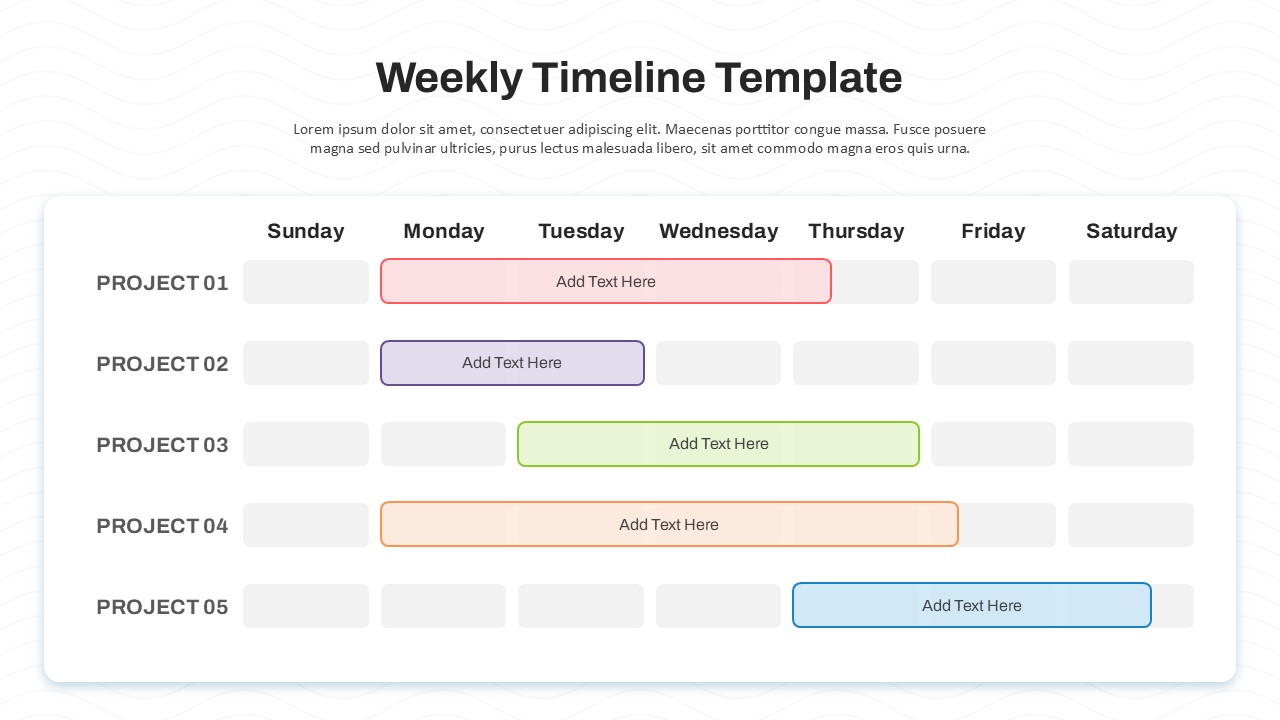
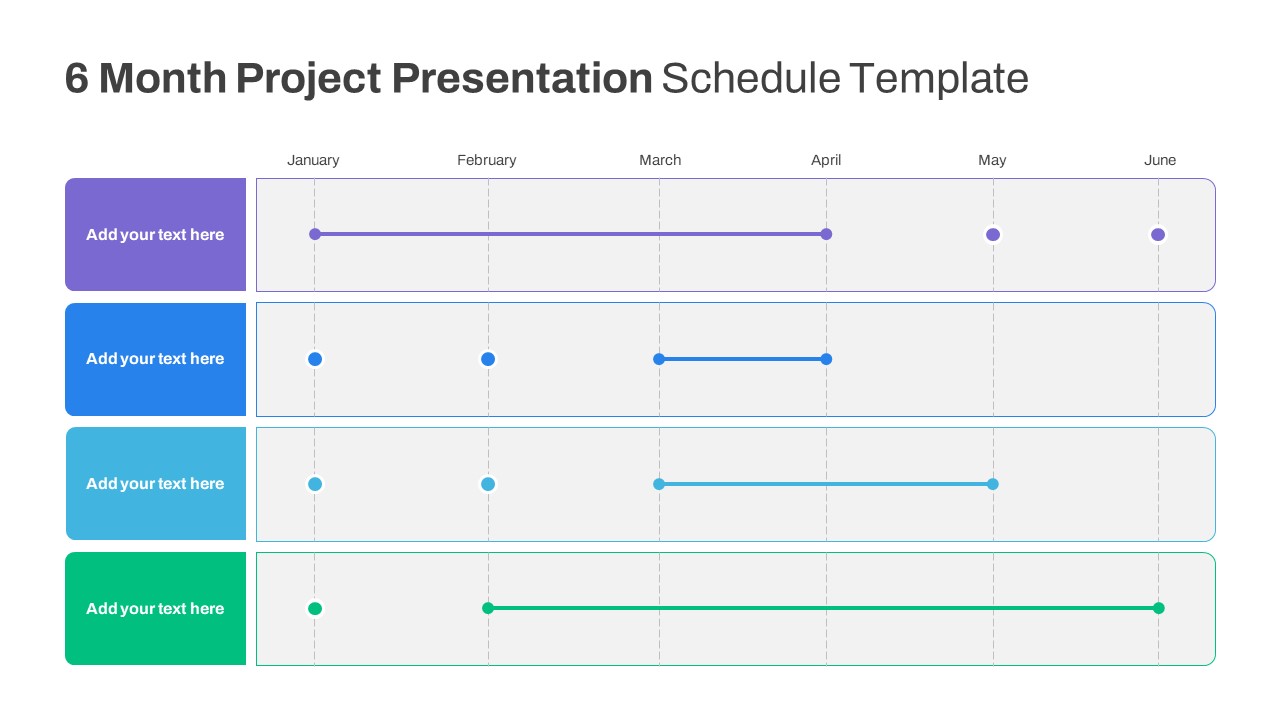
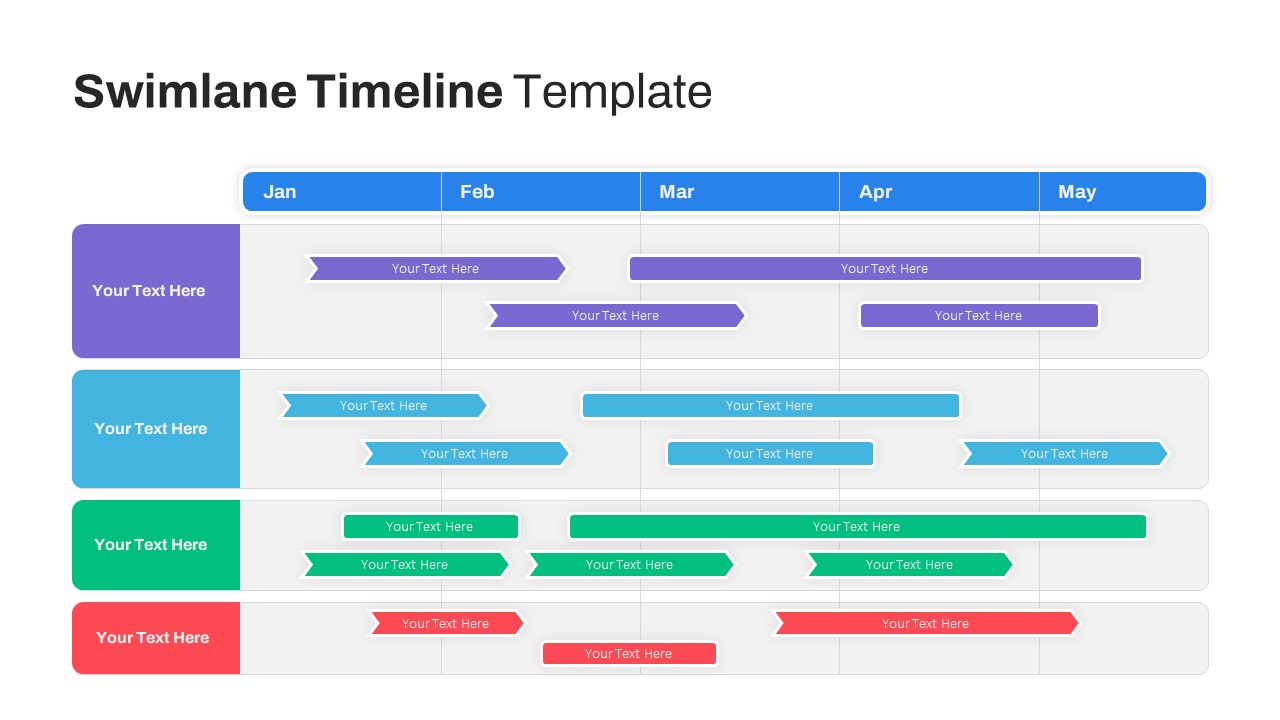
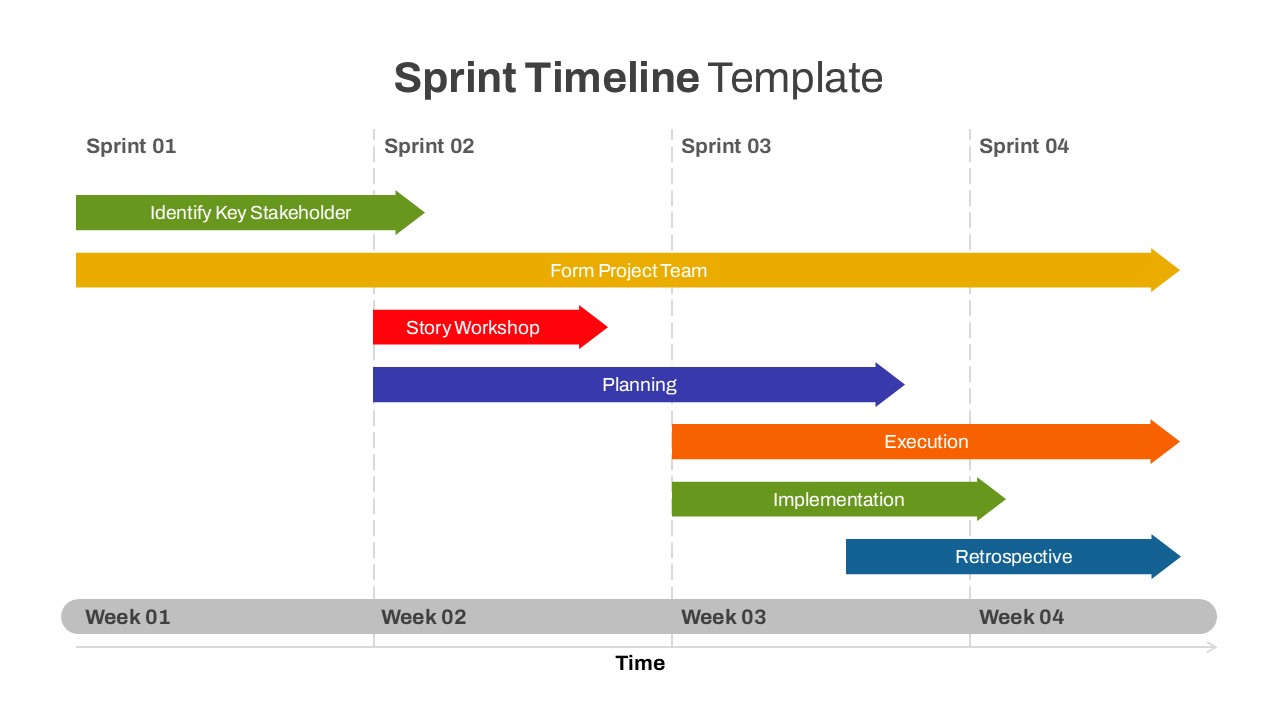
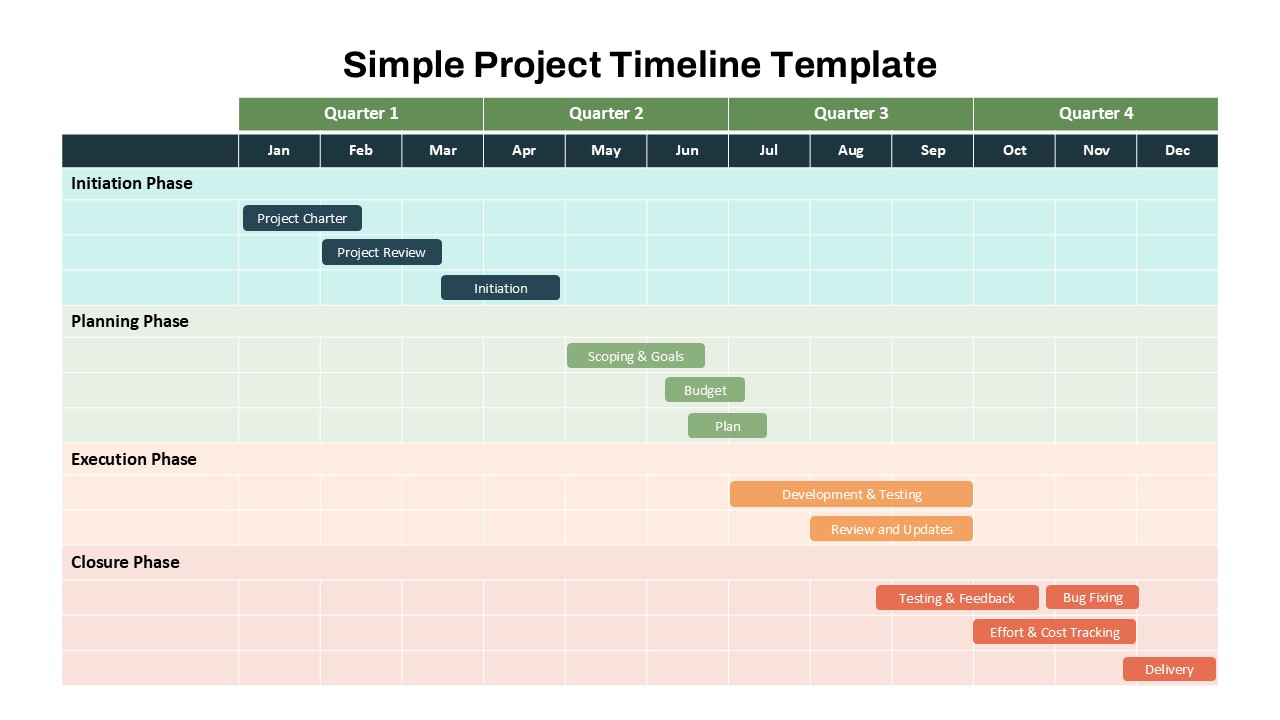
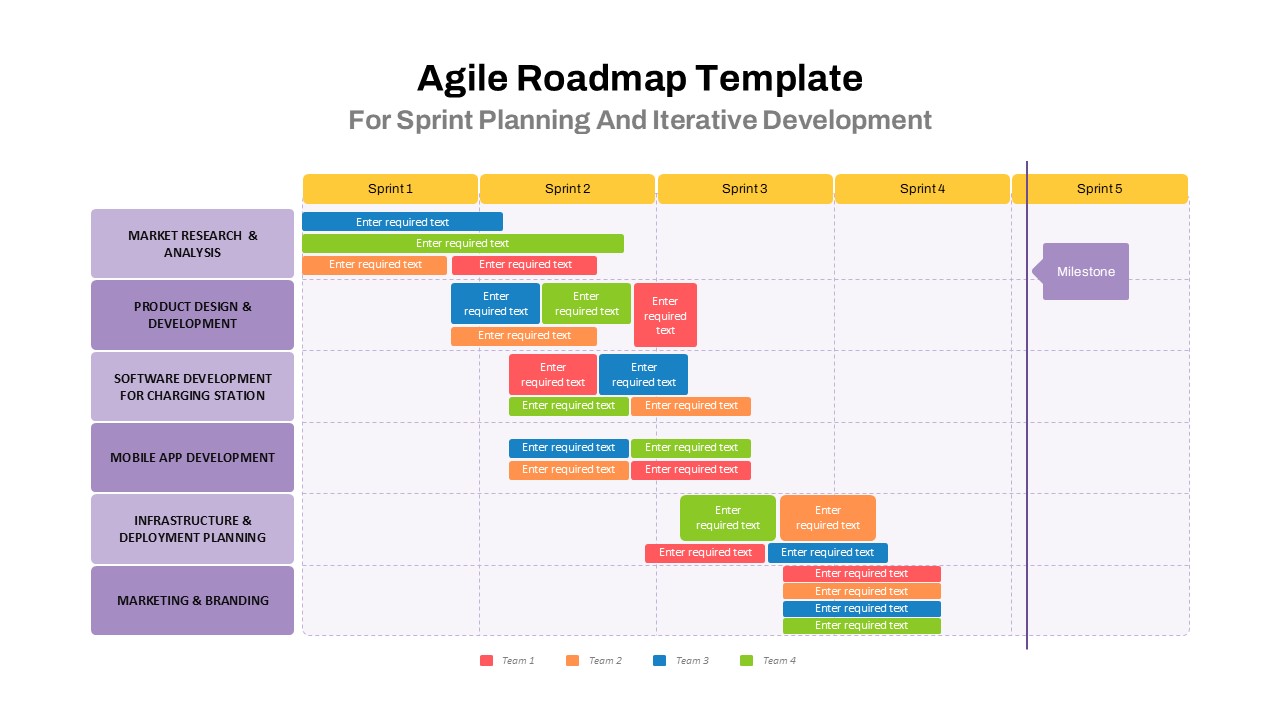
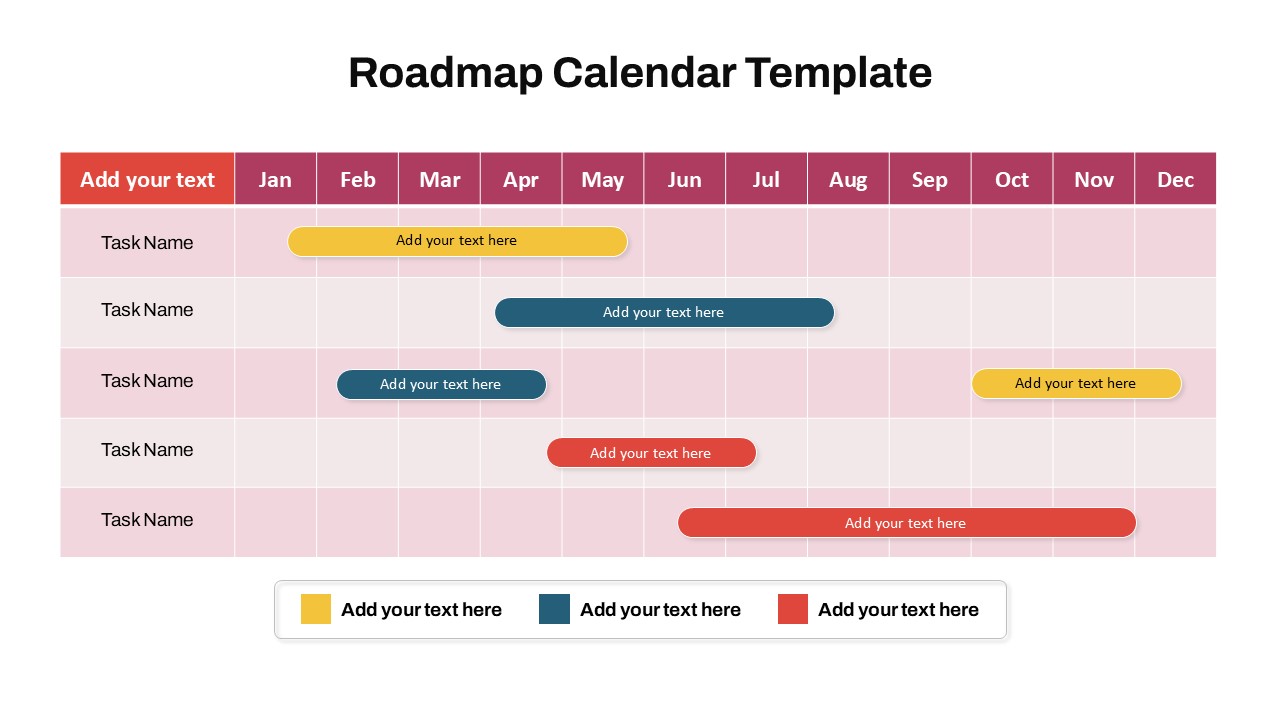
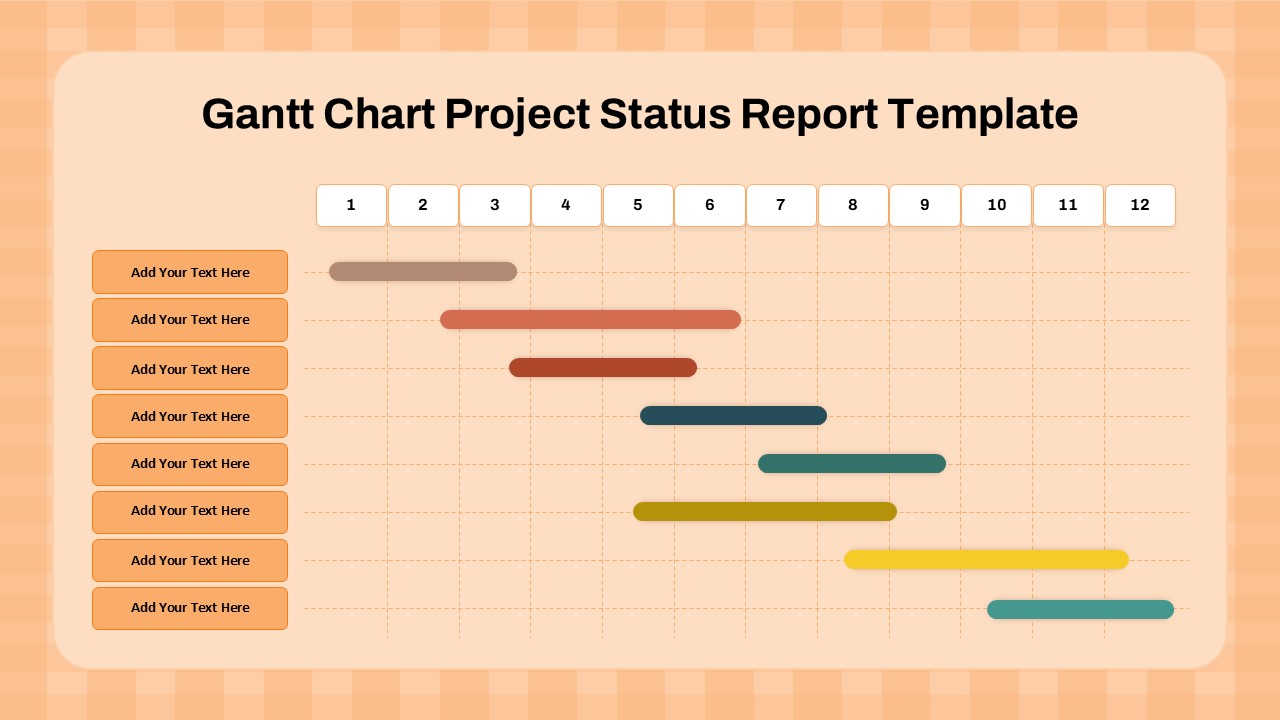
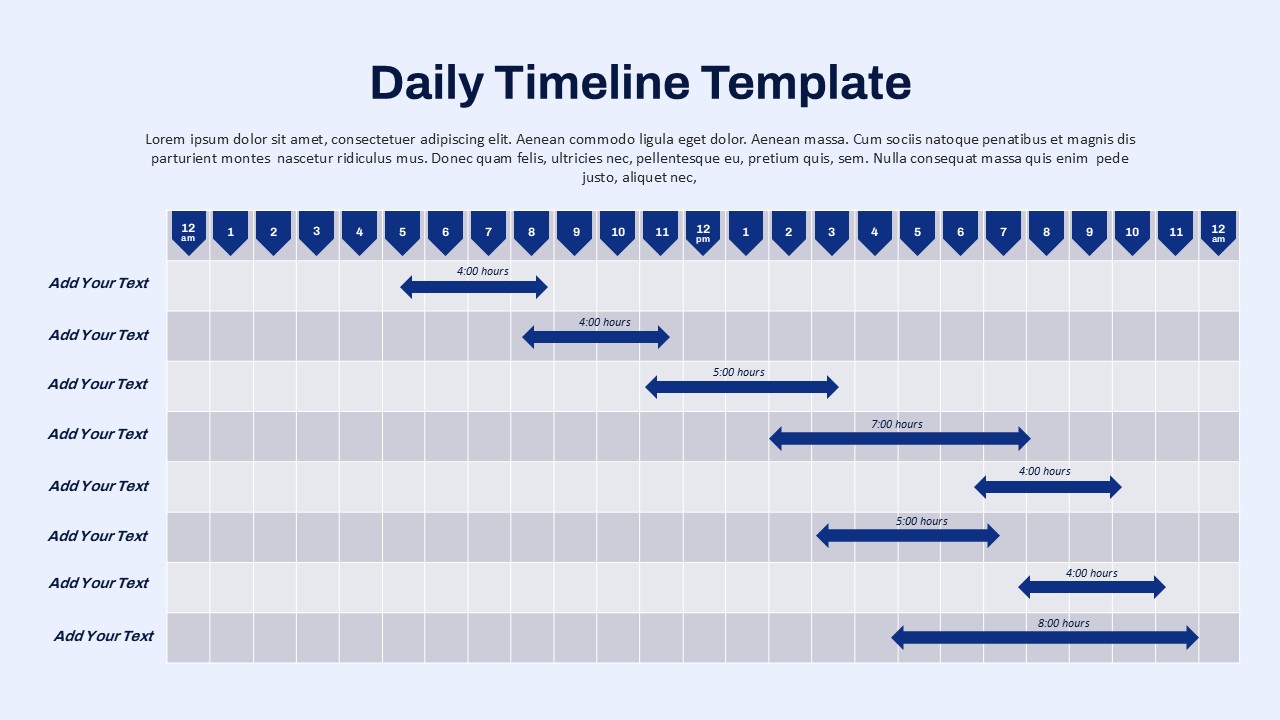
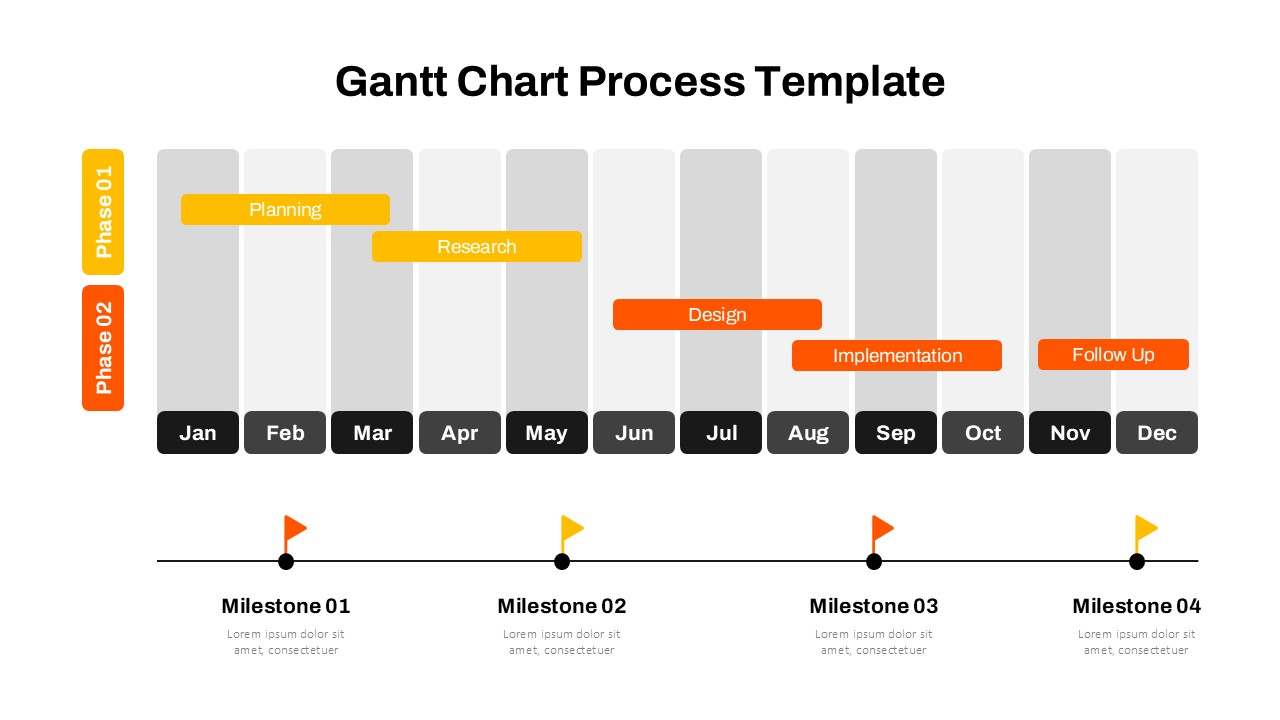
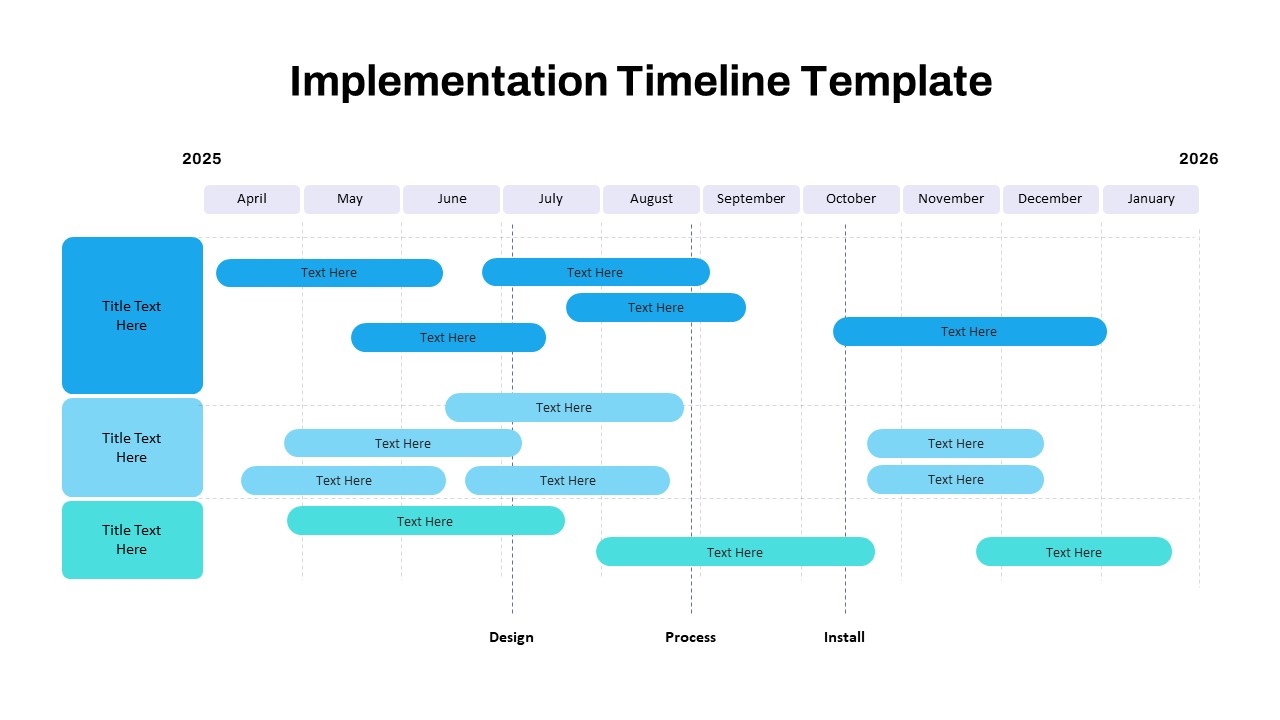
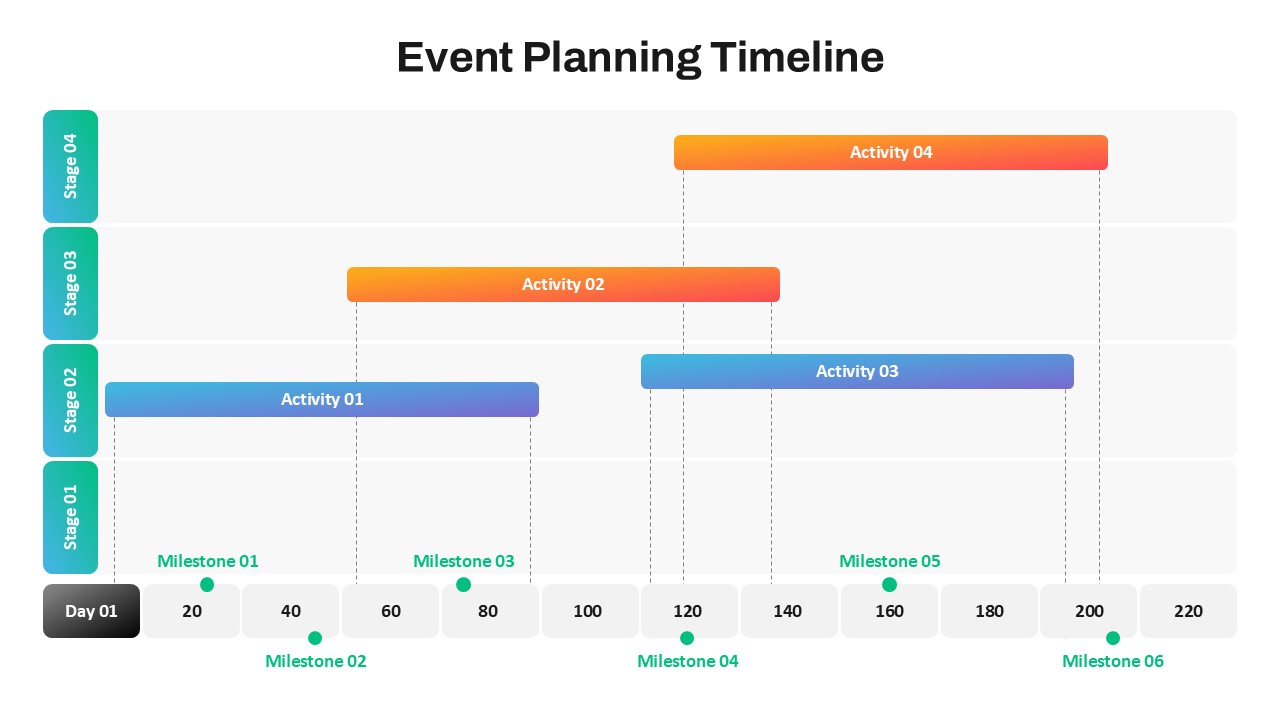
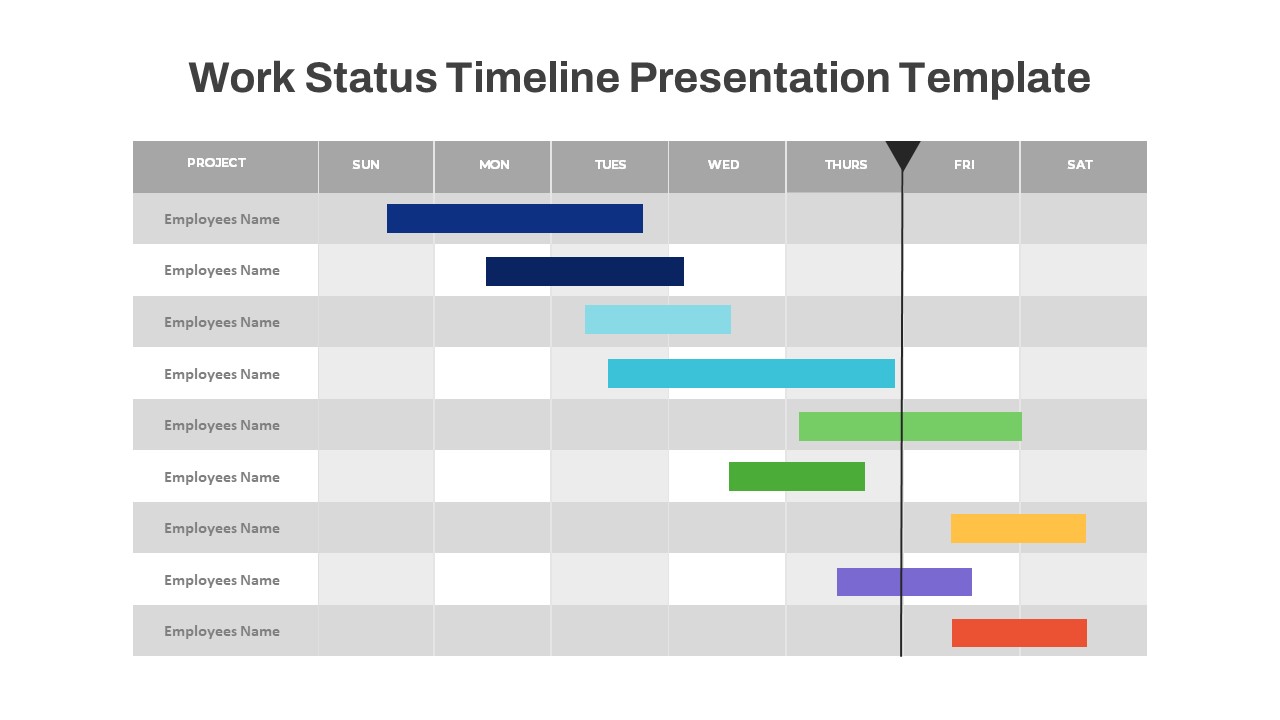
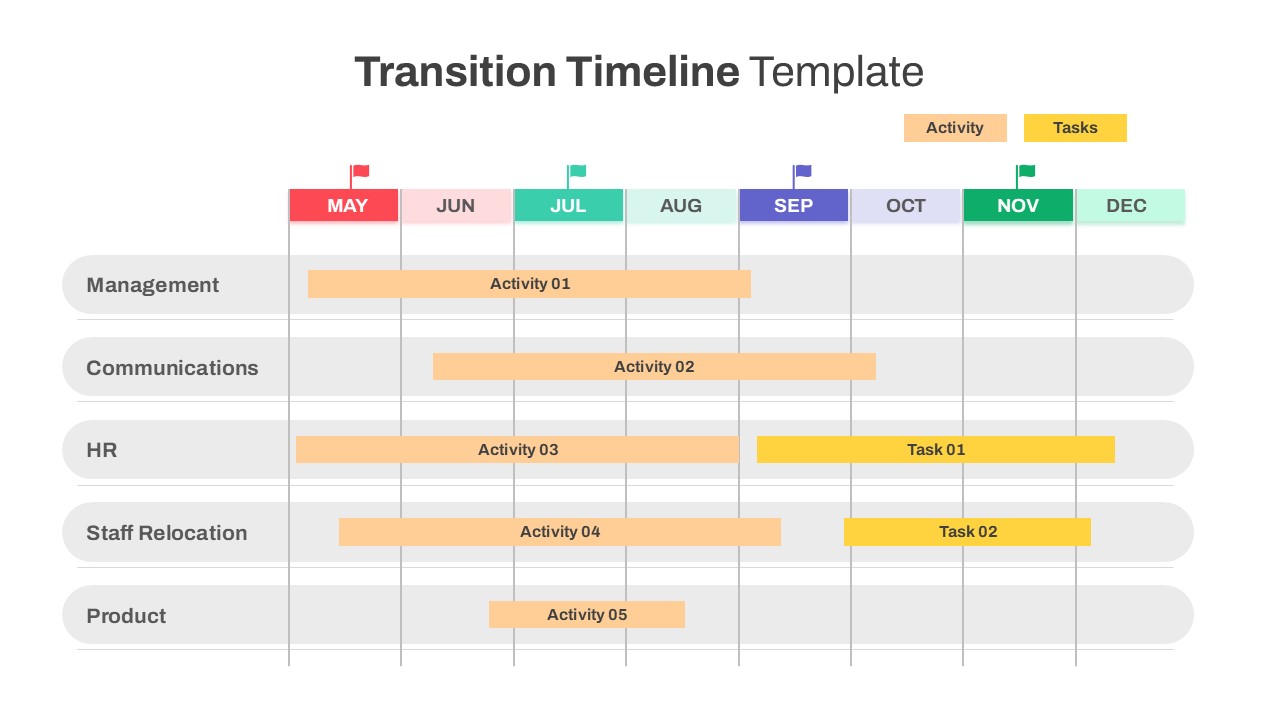
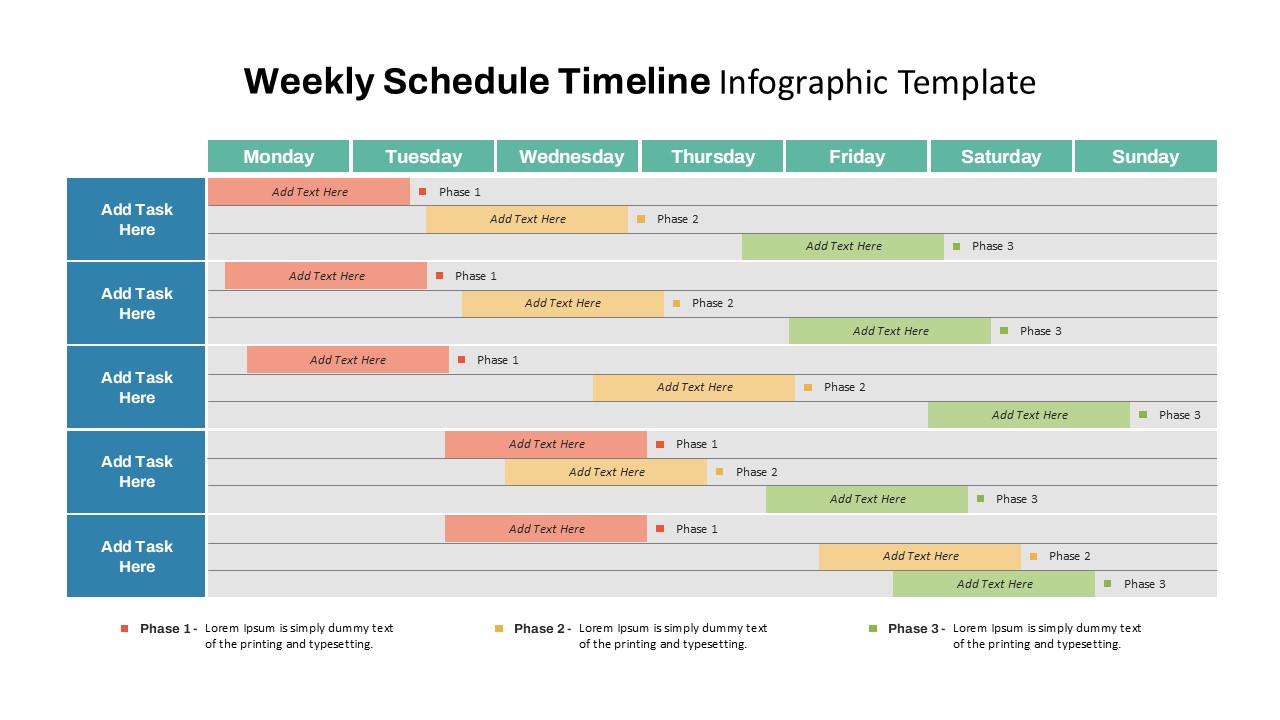
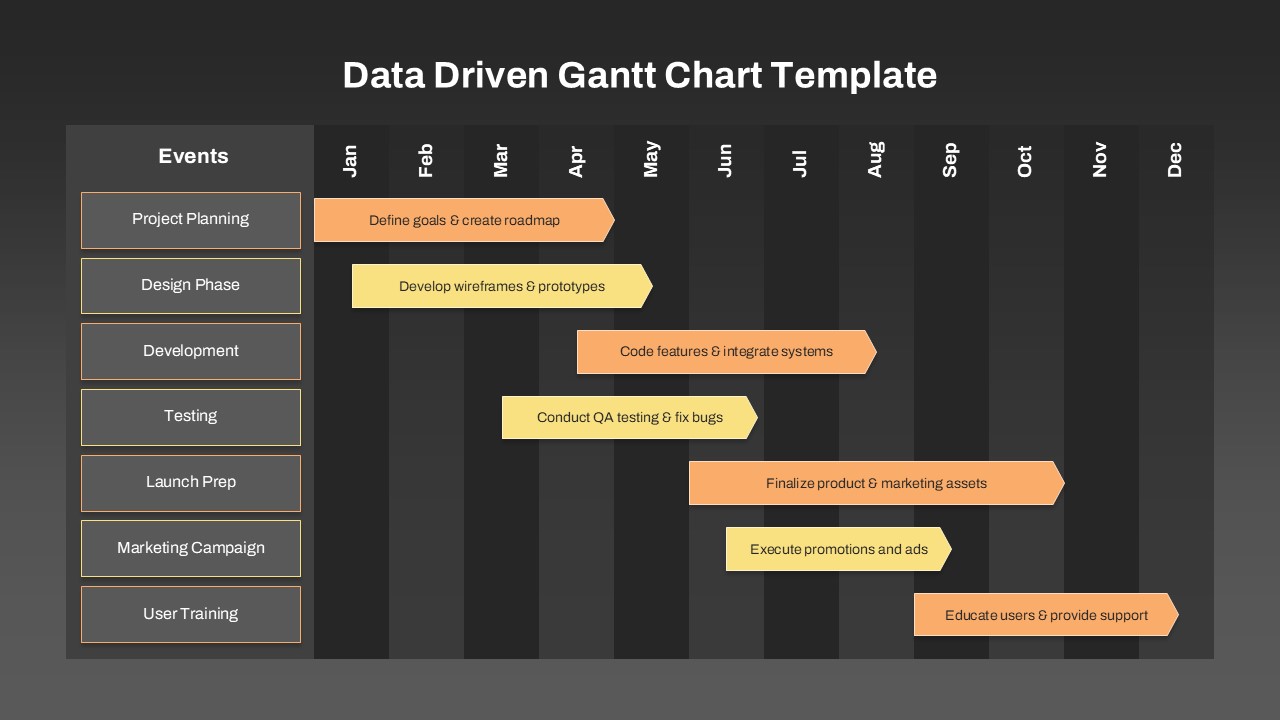
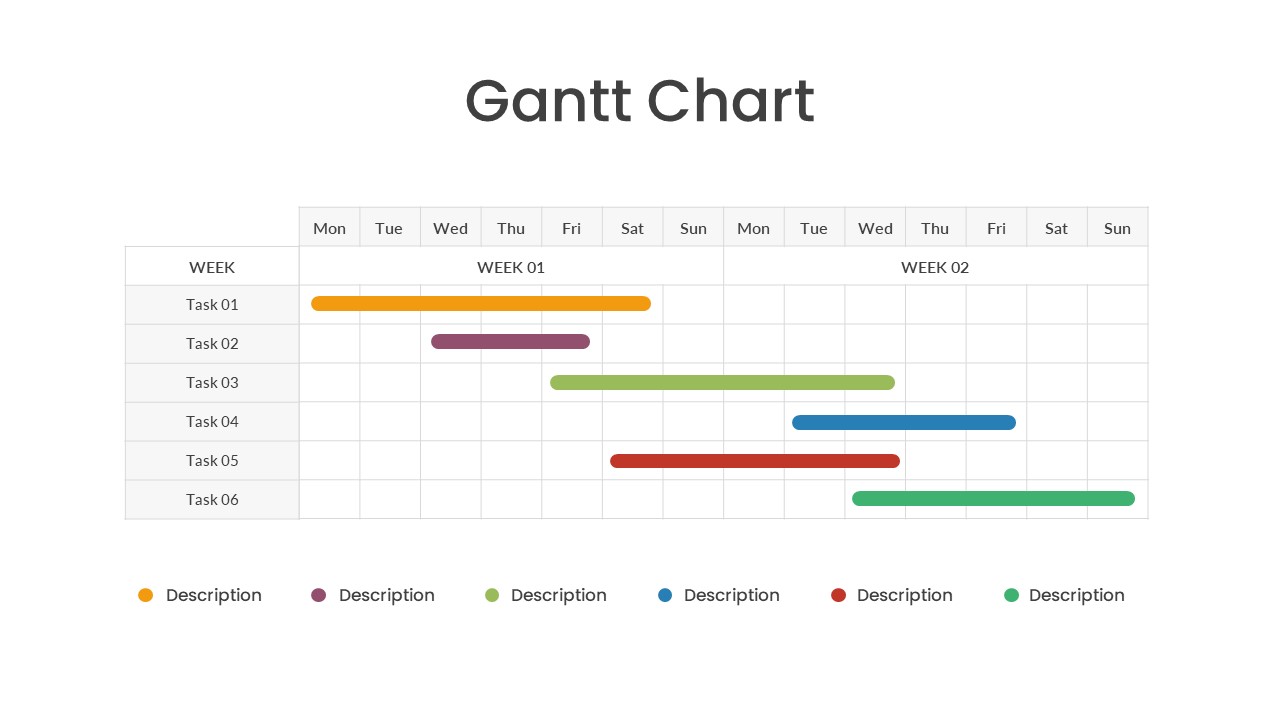
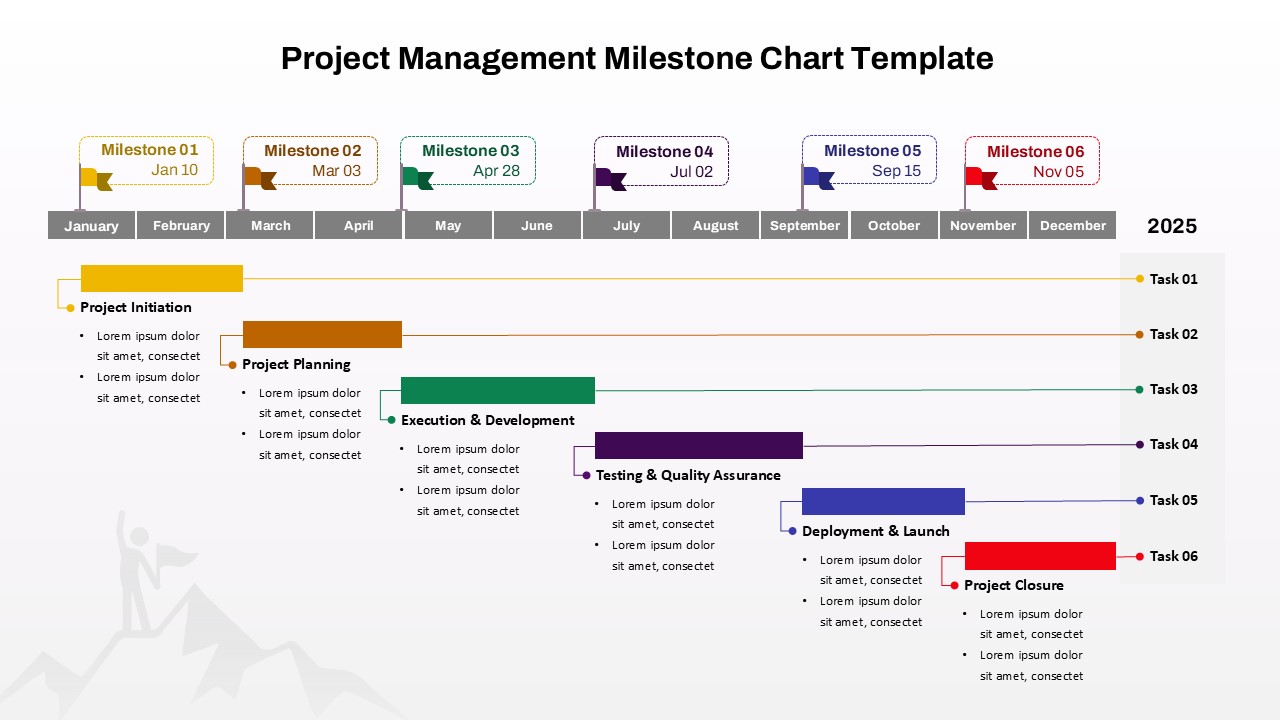
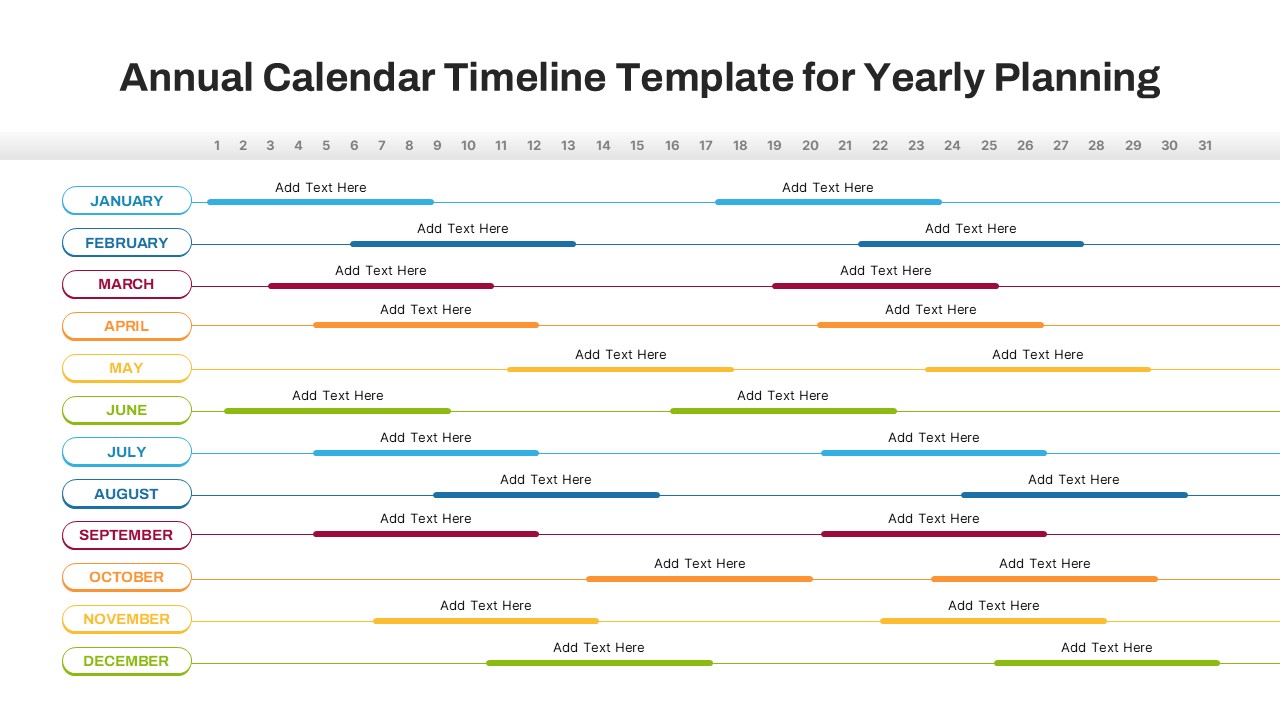
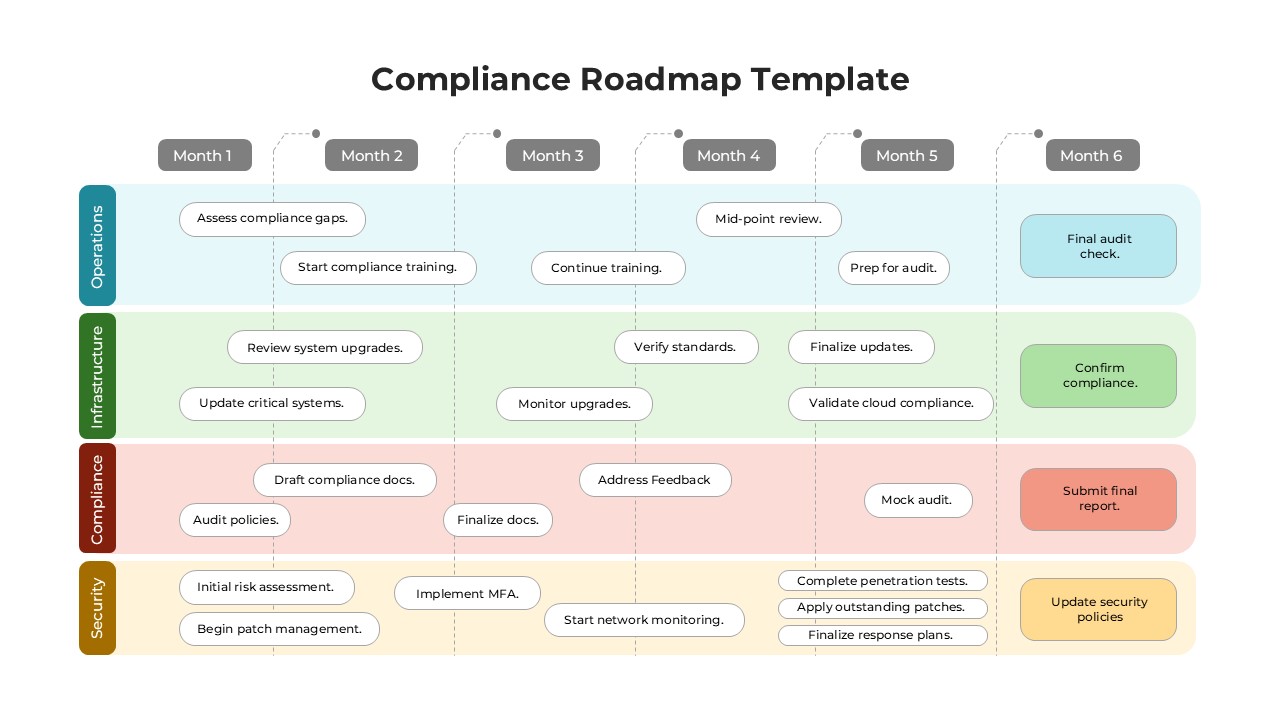
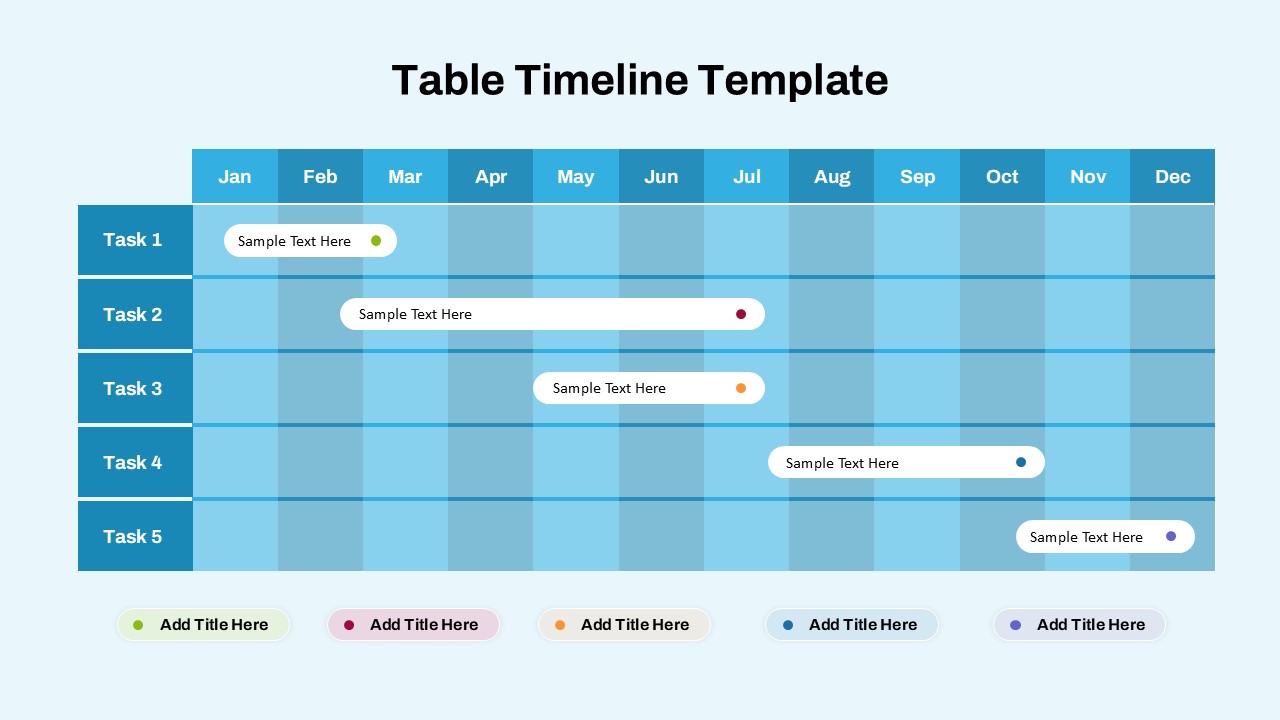
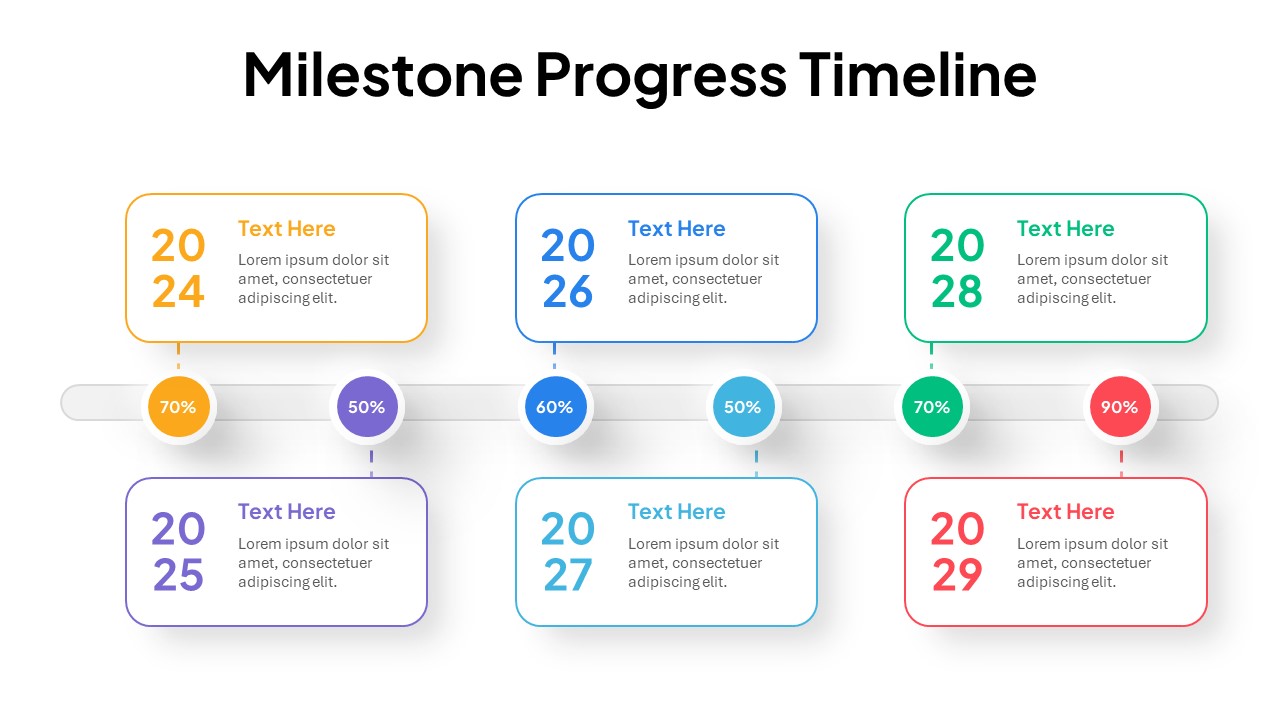
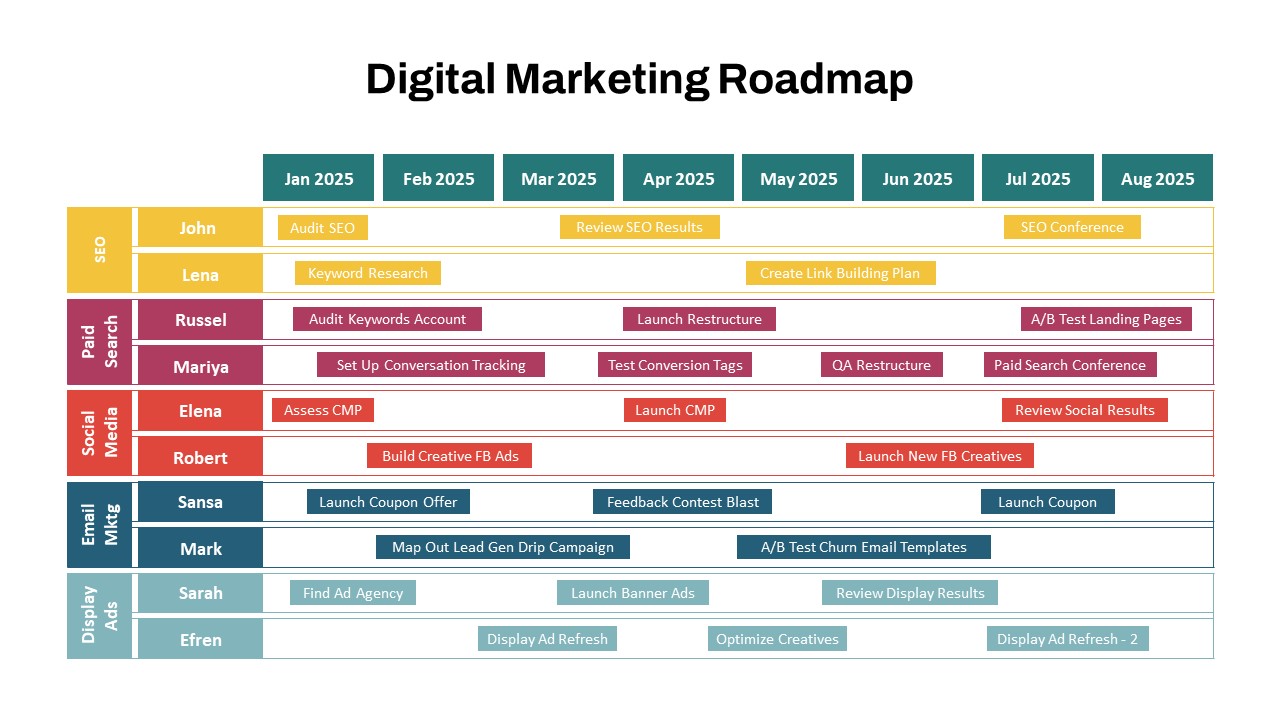
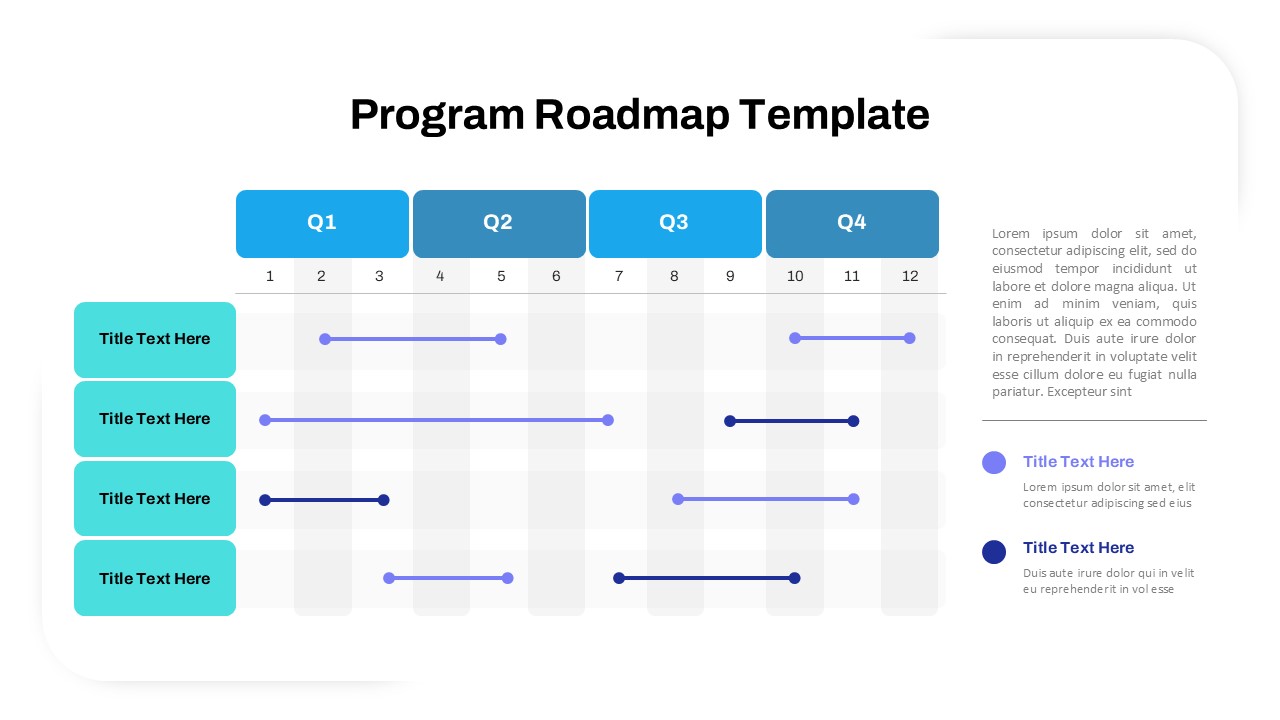
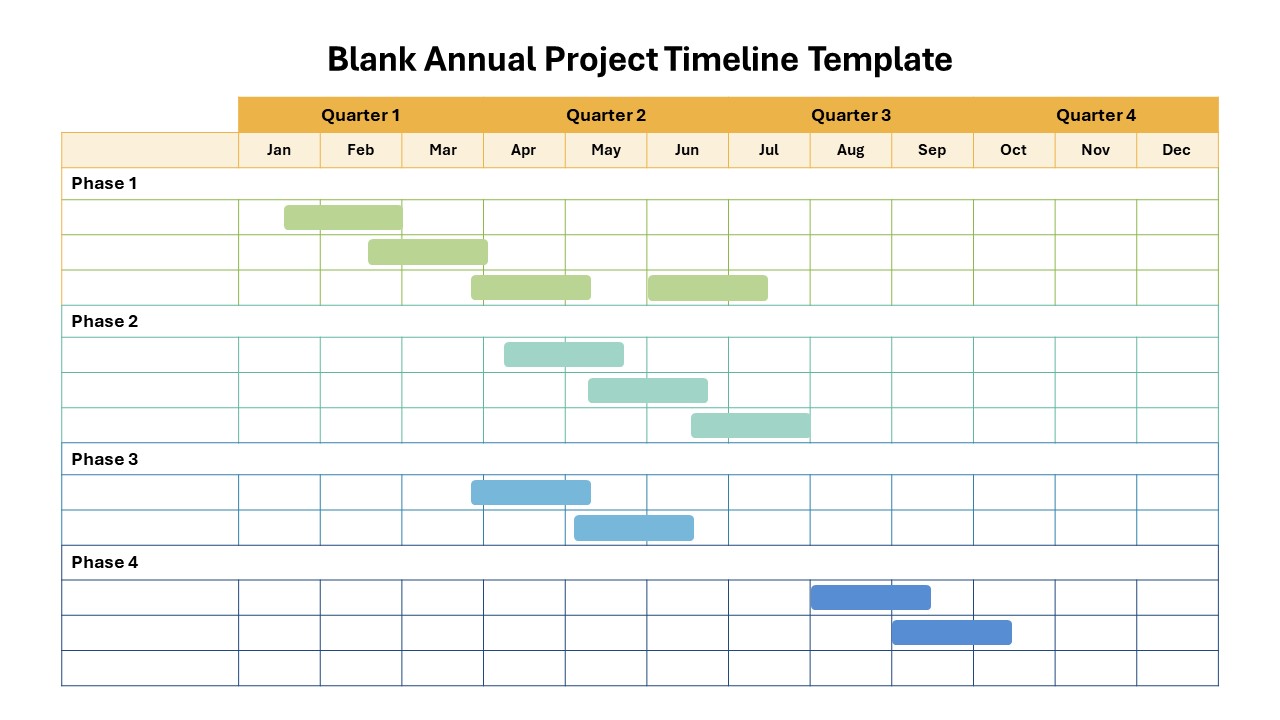
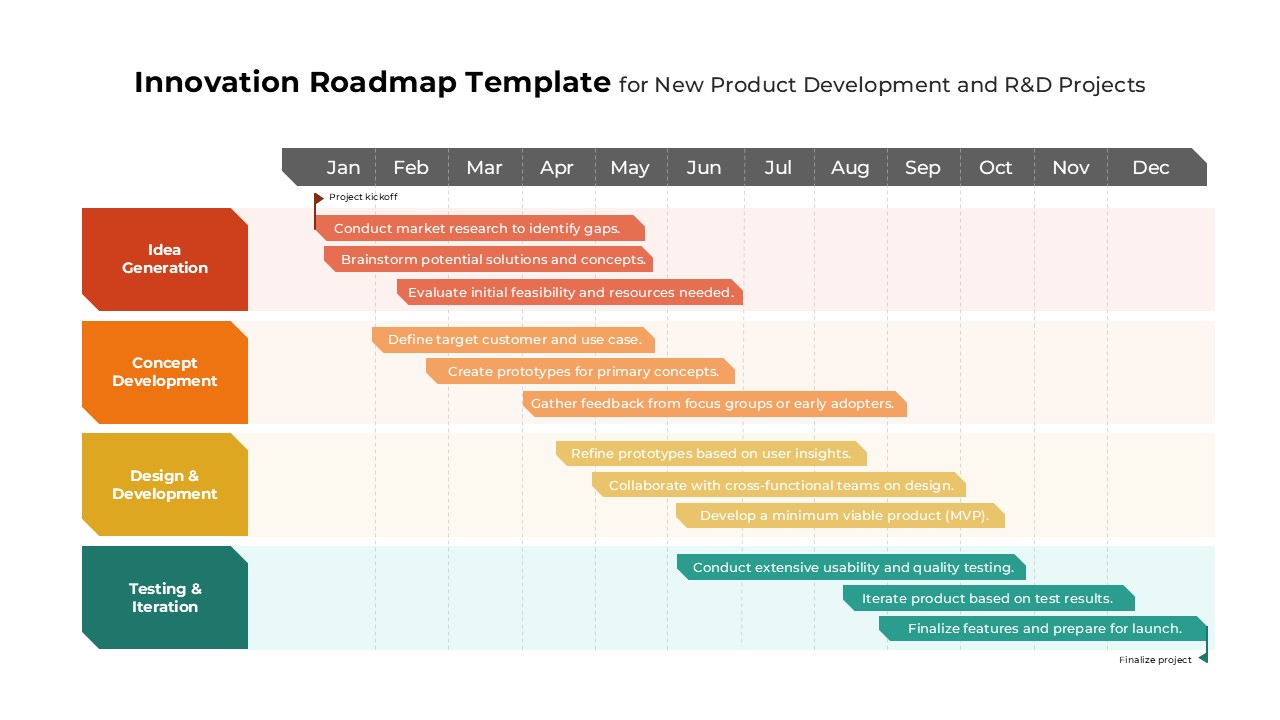
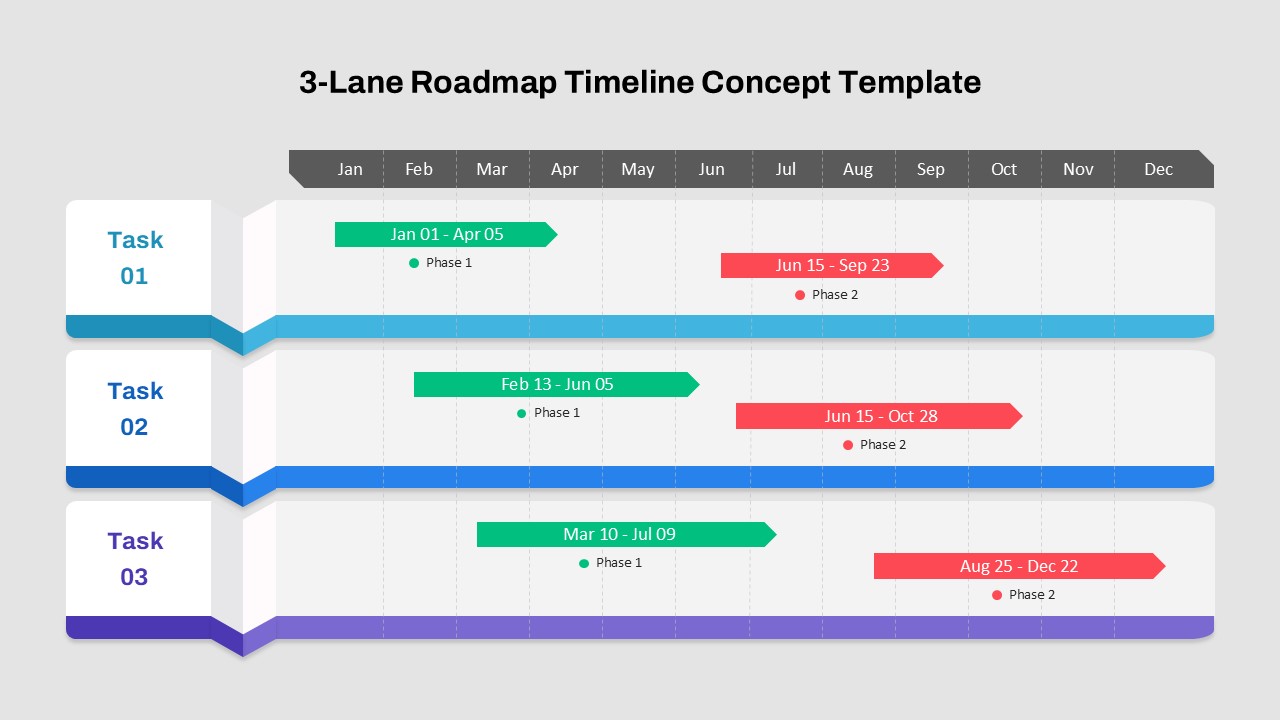
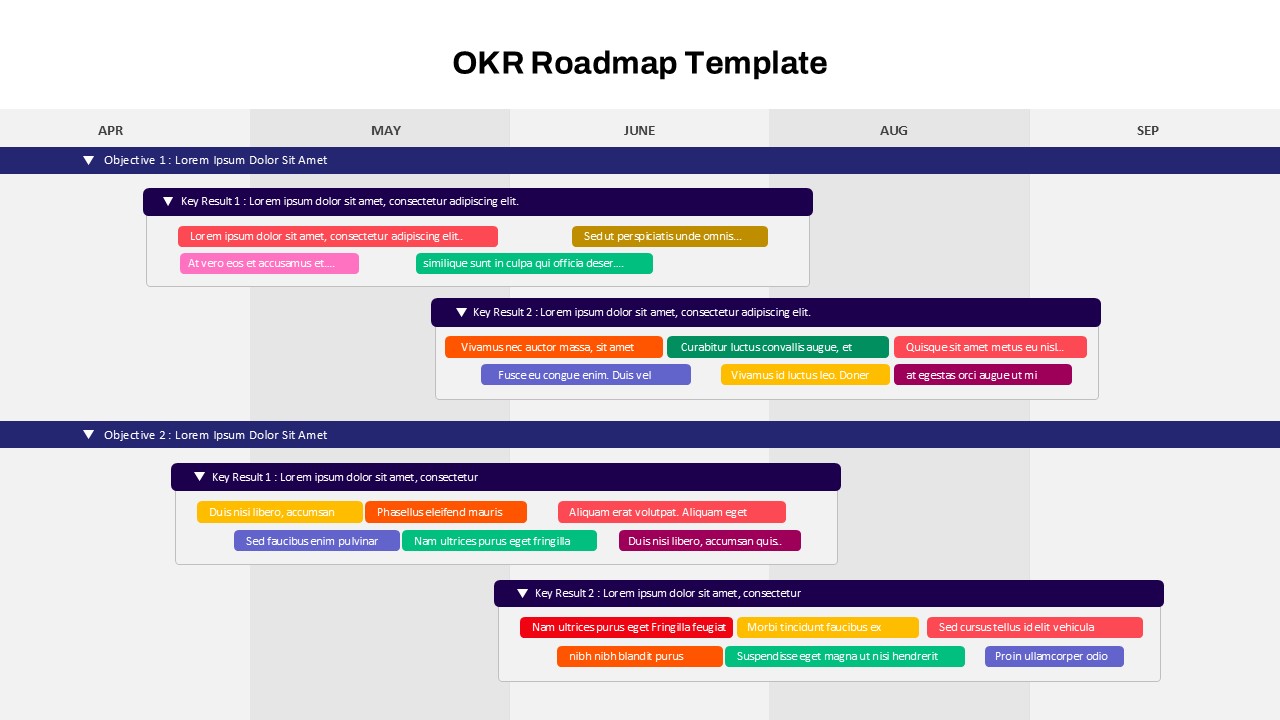
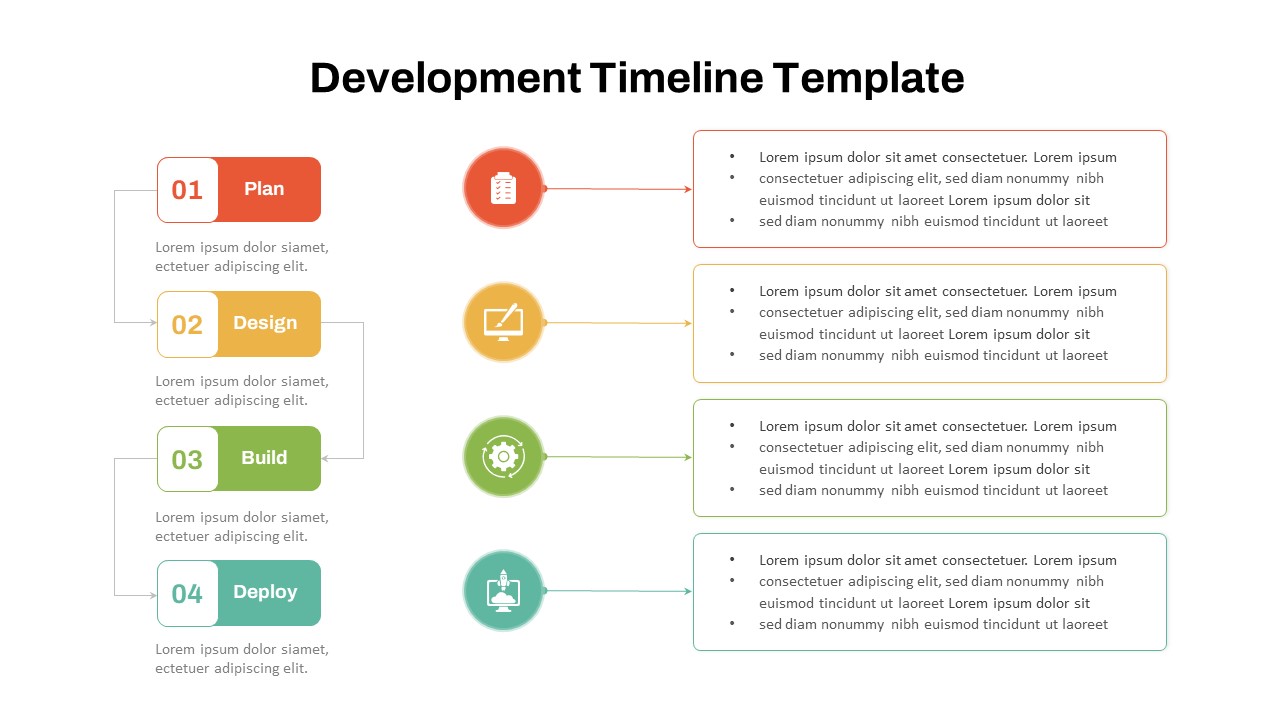
- Project Timeline – Gantt-style visual mapping tasks across quarterly segments
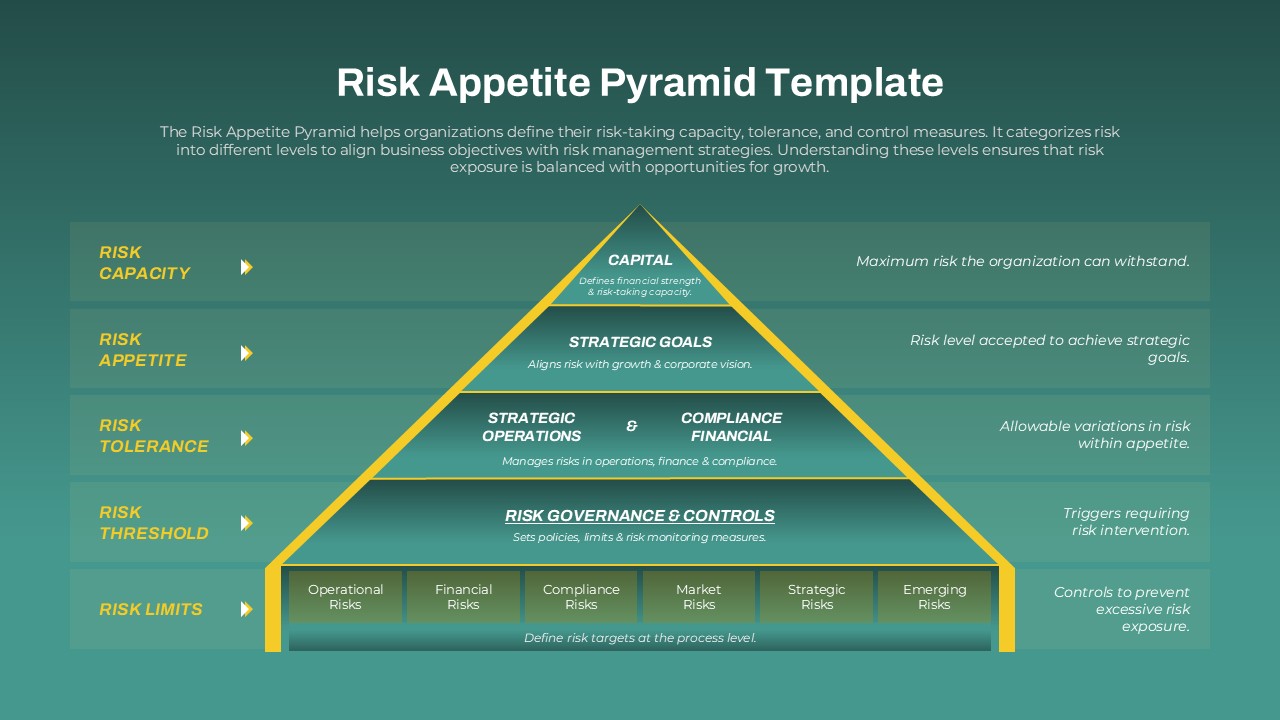
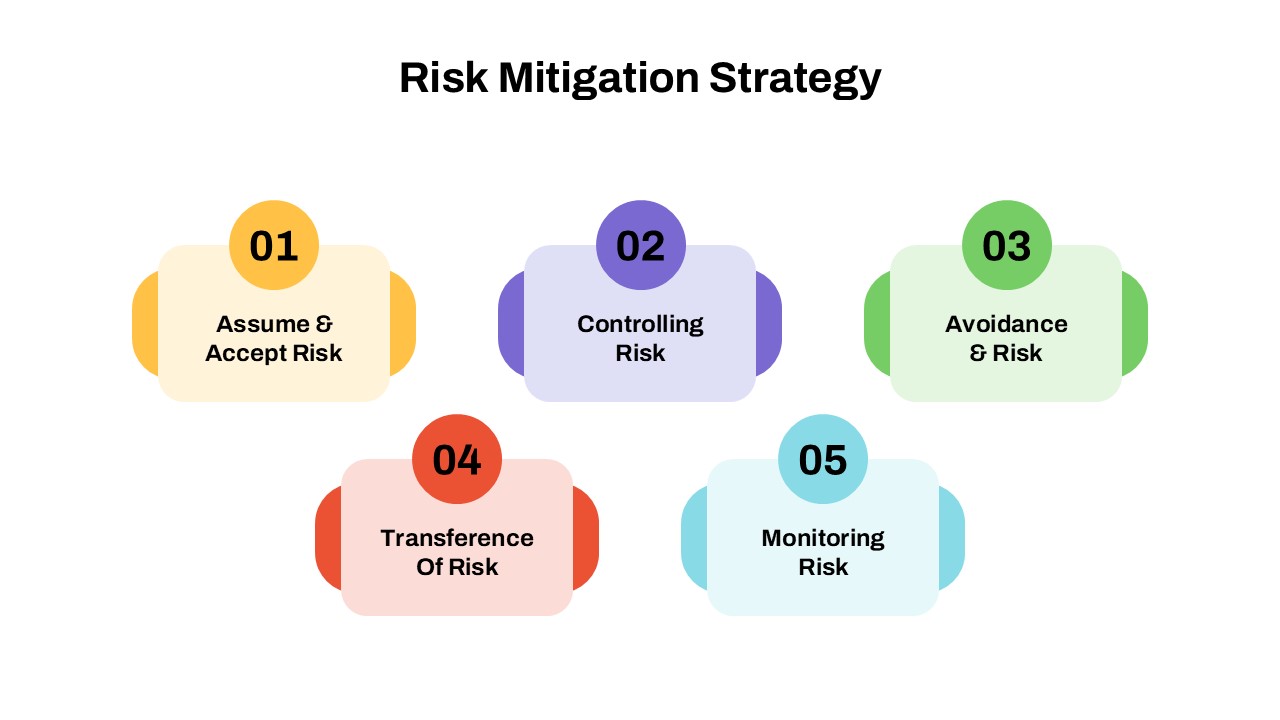
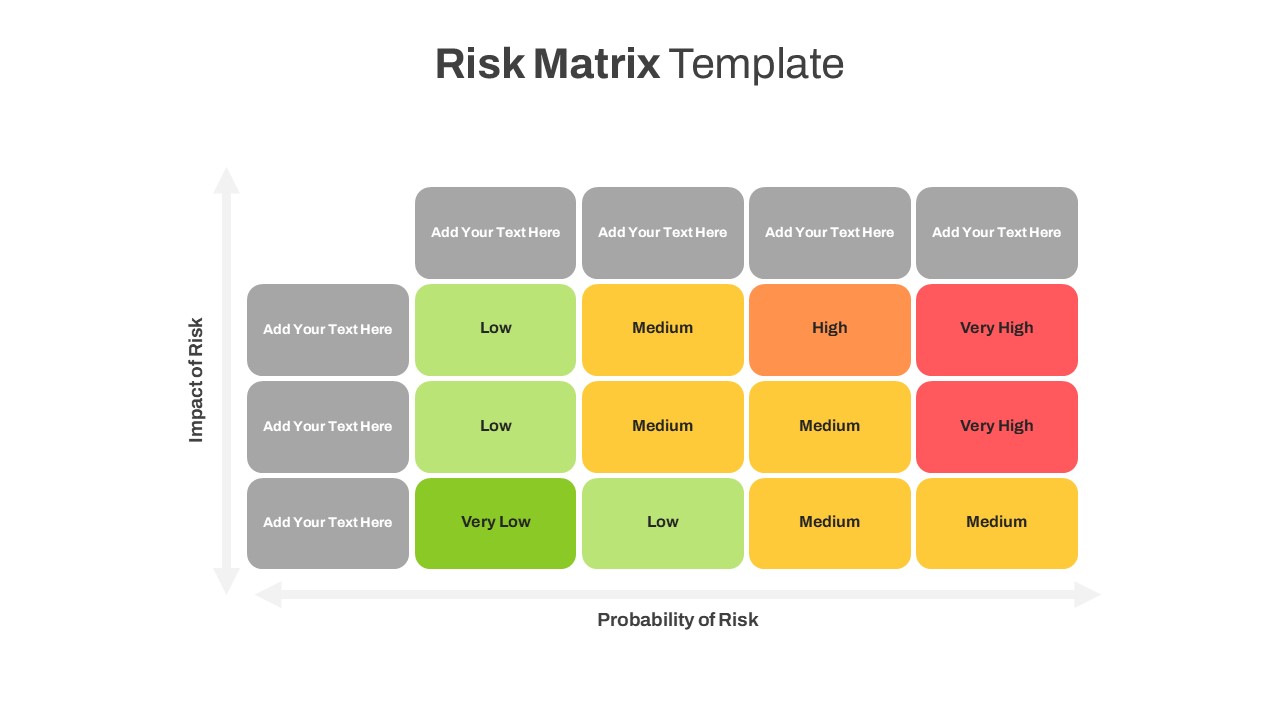
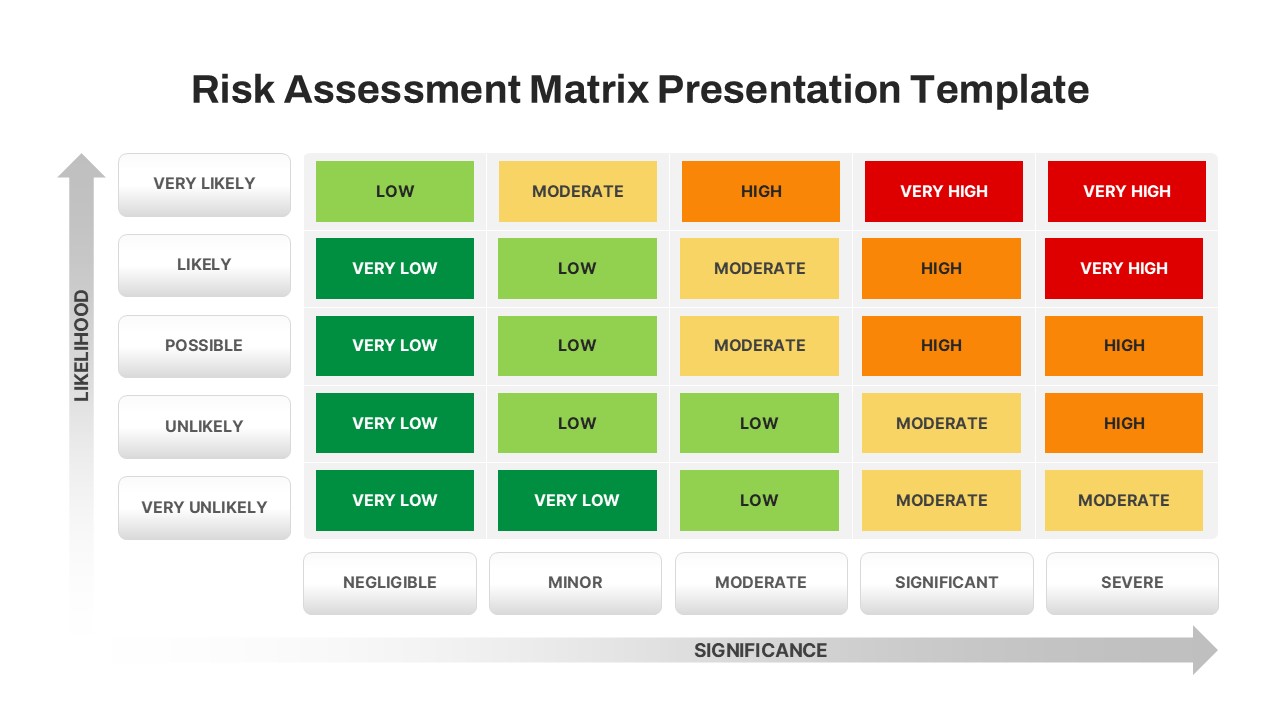
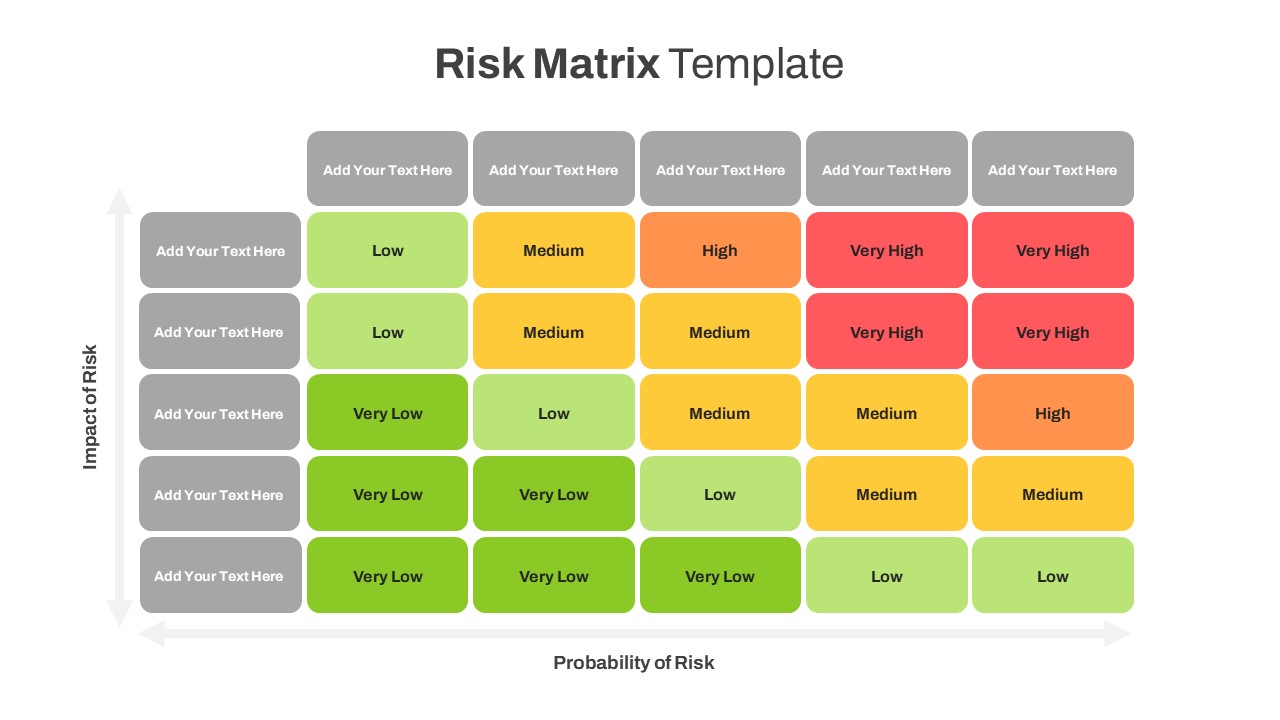
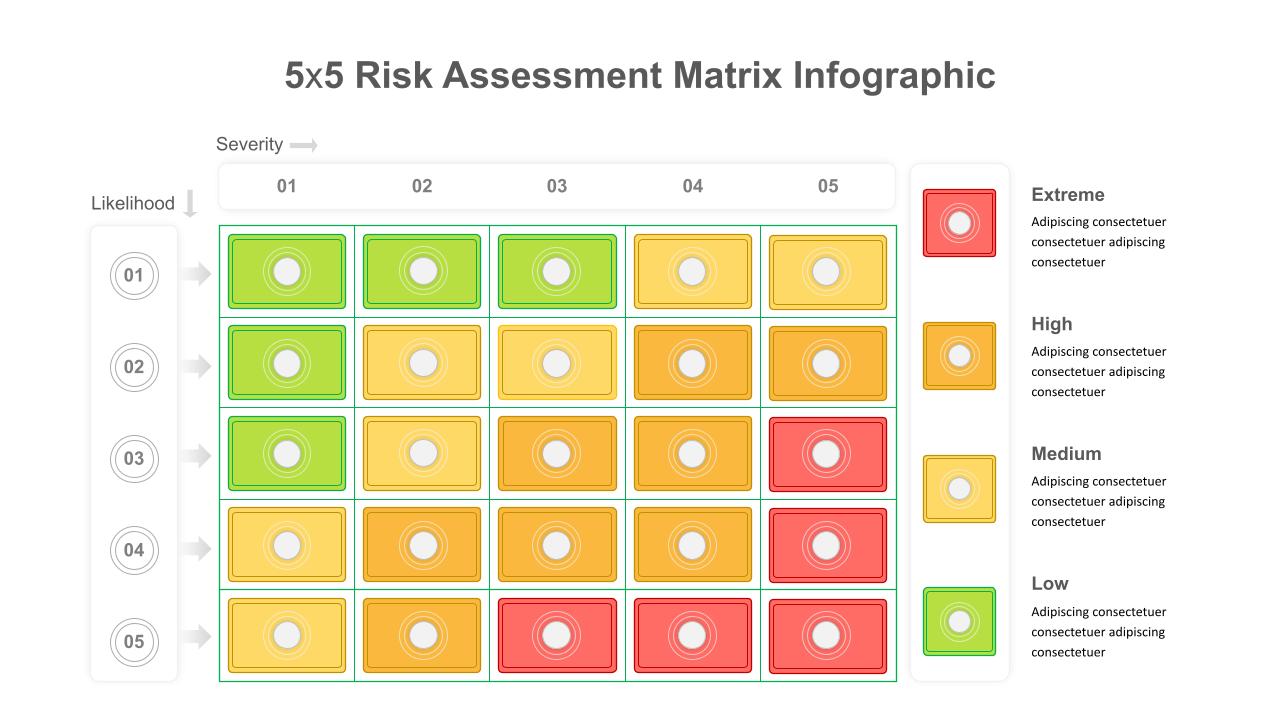
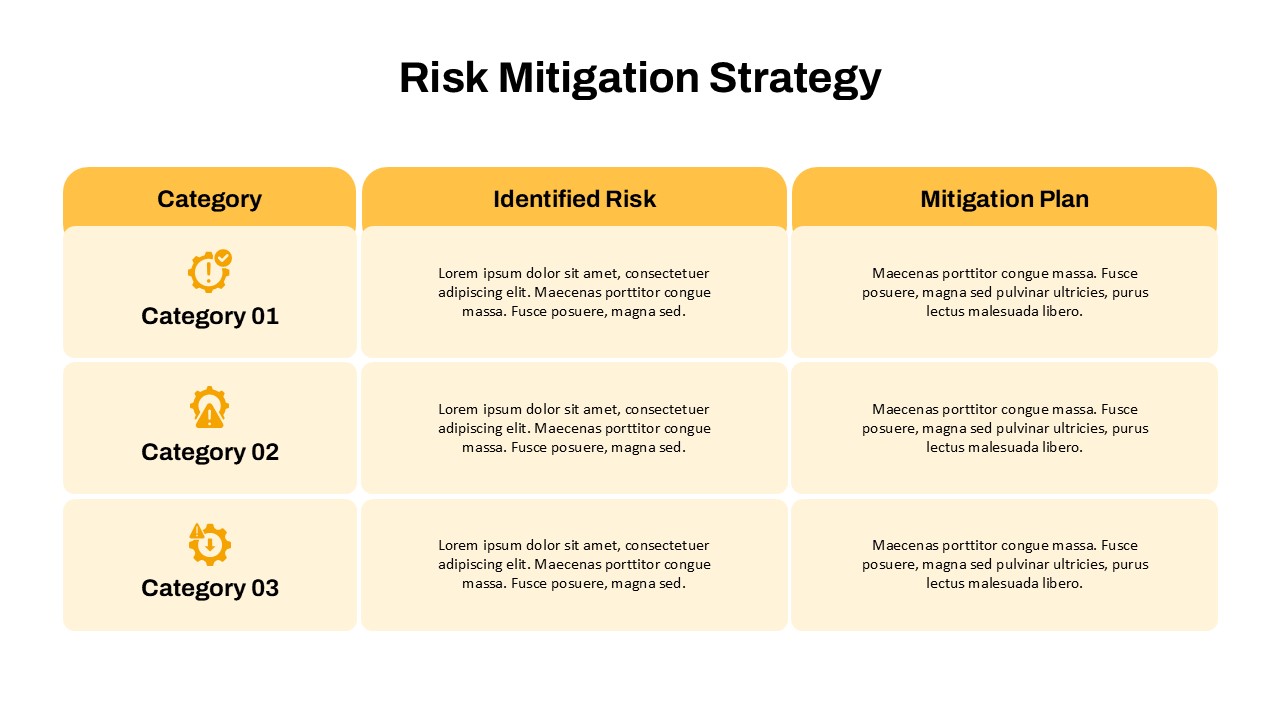
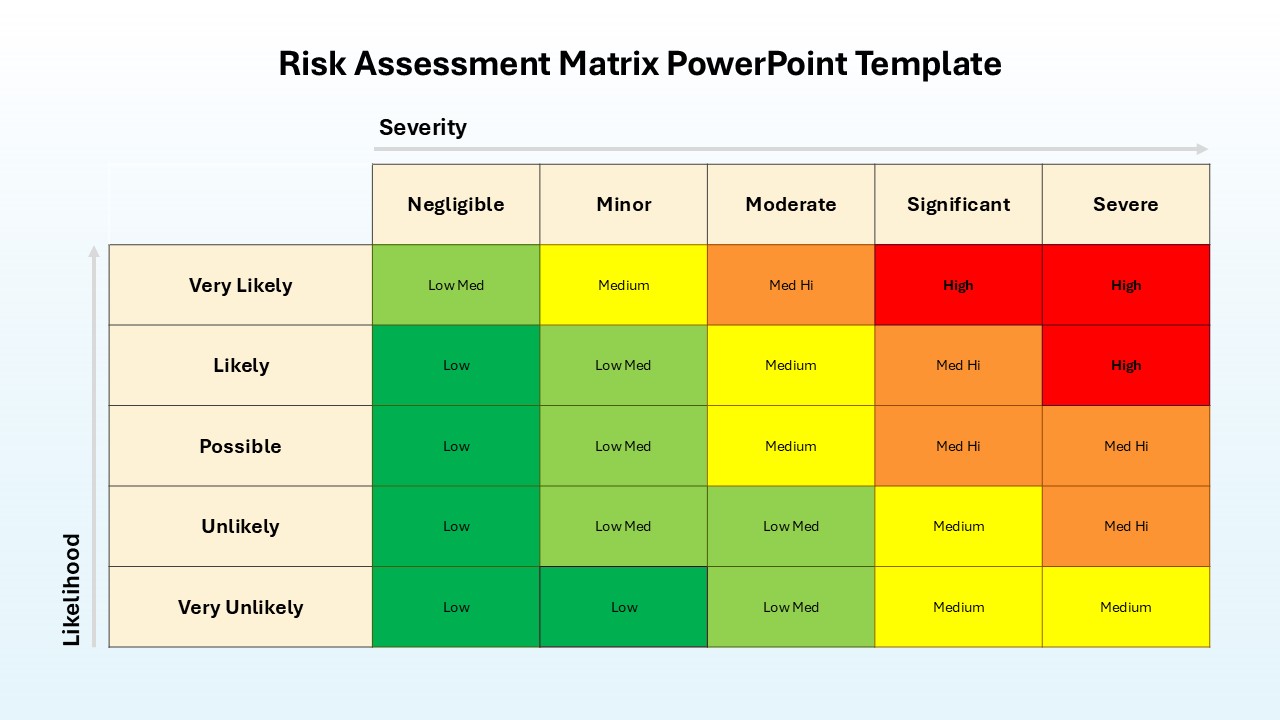
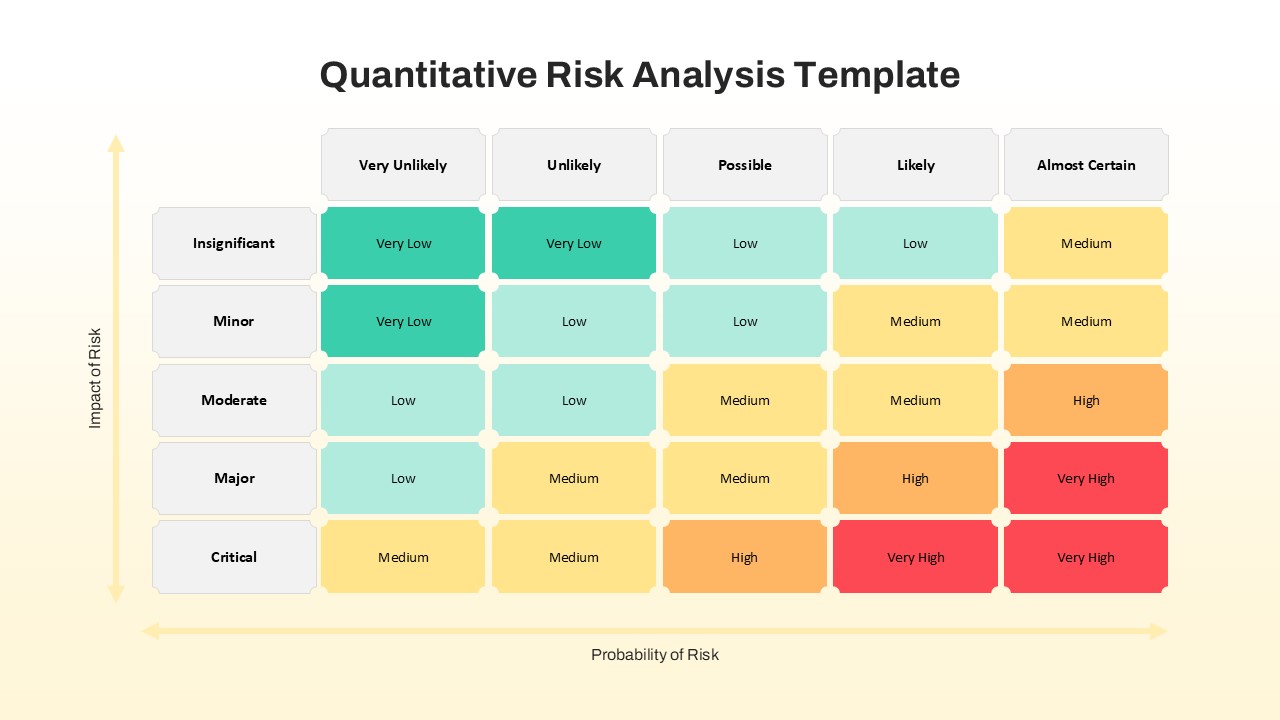
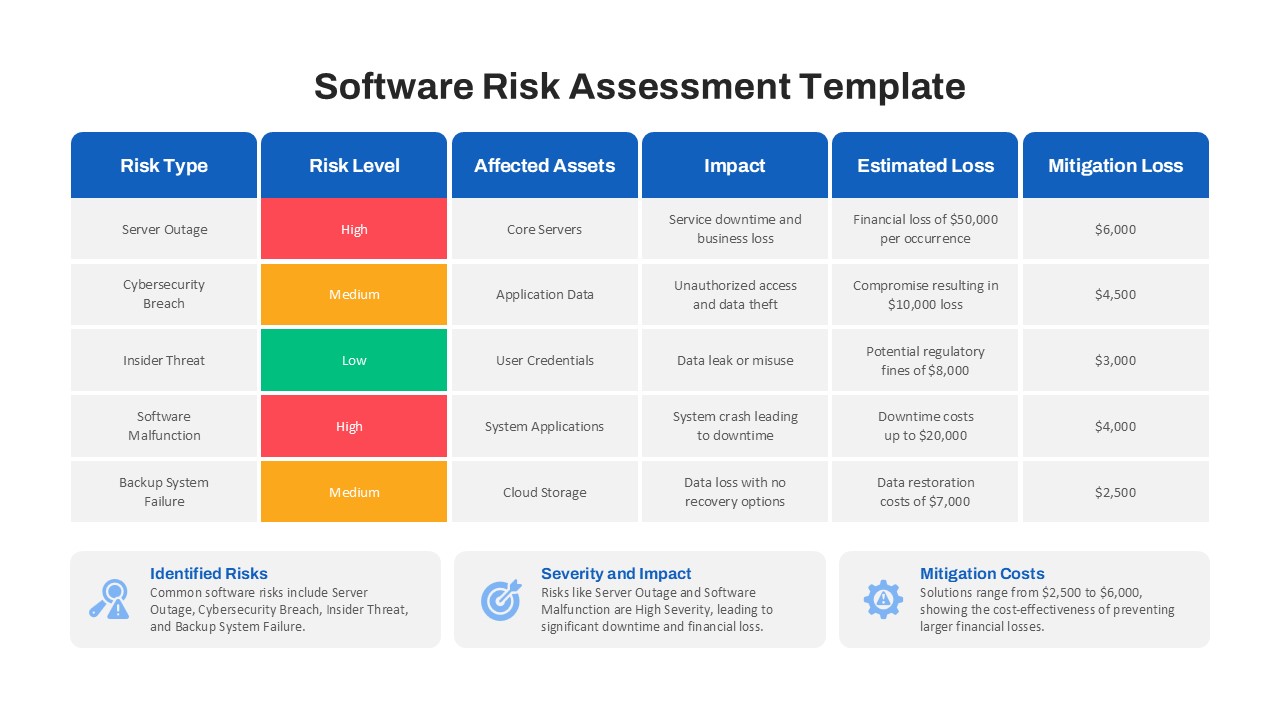
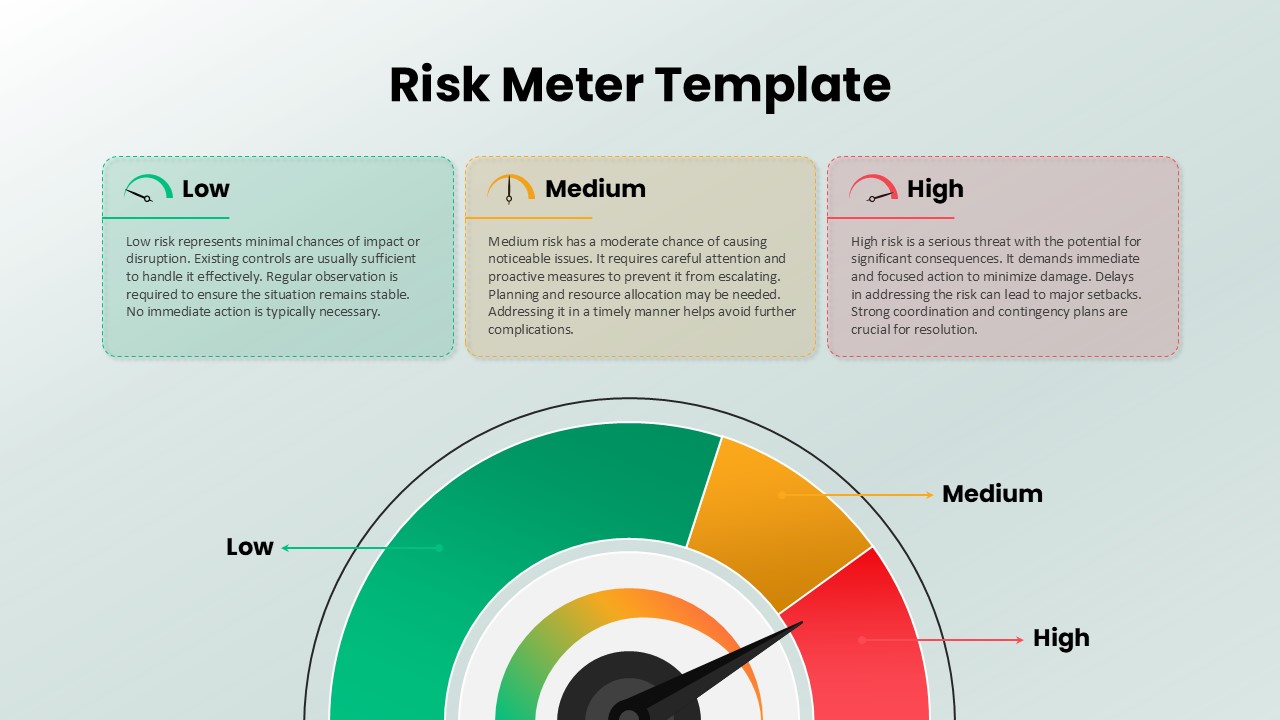
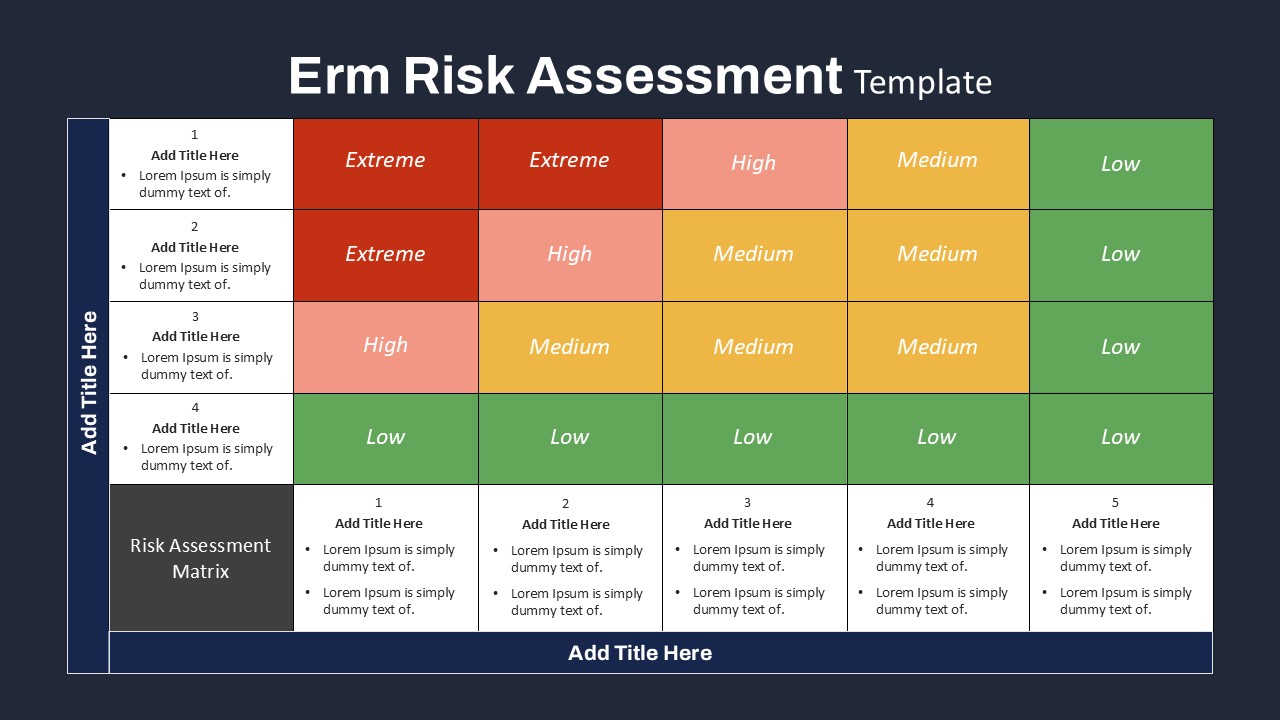
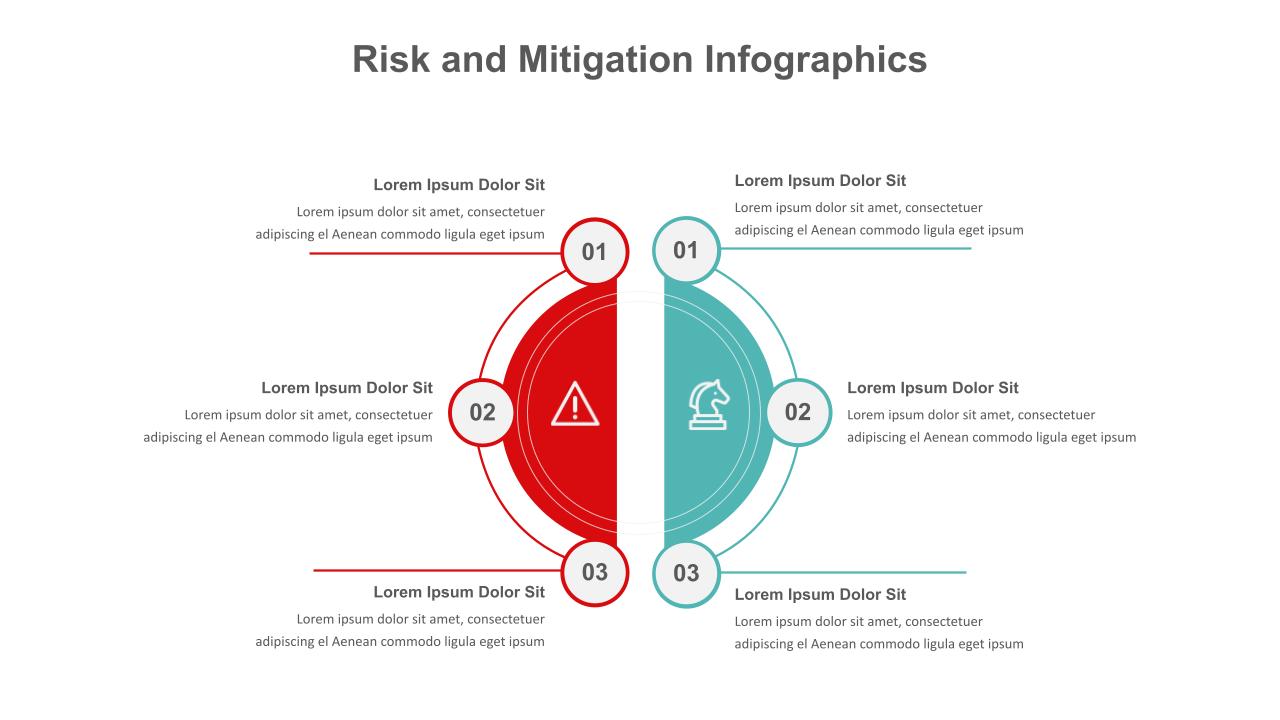
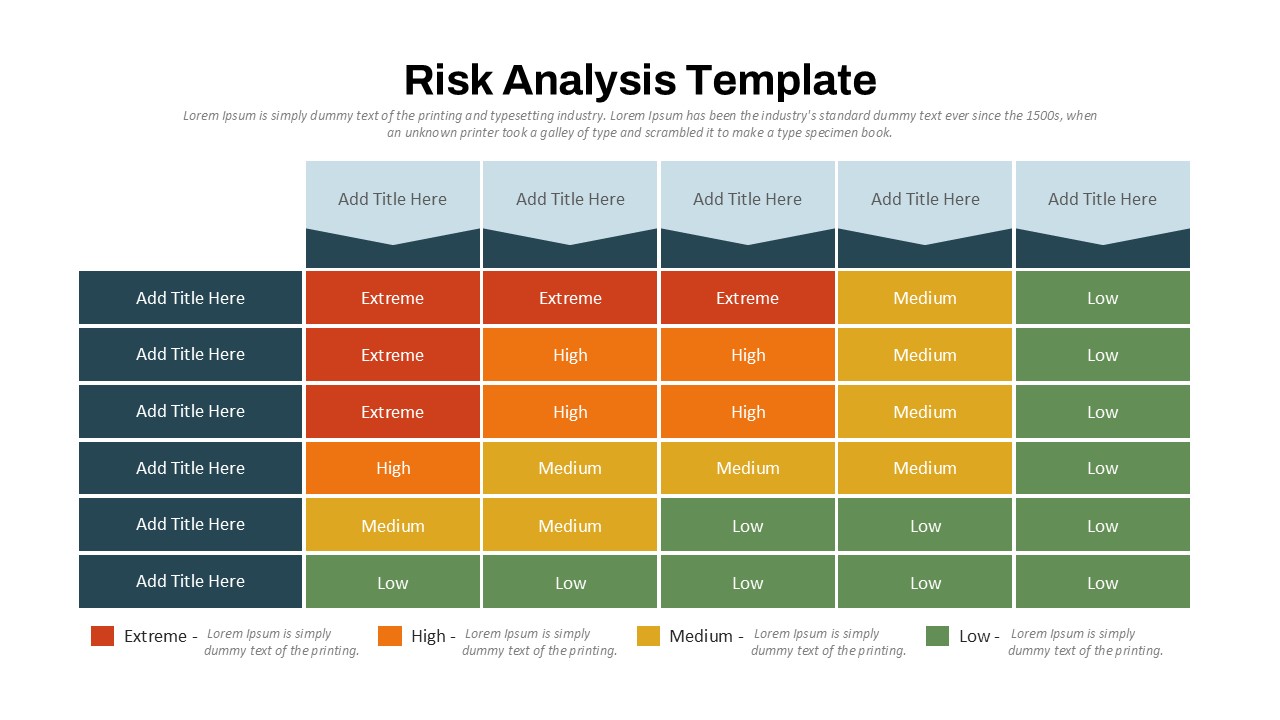
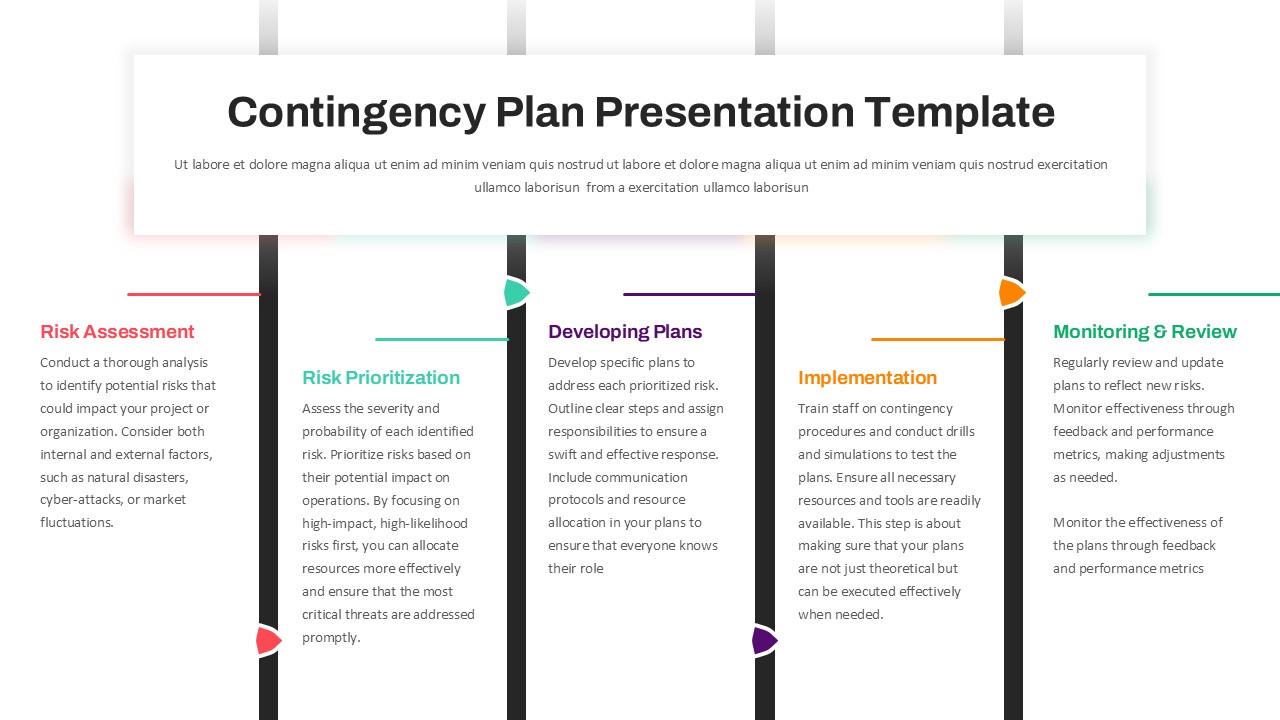
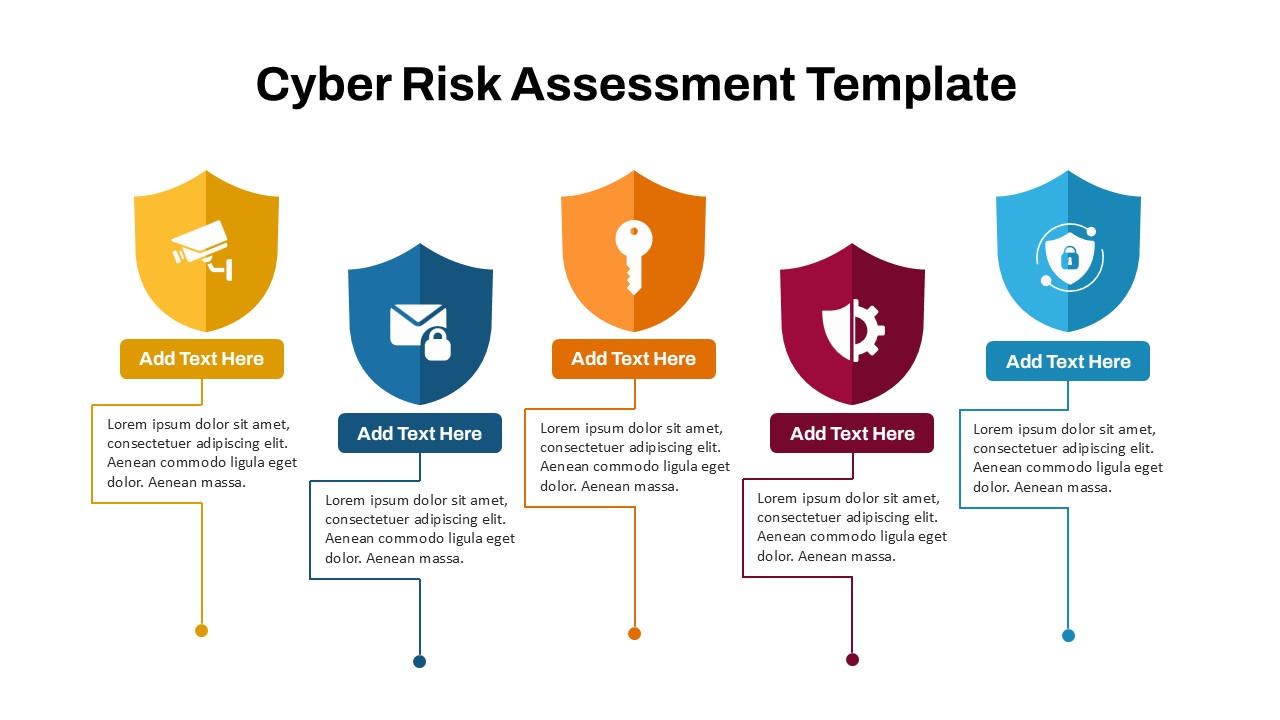
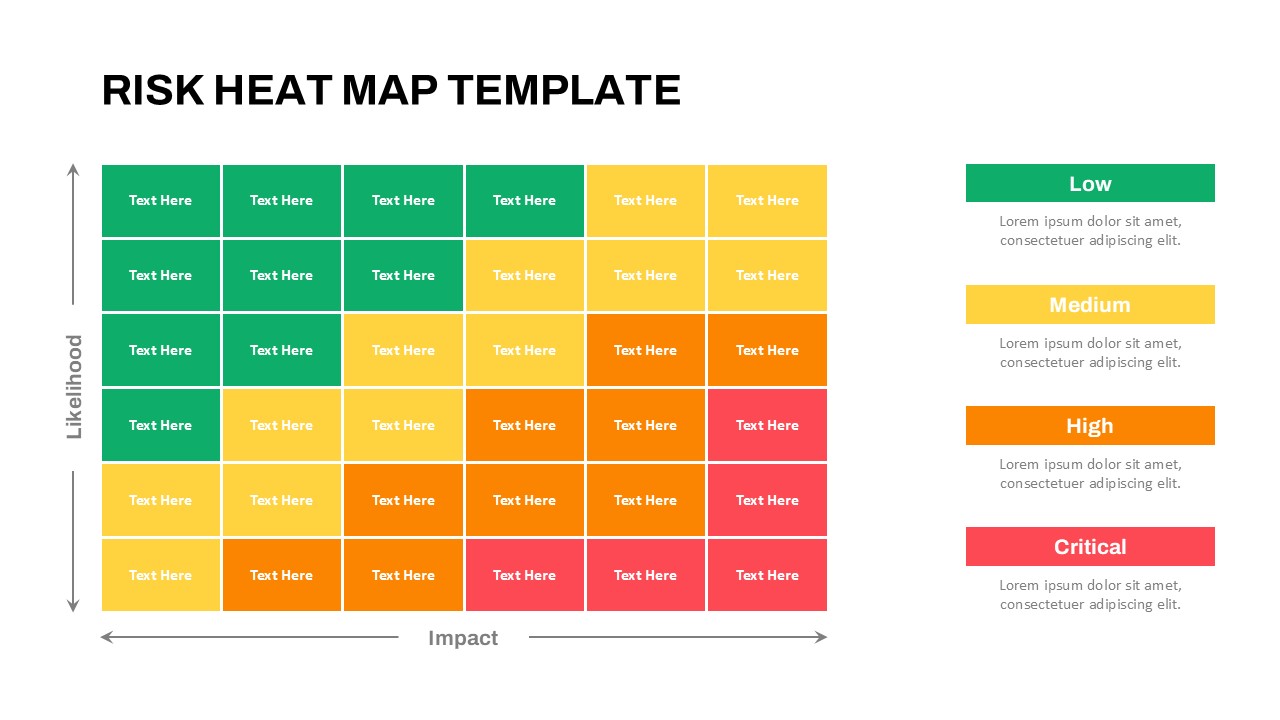
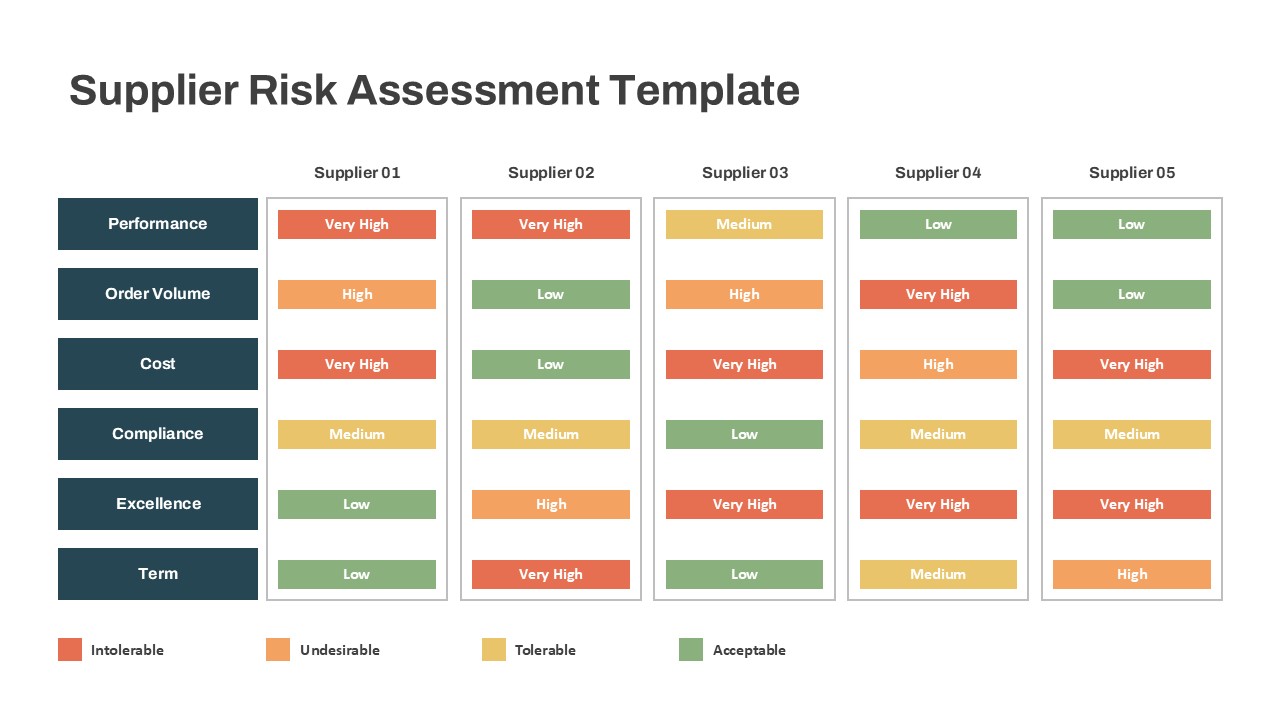
- Risk & Issues Tracking – Circular indicators to highlight and label risk levels
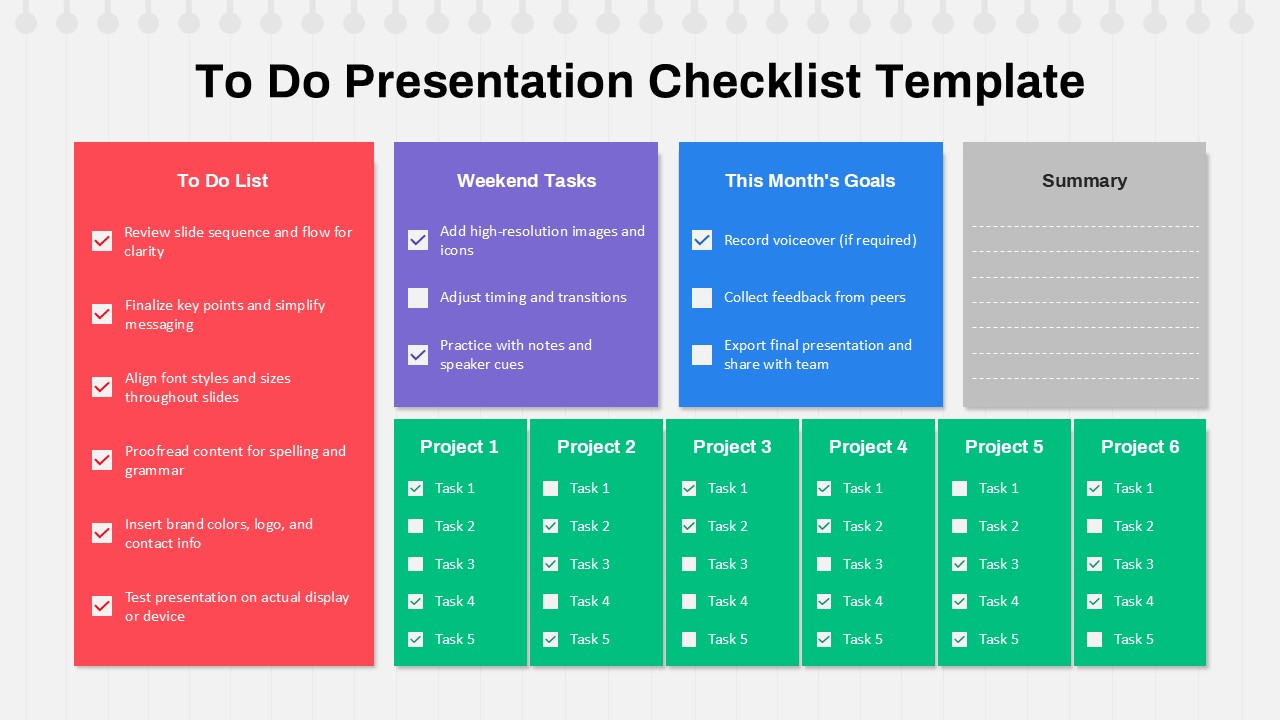
- Upcoming Deadlines – Countdown format for tasks nearing completion
This template serves as a prime example among project management dashboard examples, balancing visual appeal with functional depth. It helps project managers communicate effectively with stakeholders, track real-time progress, and make informed decisions at a glance.
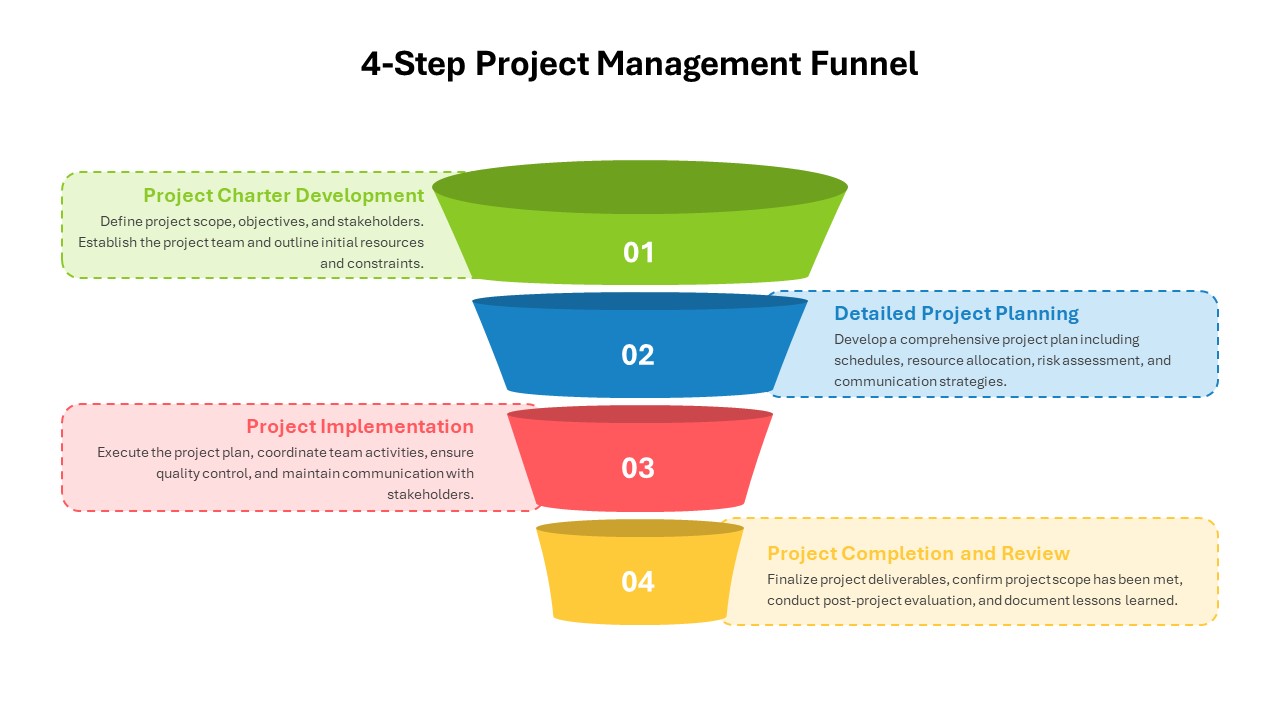
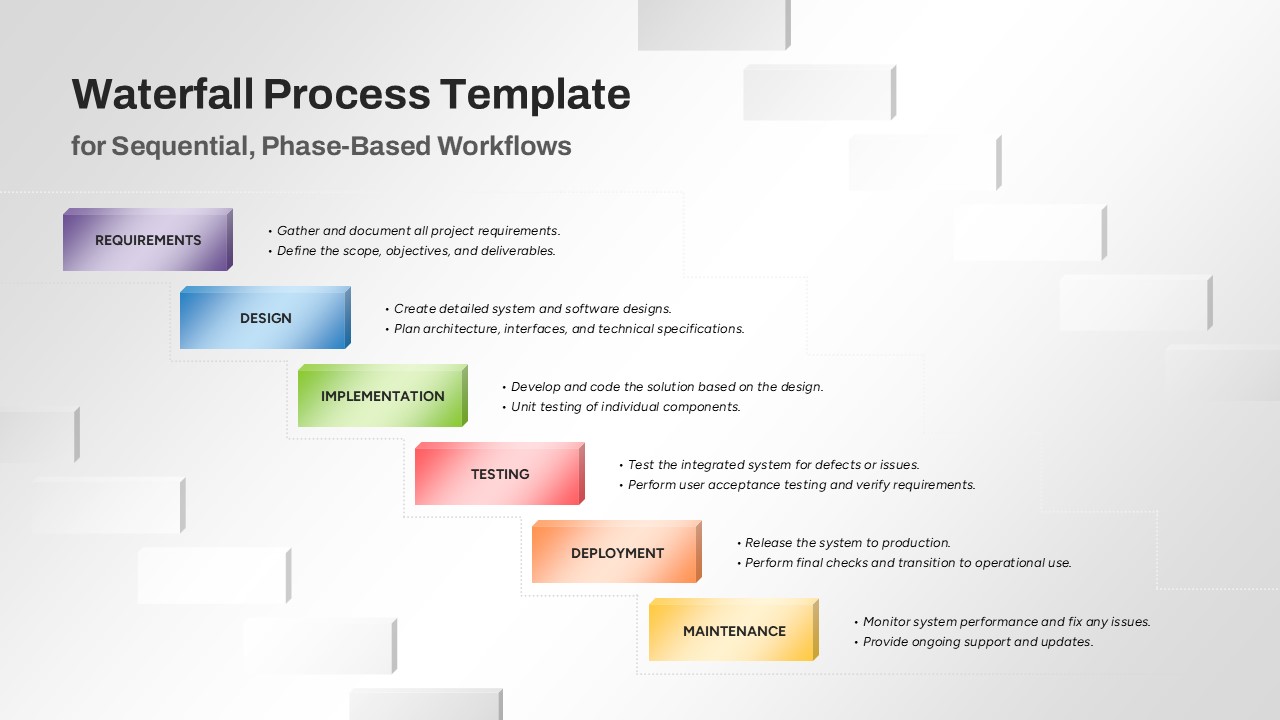
Fully editable in PowerPoint and Google Slides, users can tailor each section to match specific workflows, project methodologies (Agile, Waterfall, Hybrid), or business domains.
See more

Aspect Ratio
16:9Item ID
SKT03619
Features of this template
Other User Cases of the Template
Agile sprint reviews, stakeholder status updates, team workload analysis, PMO reporting tools, quarterly project reviews, product development tracking, internal team dashboards, cross-functional planning meetings, remote project tracking, executive project summaries
FAQs
You May Also Like These Presentation Templates

- Free

- Free
- Free

- Free
- Free
- Free