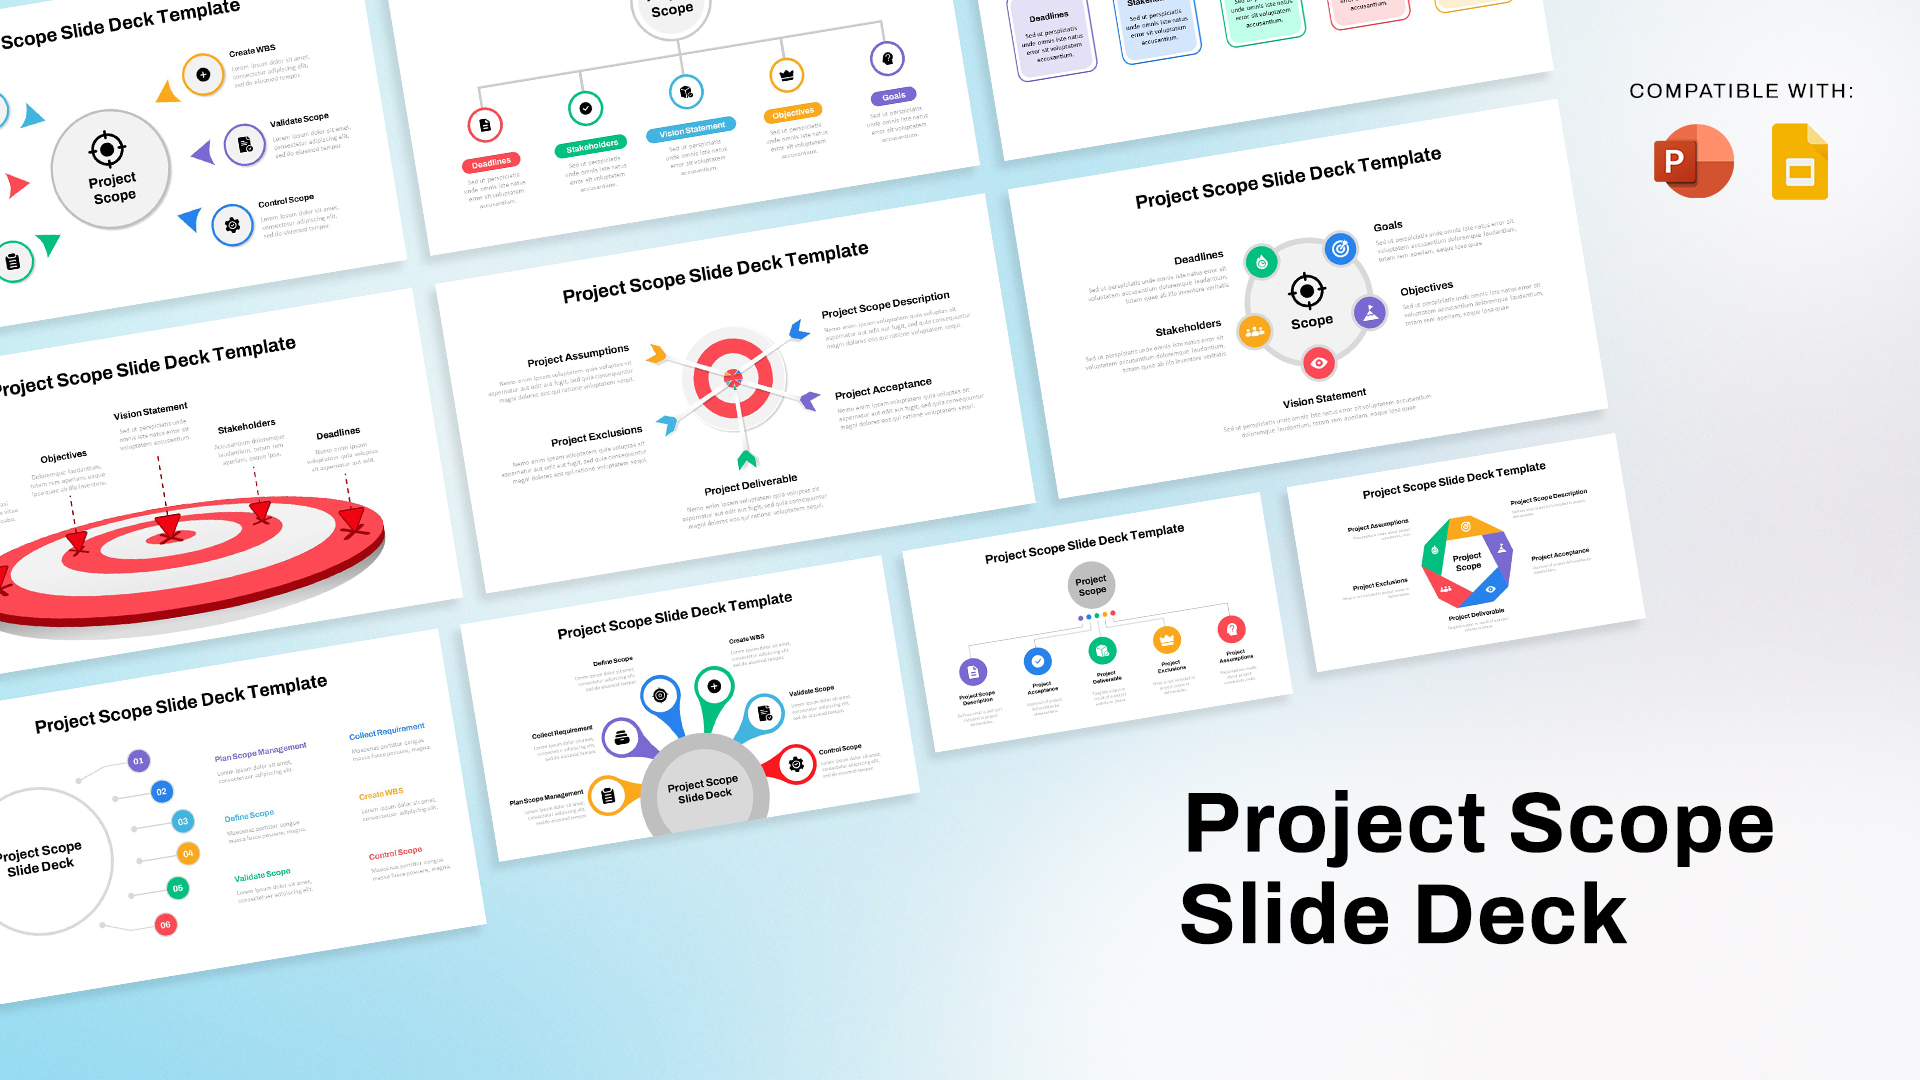
Project Management Infographics Template
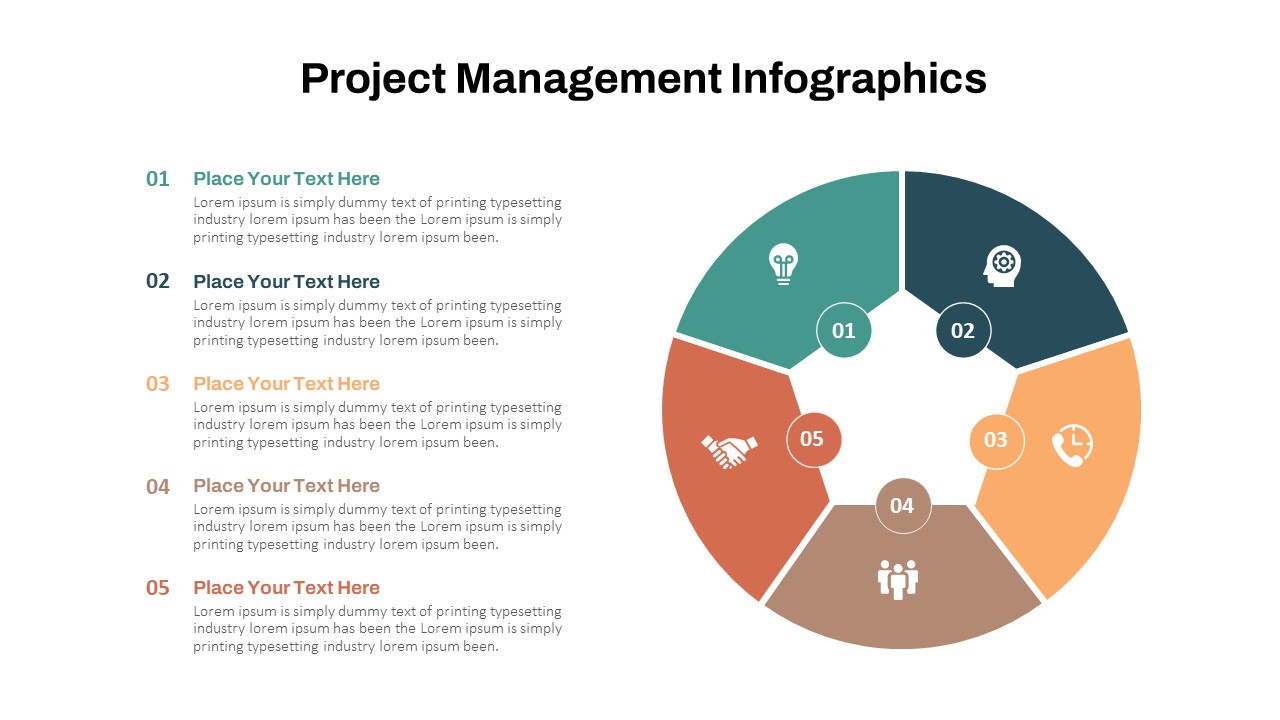


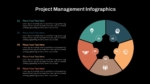
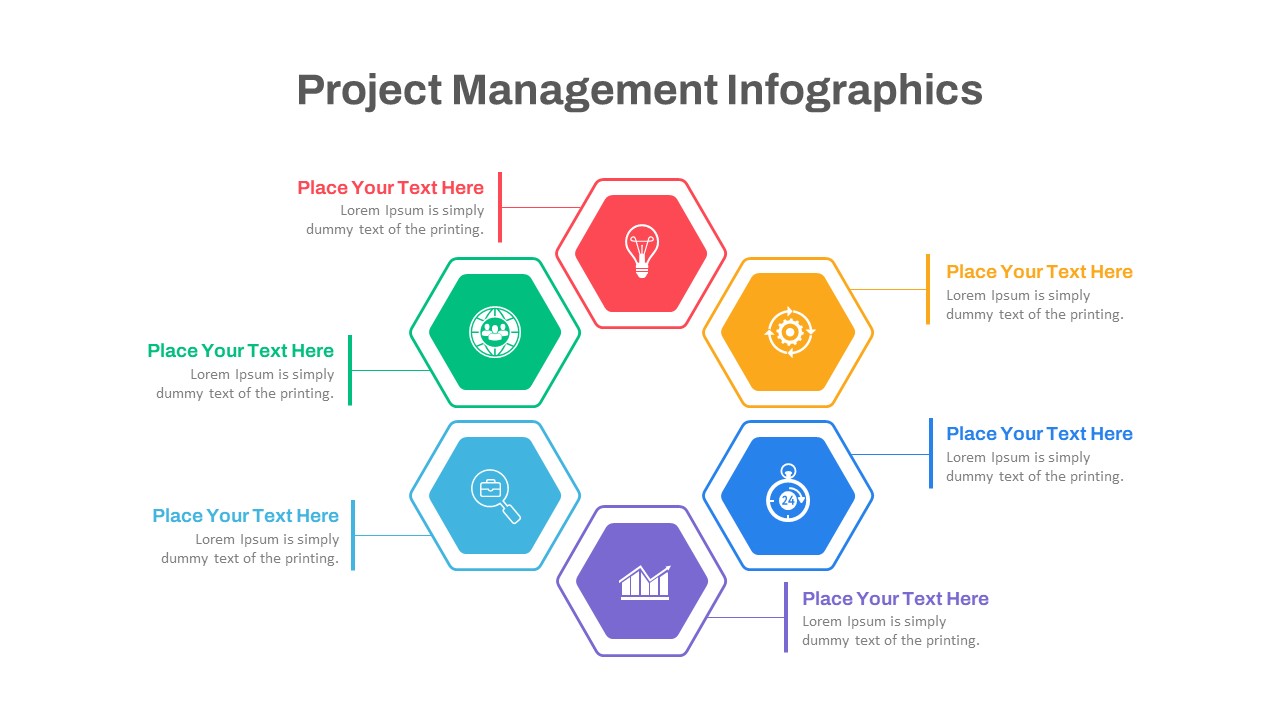
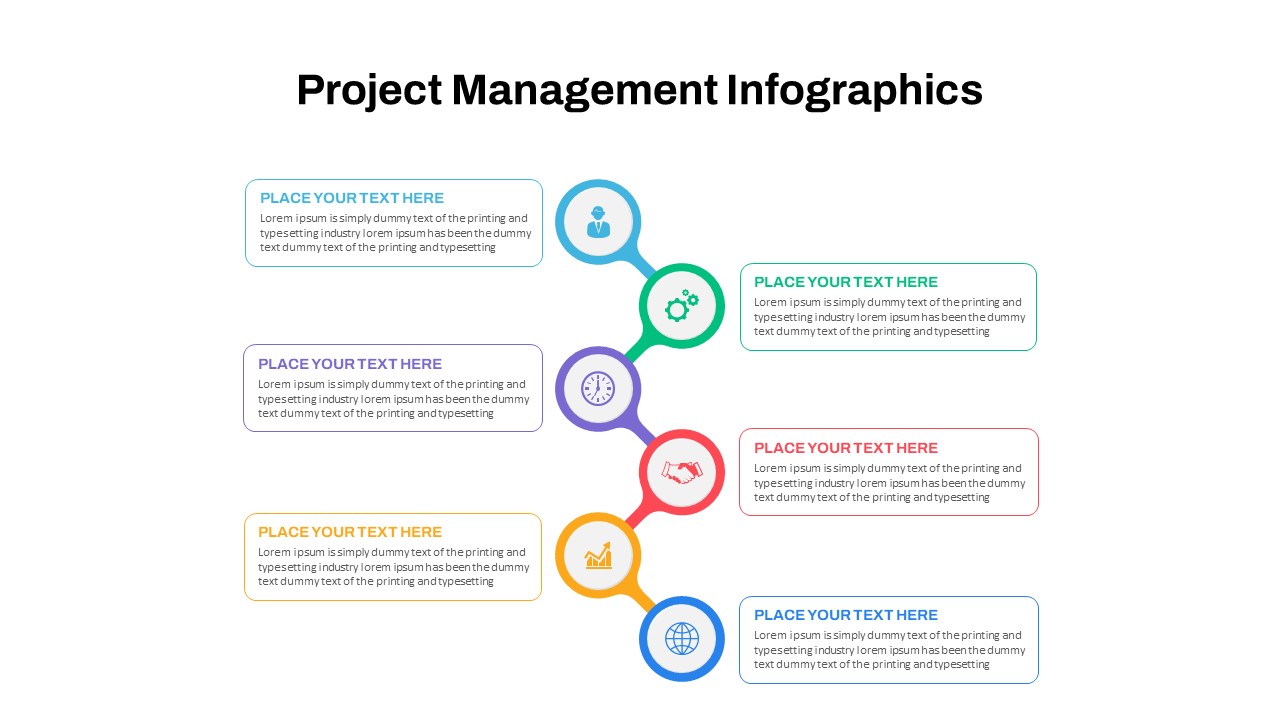
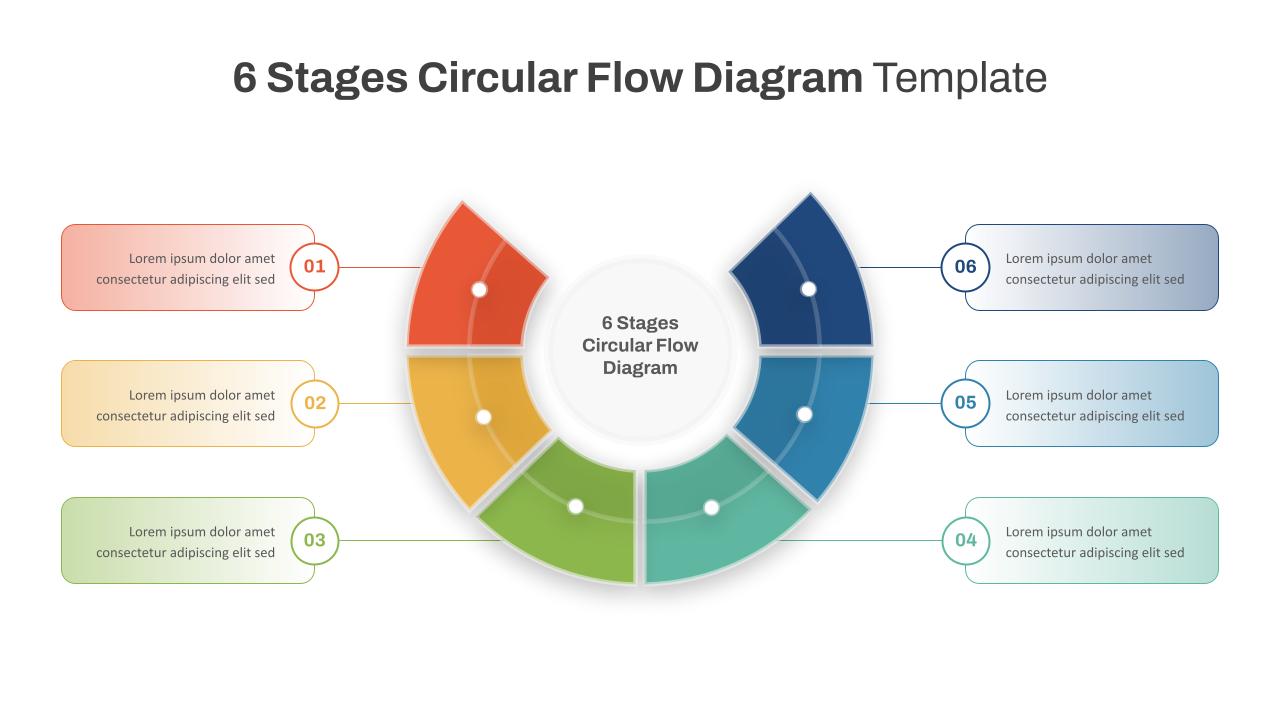
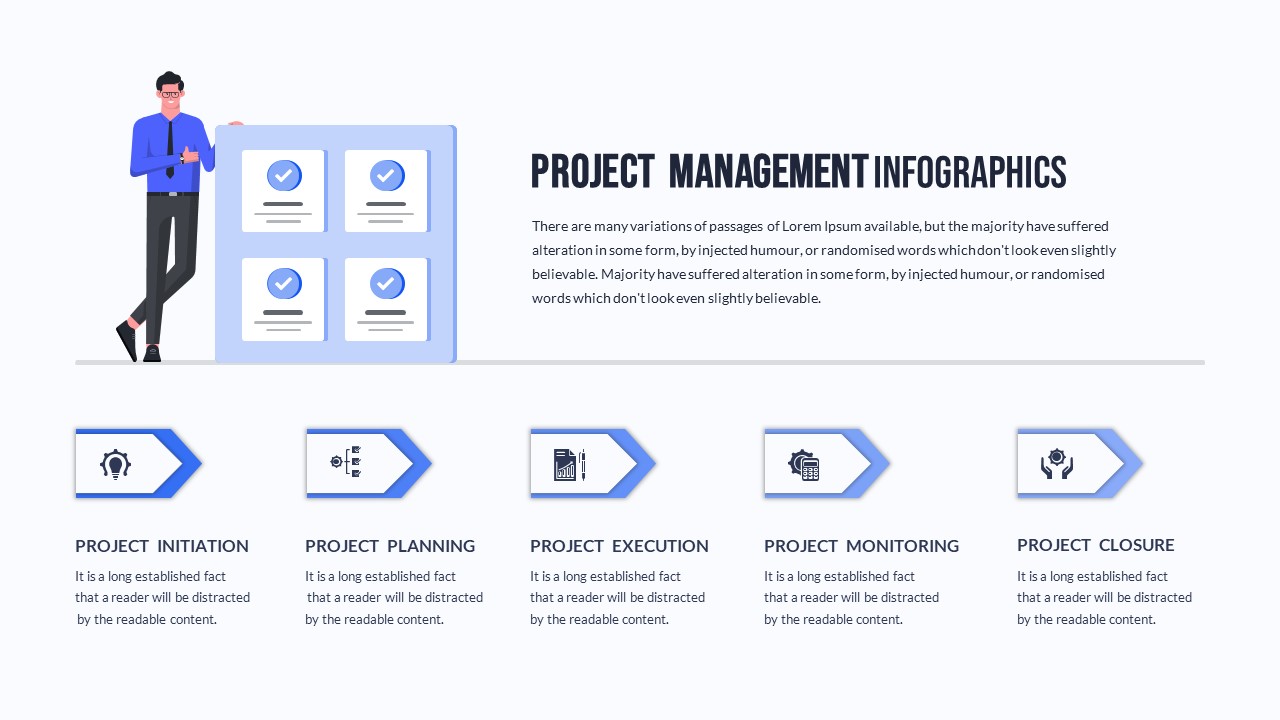
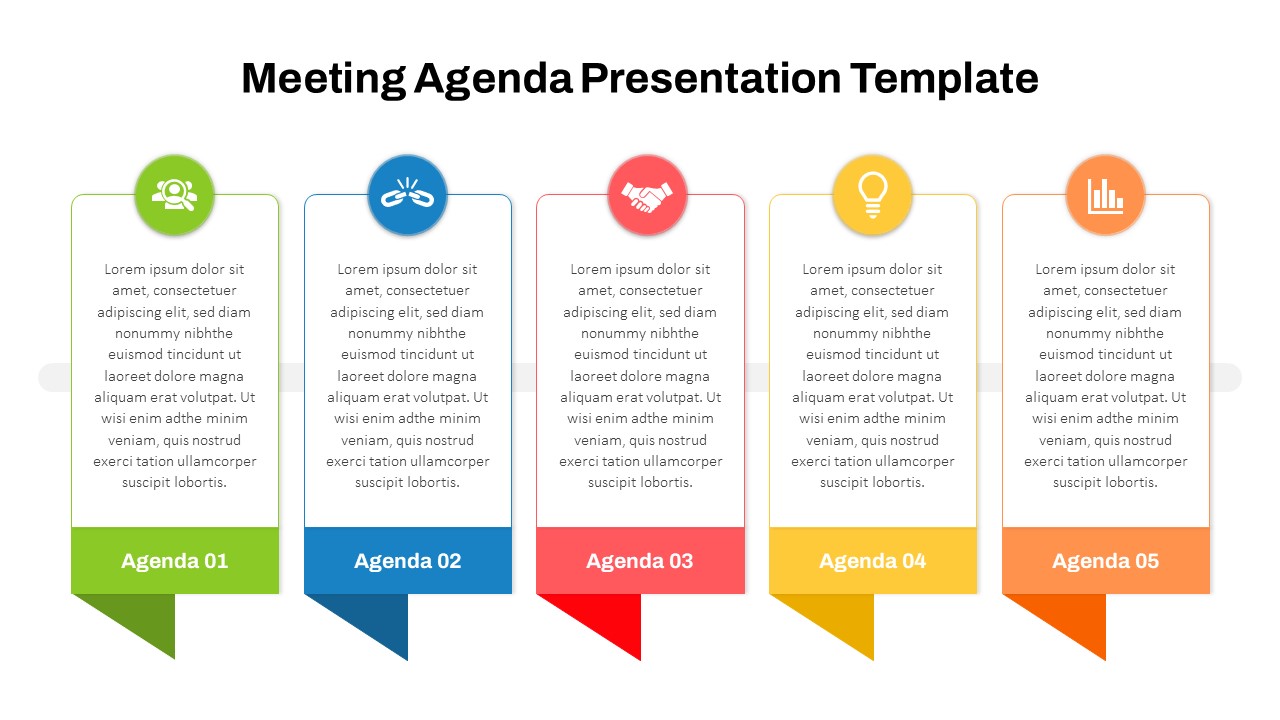
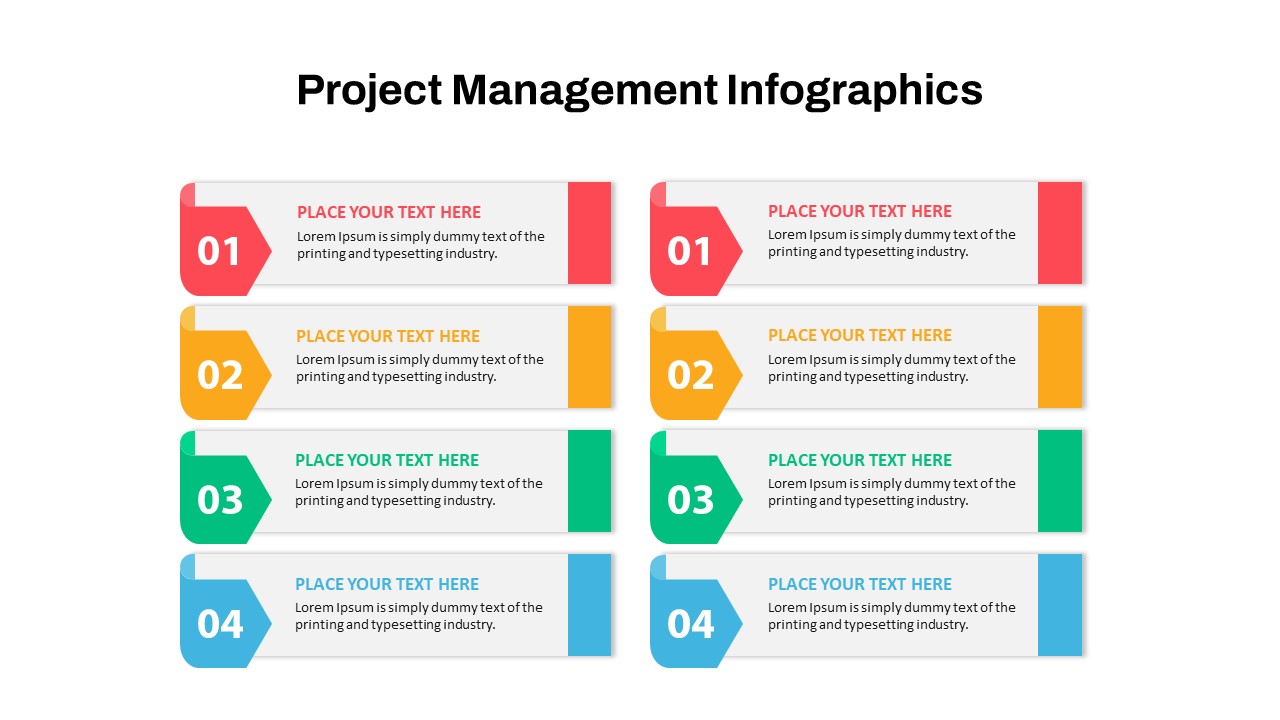
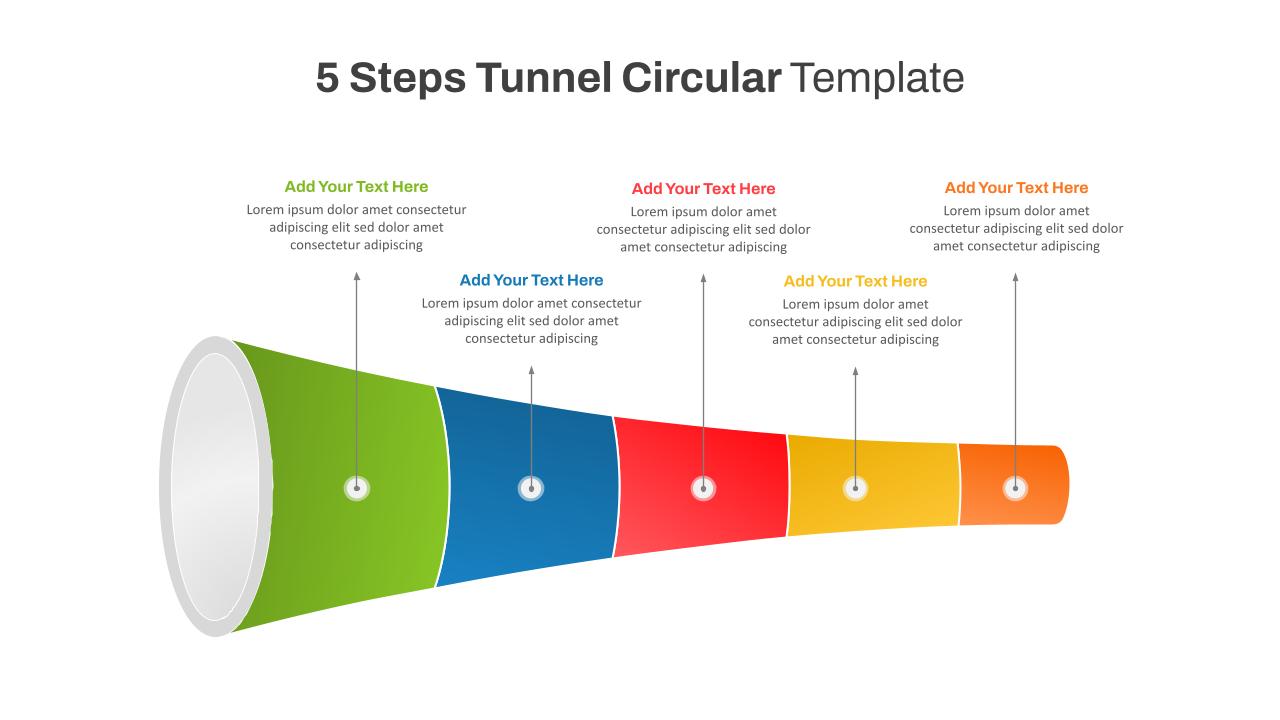
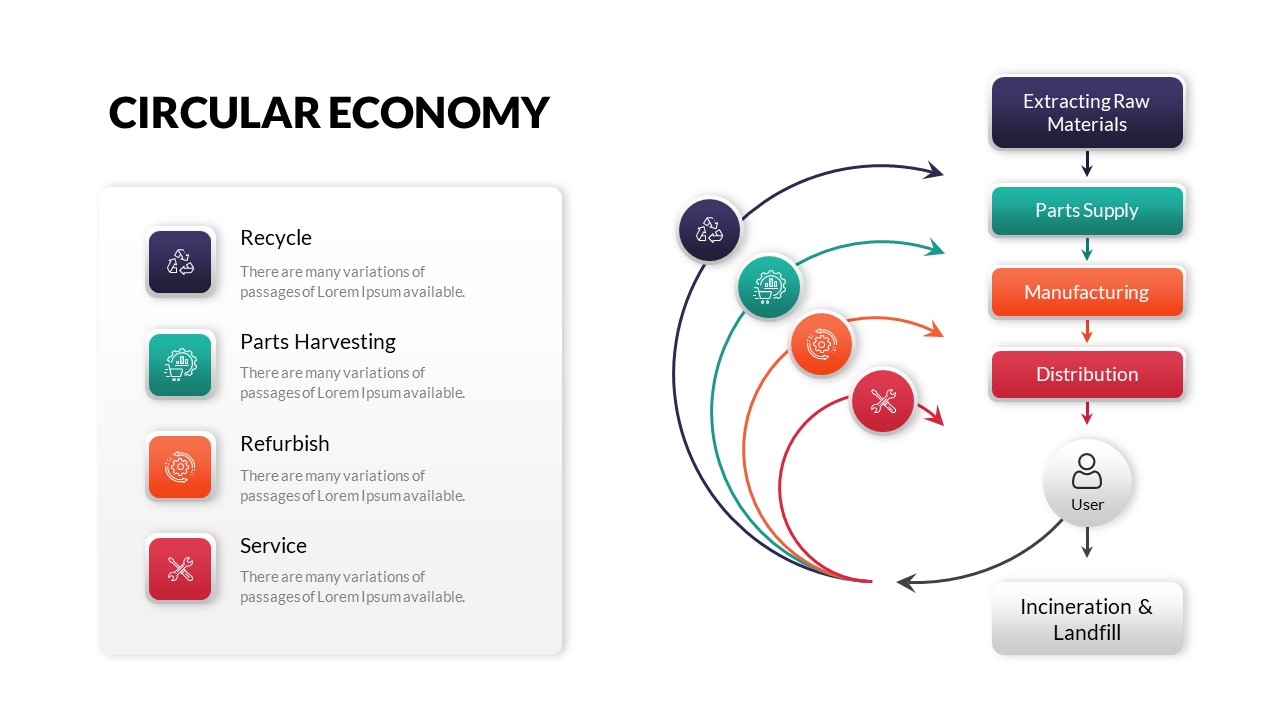
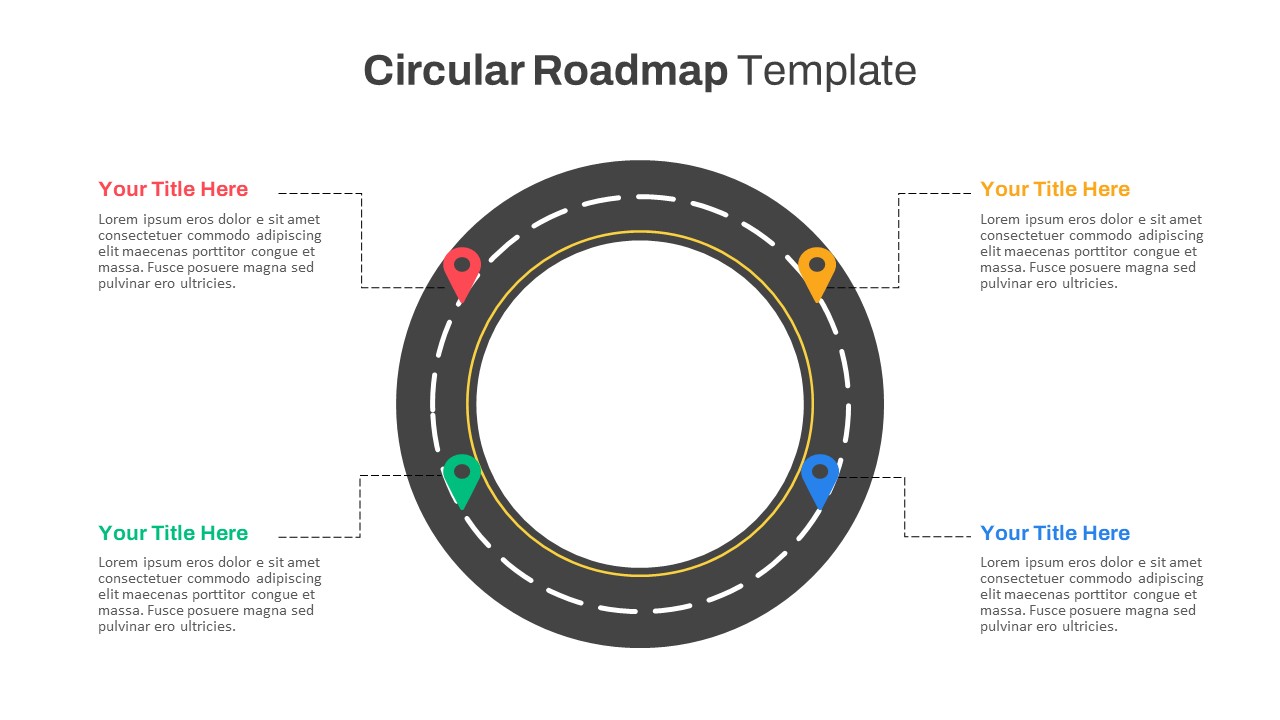
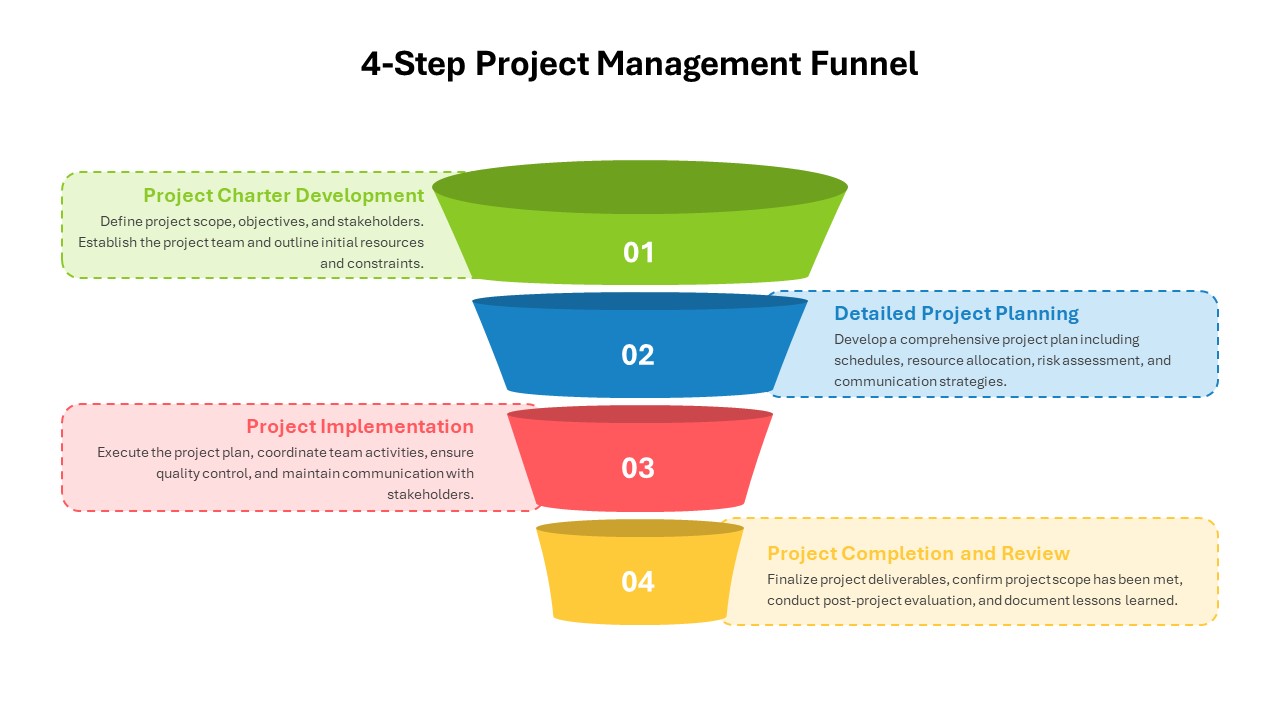
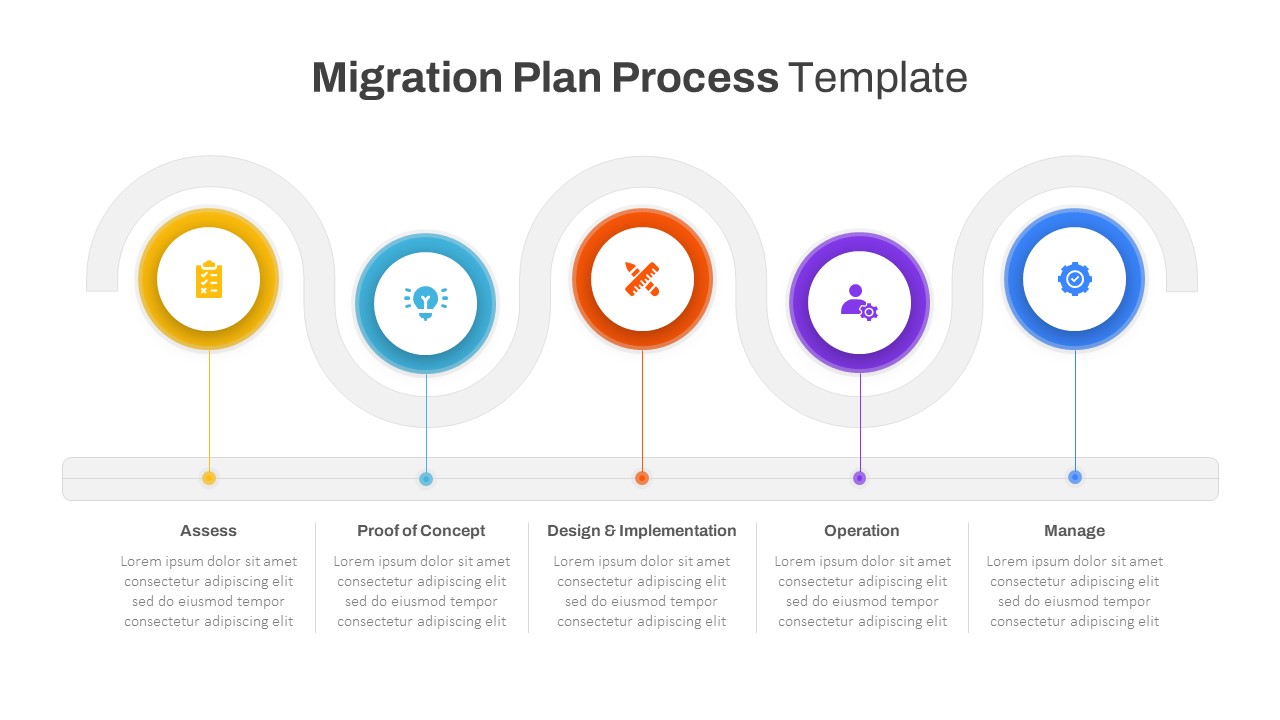
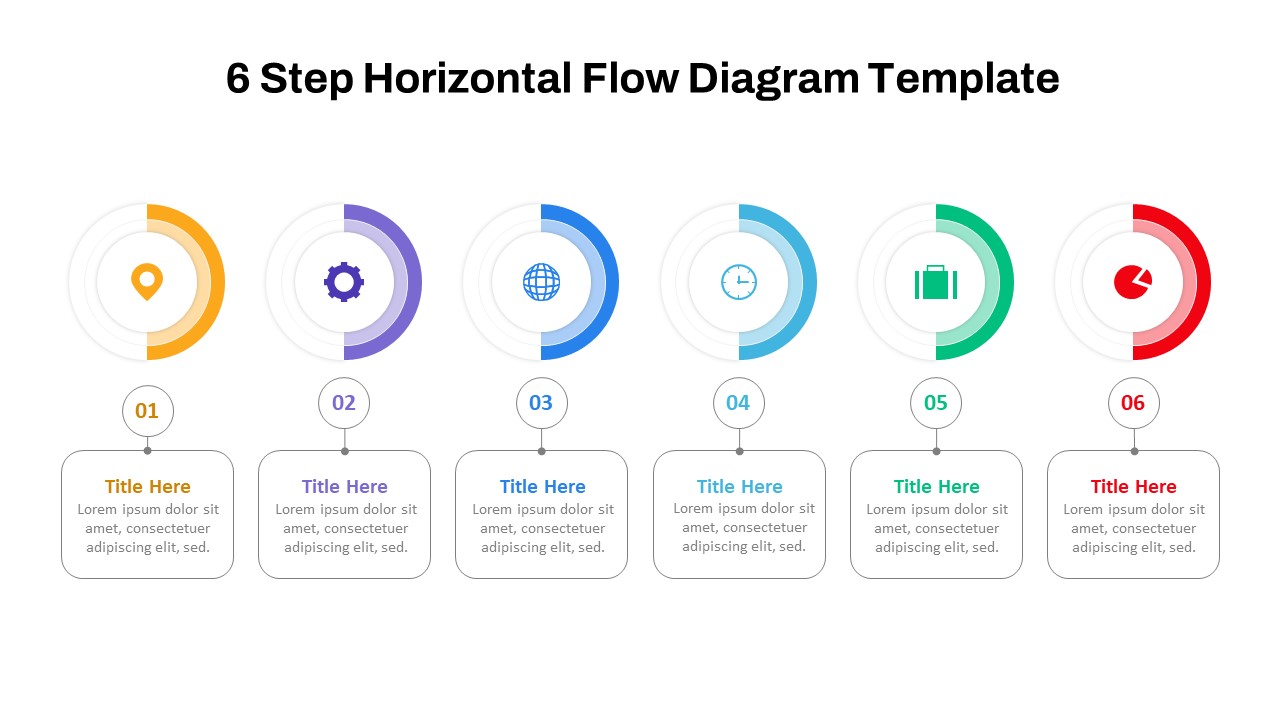
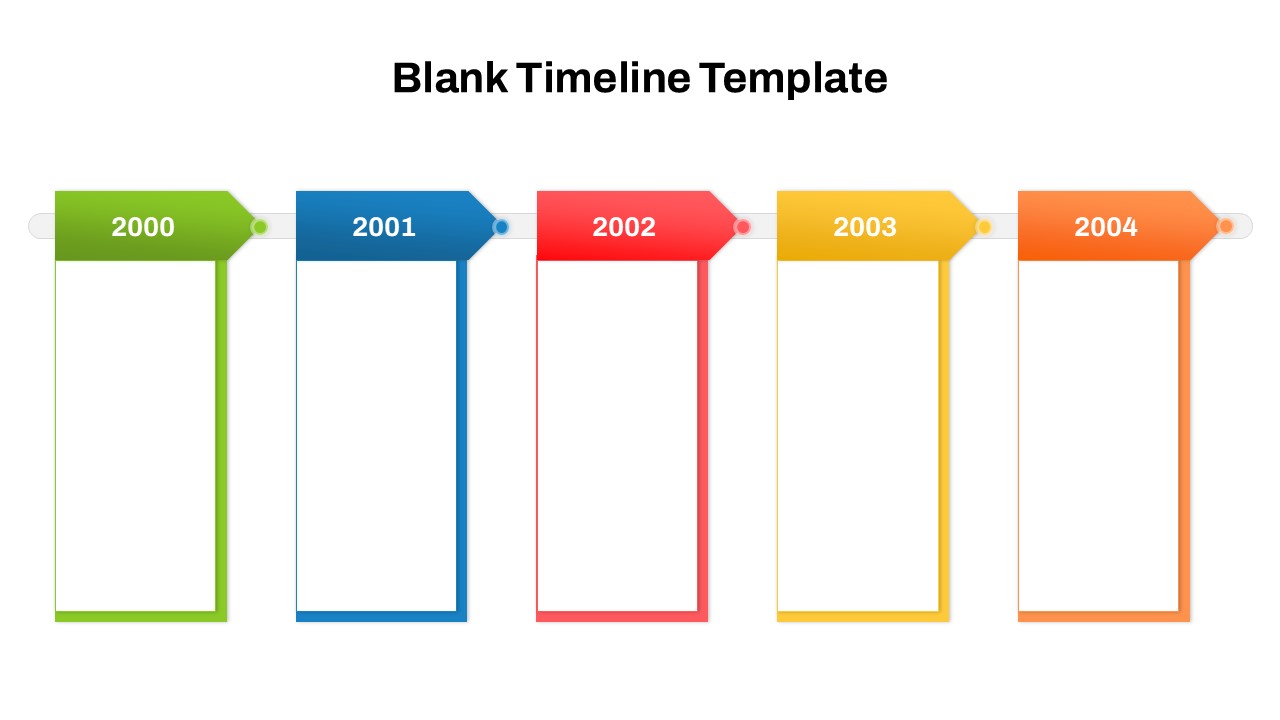
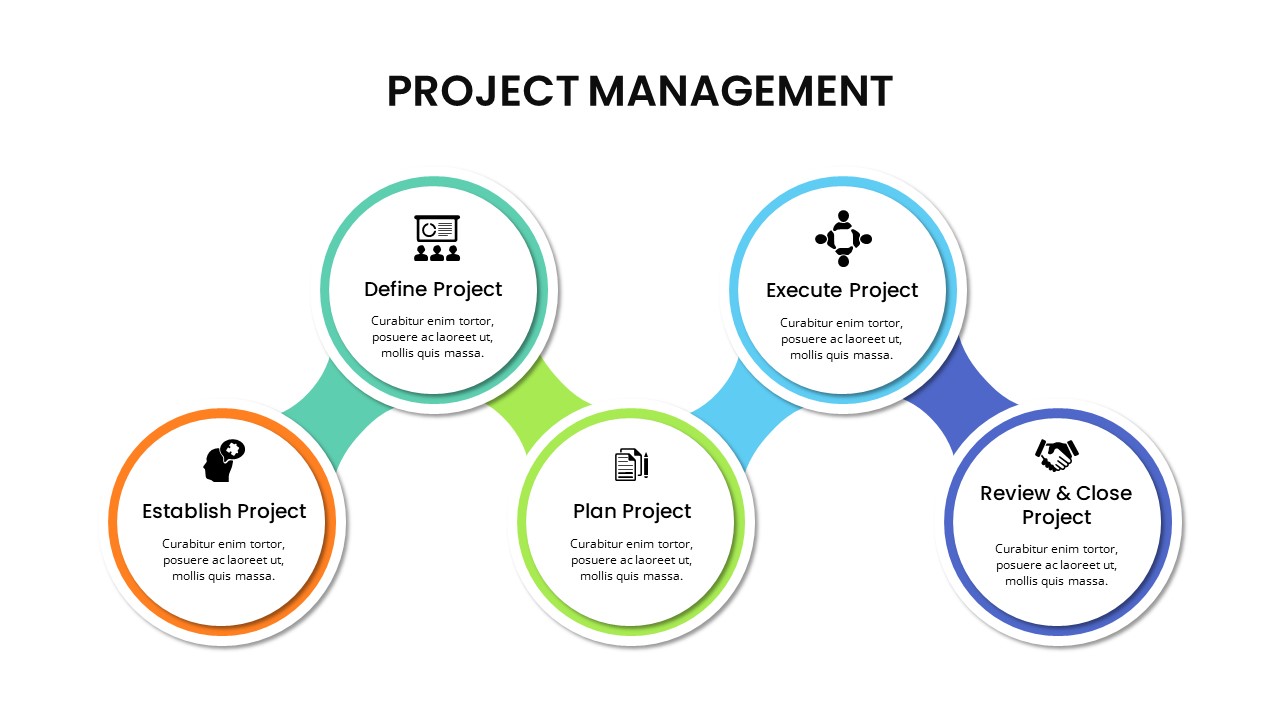
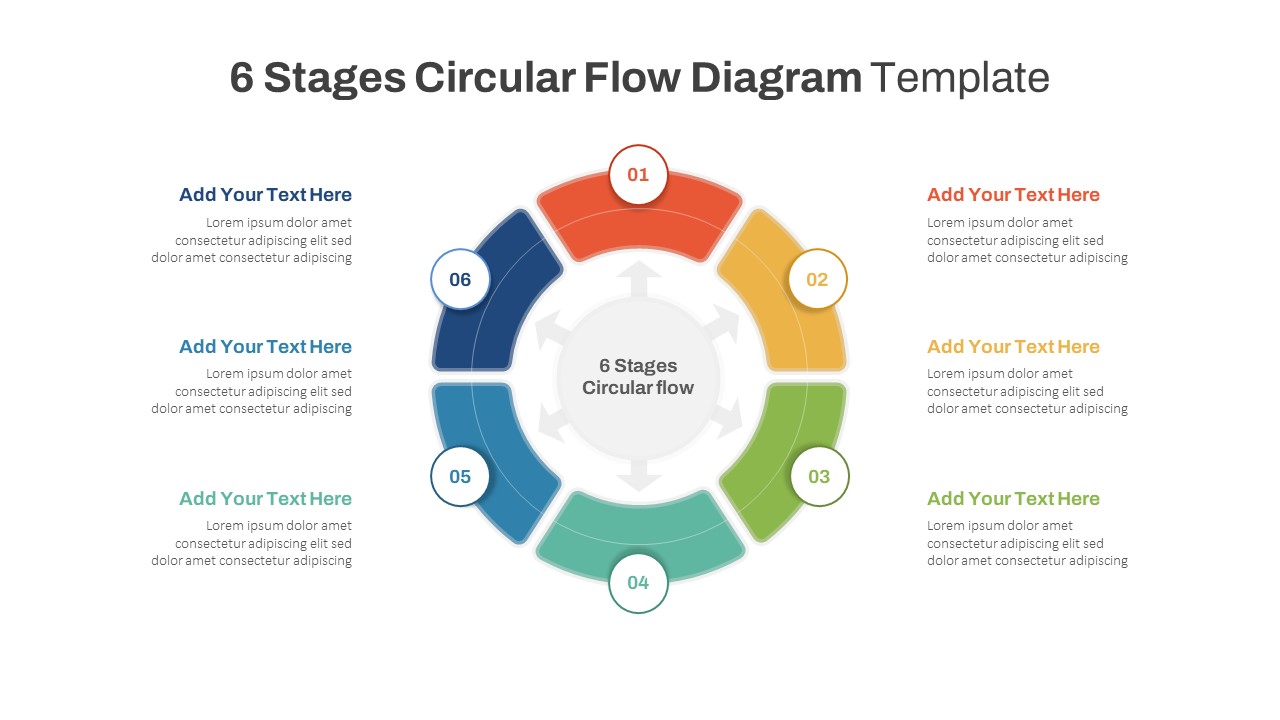
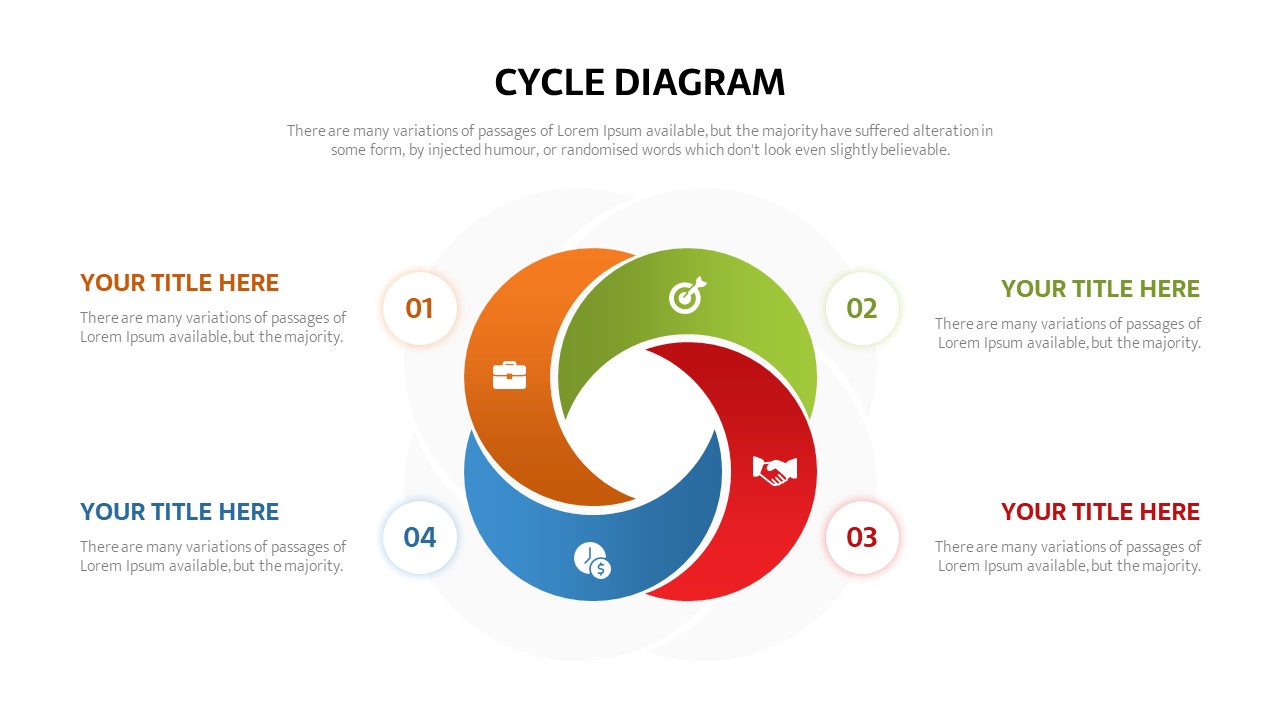
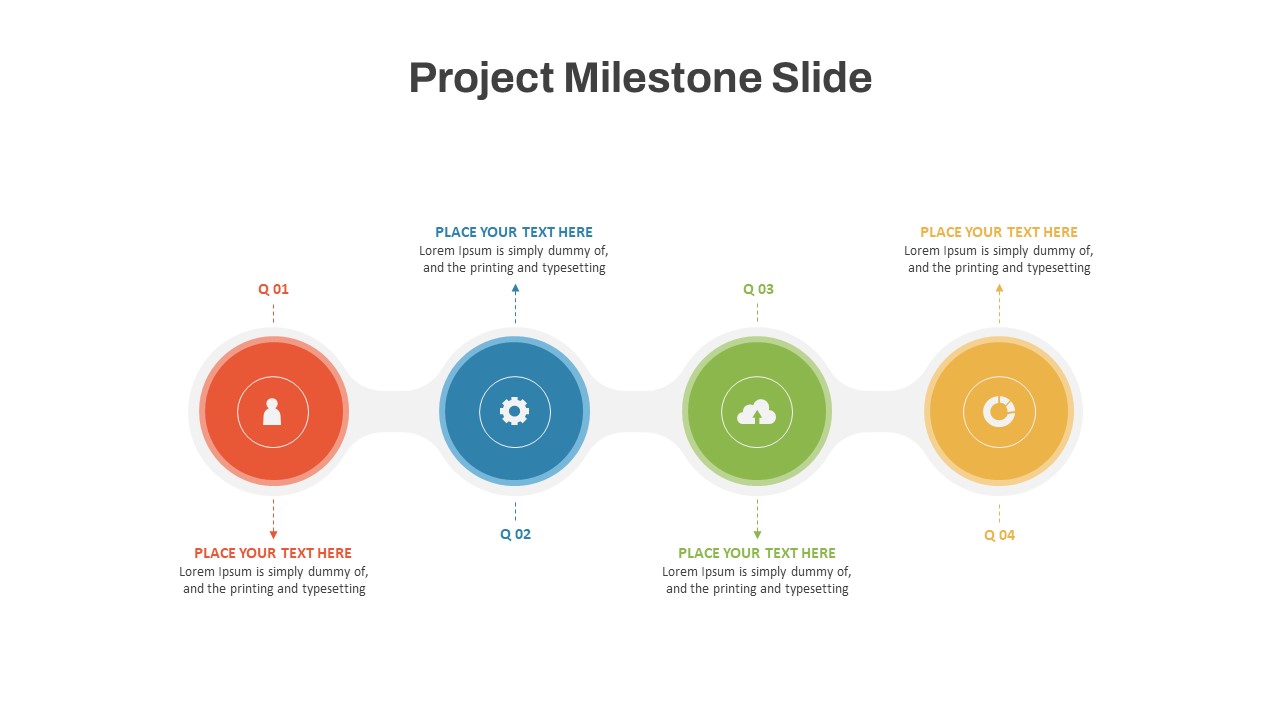
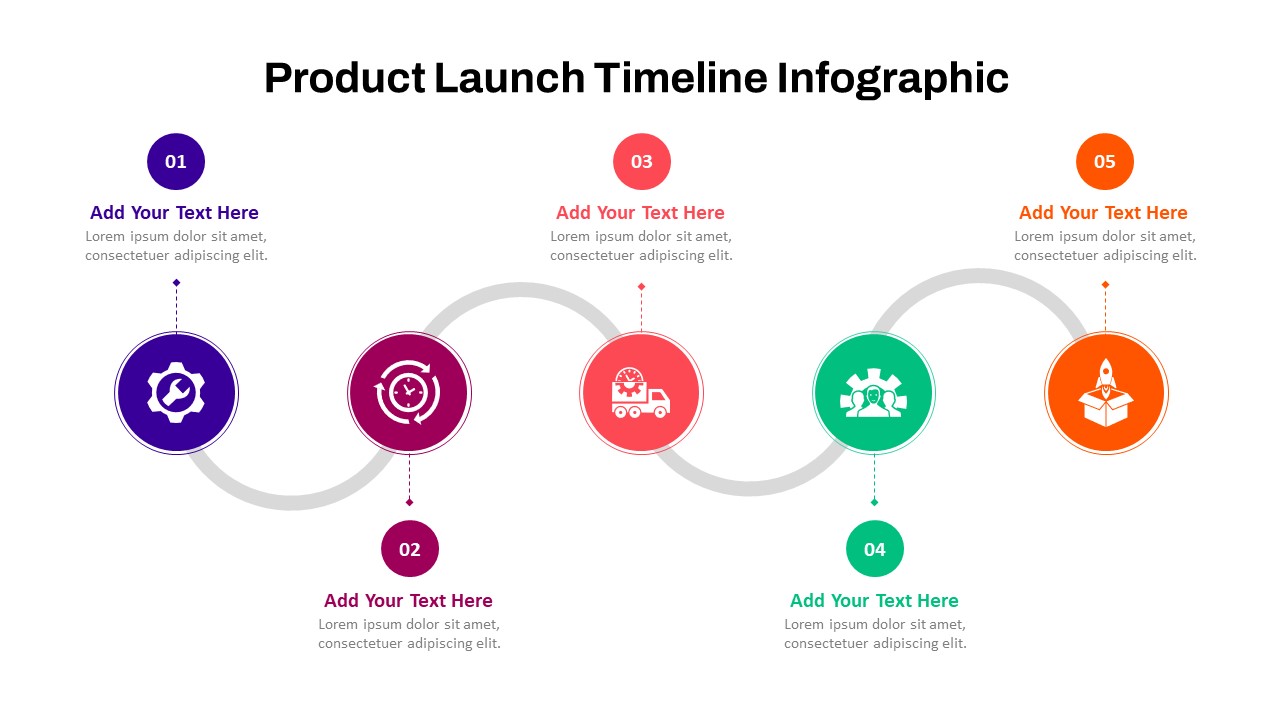
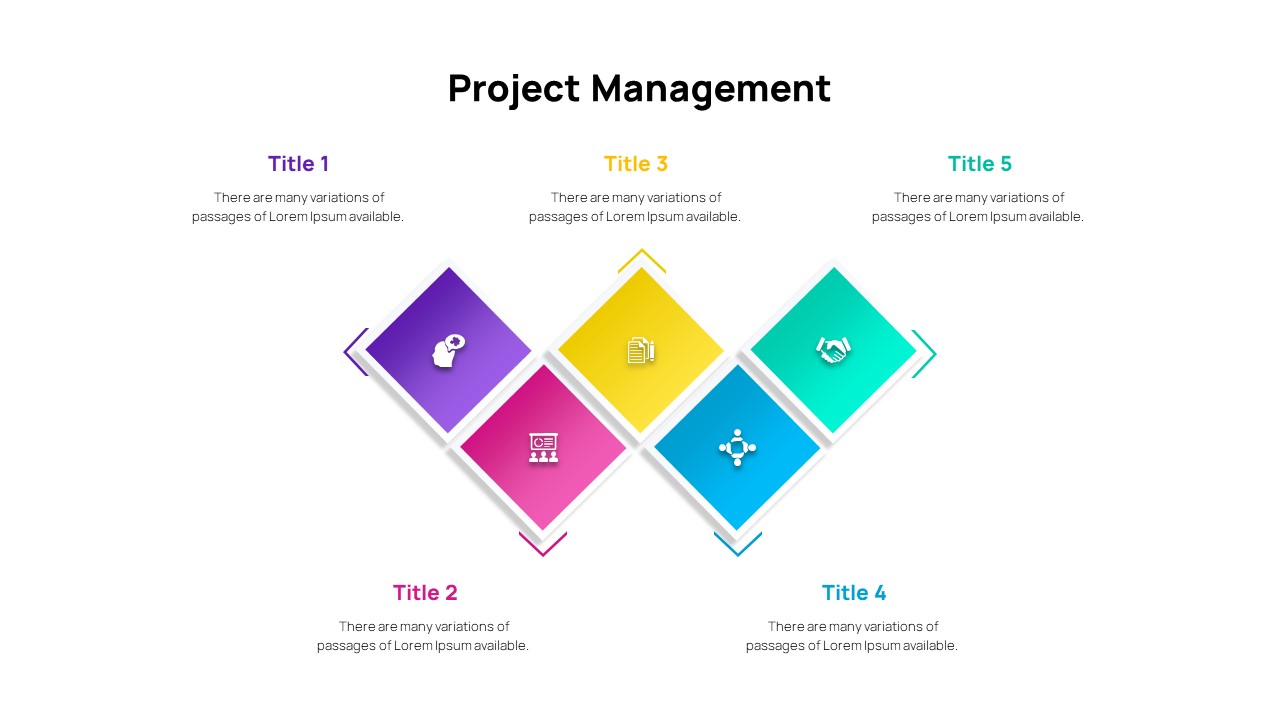
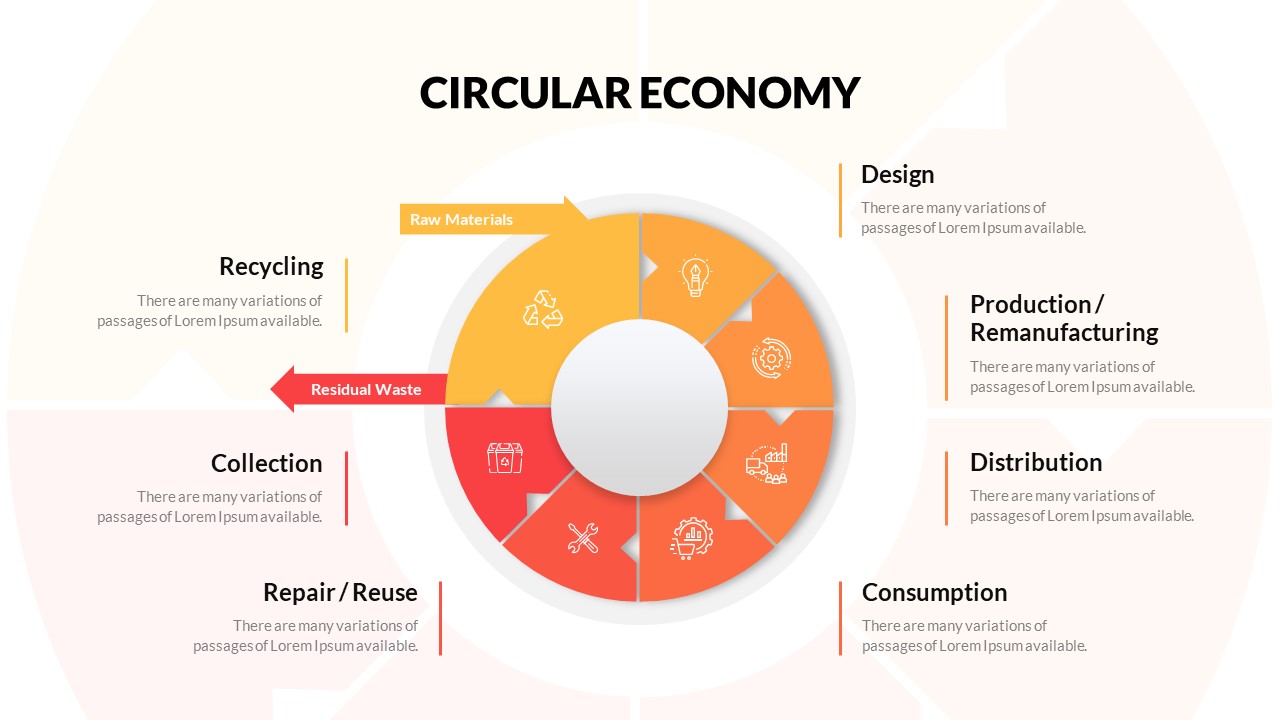
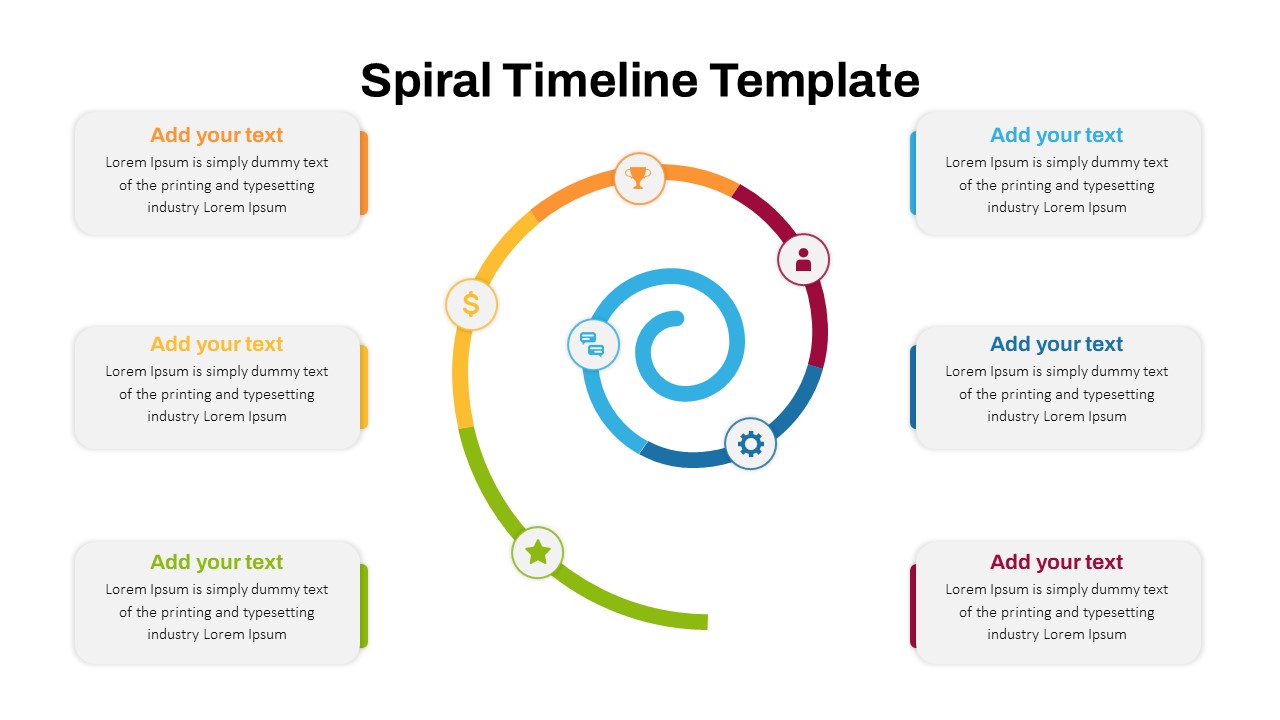
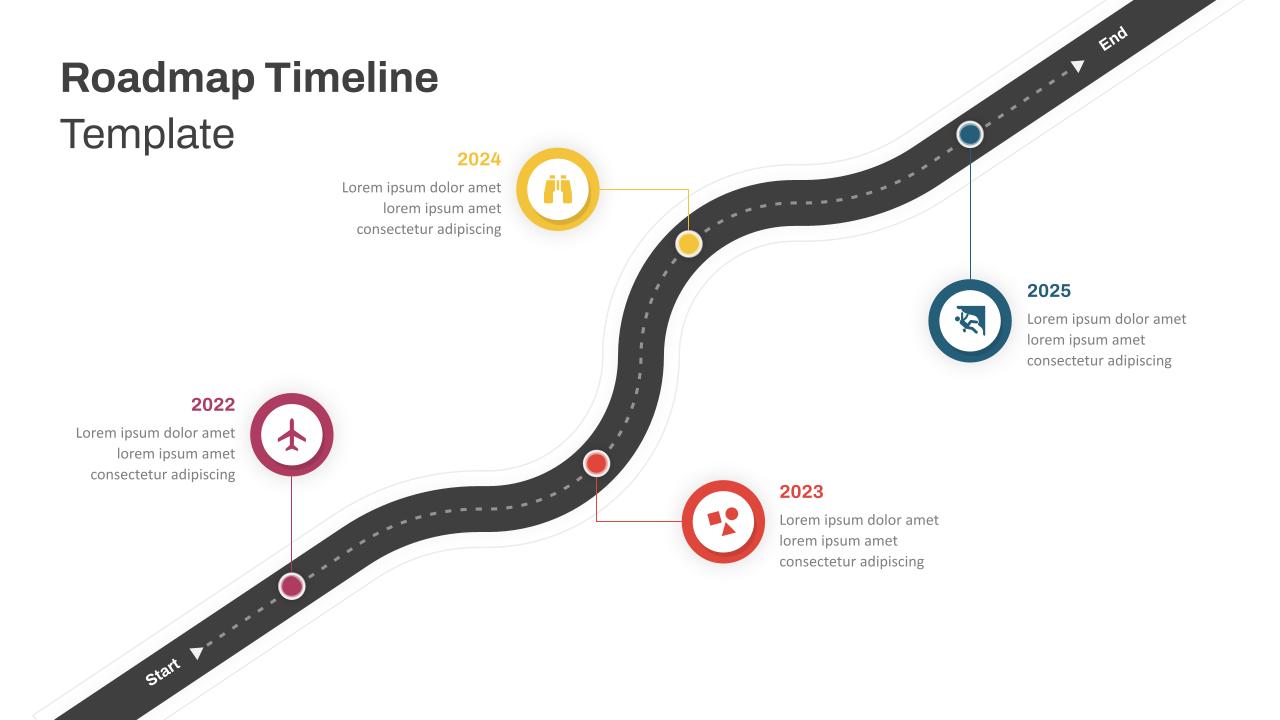
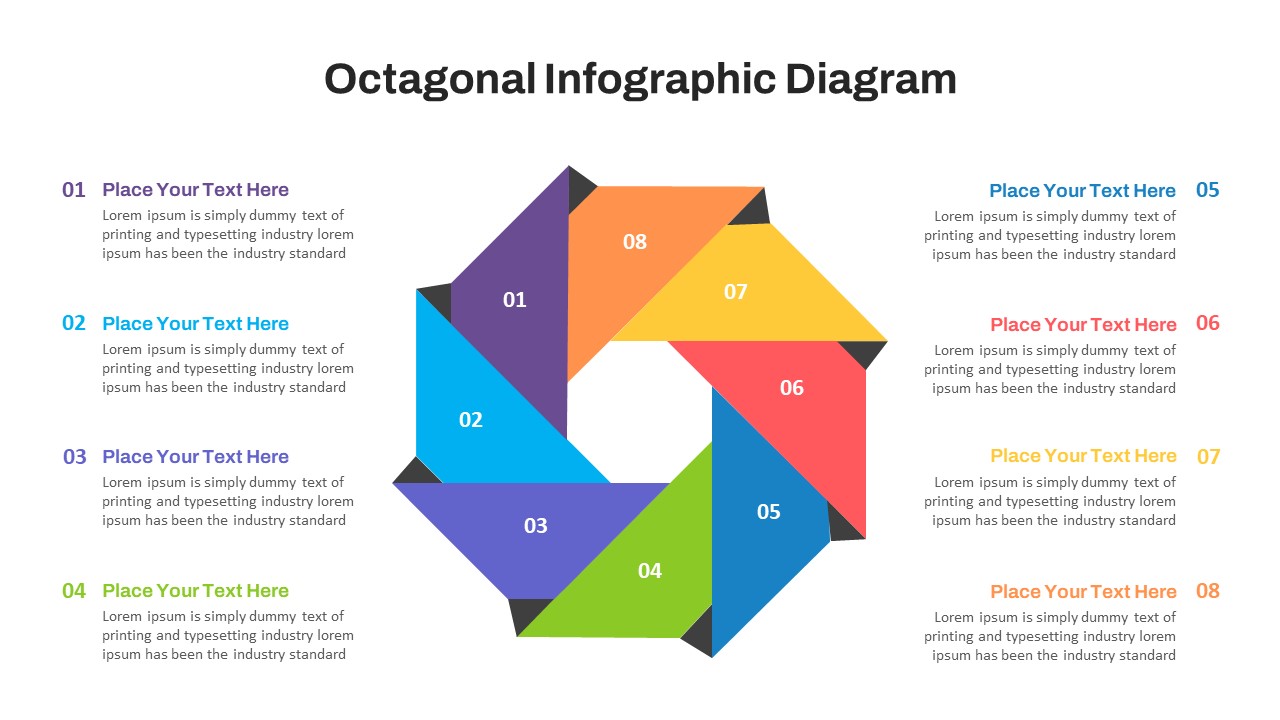
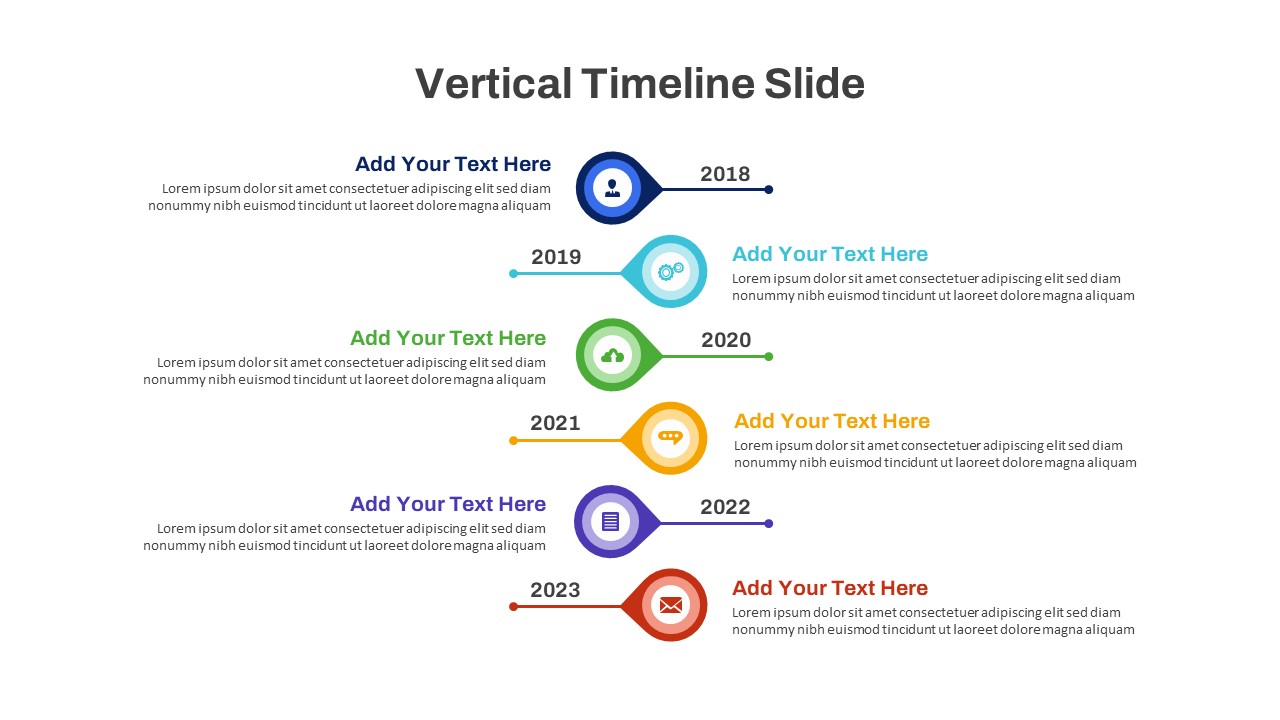
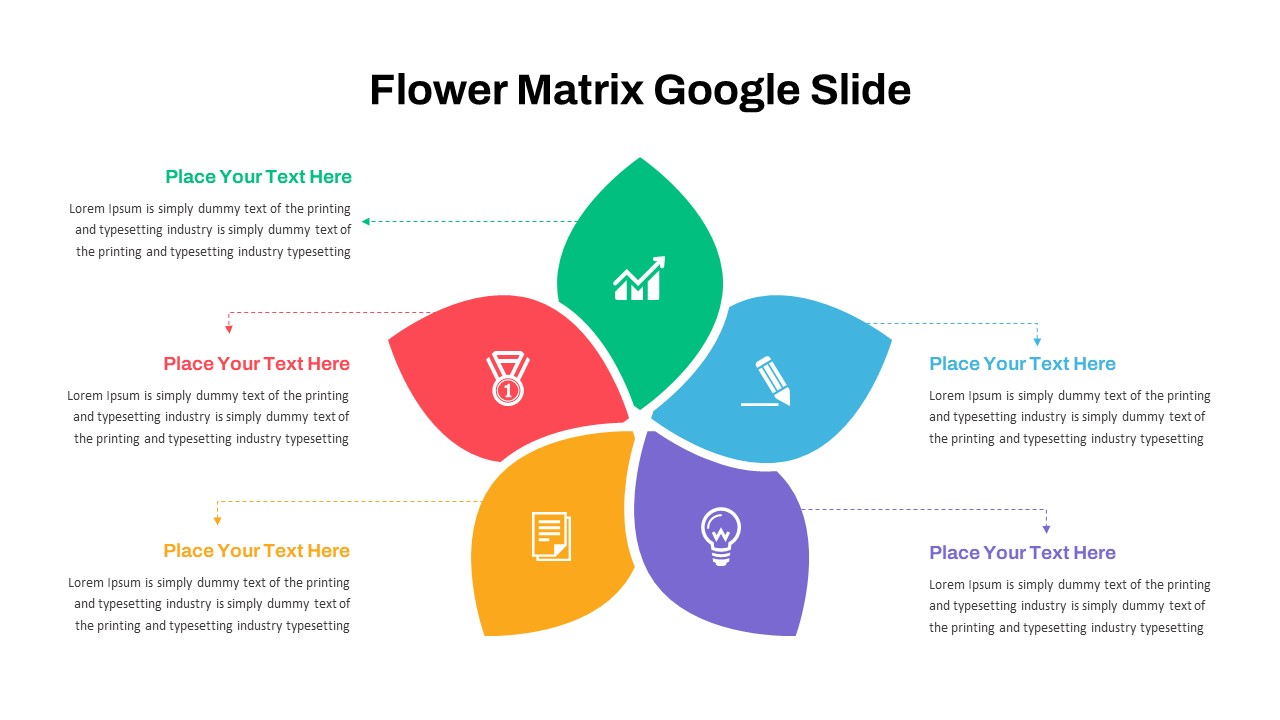
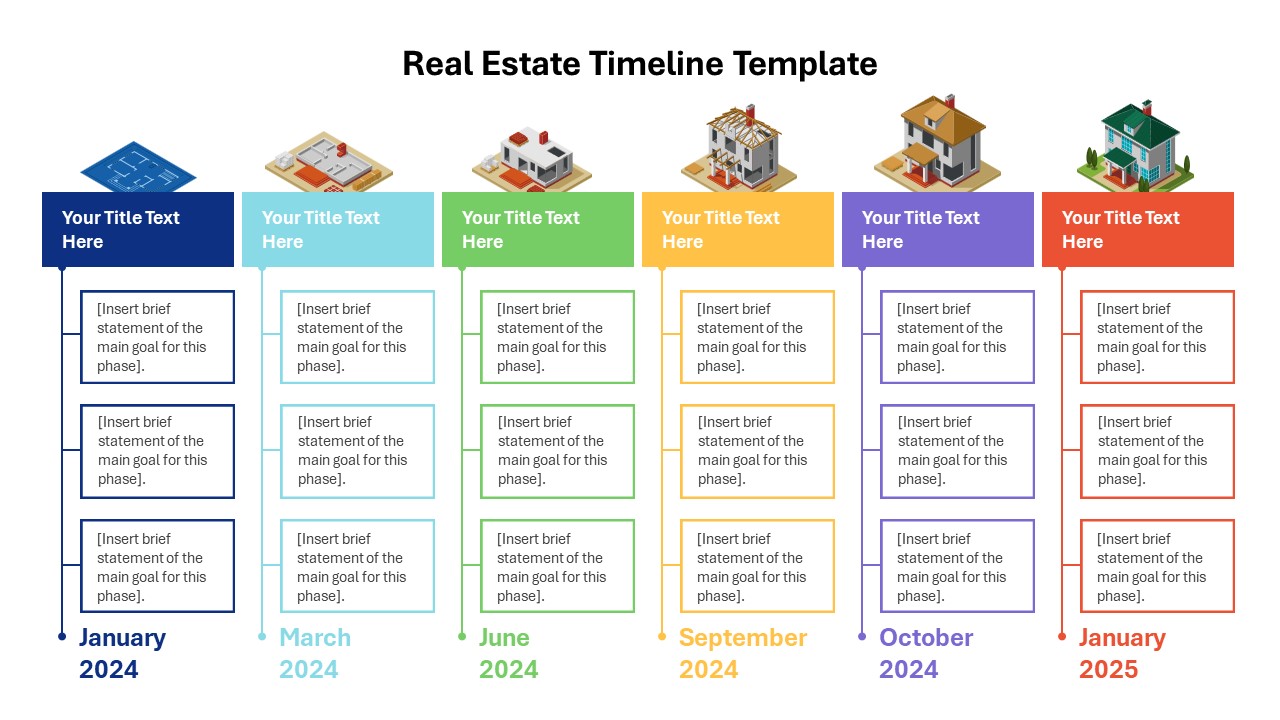
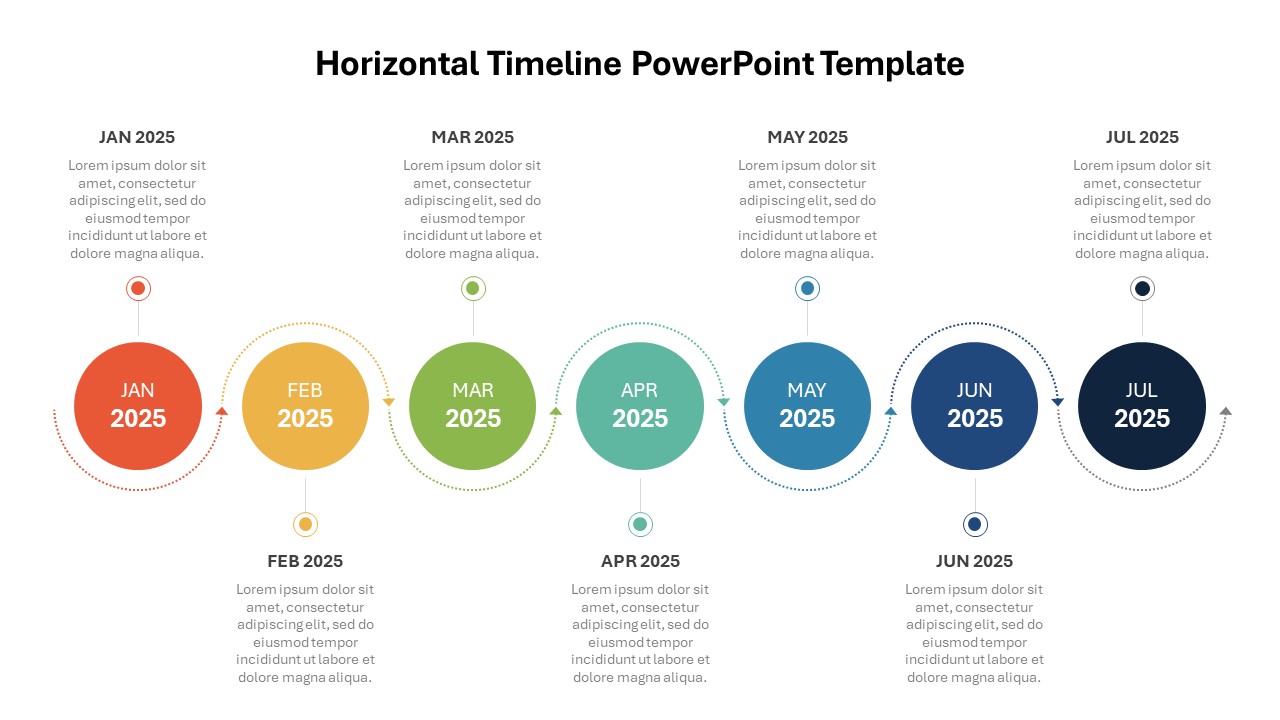
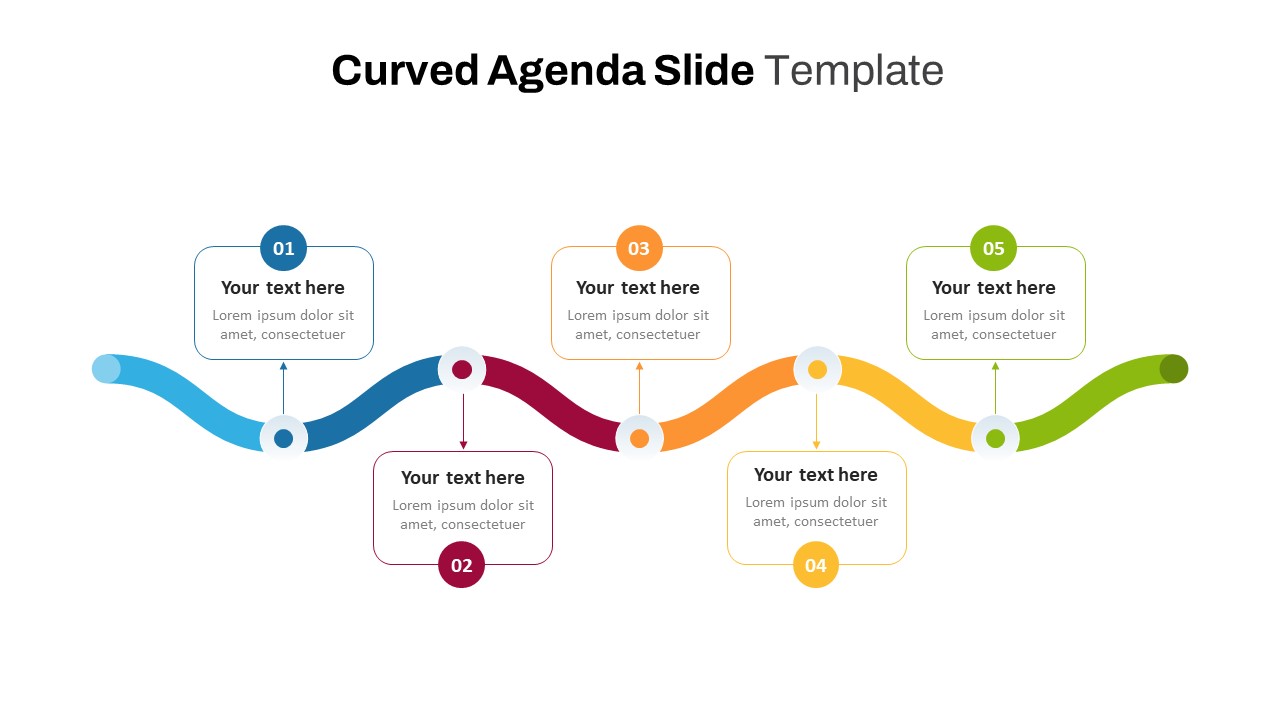
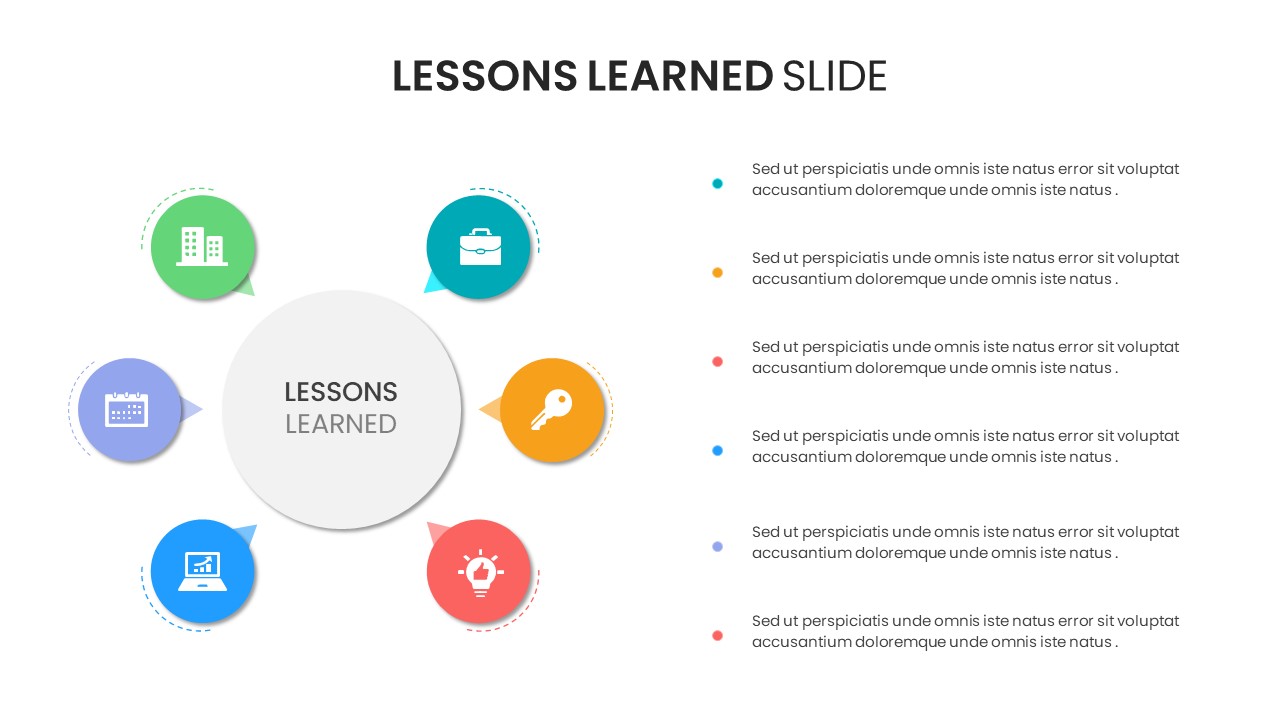
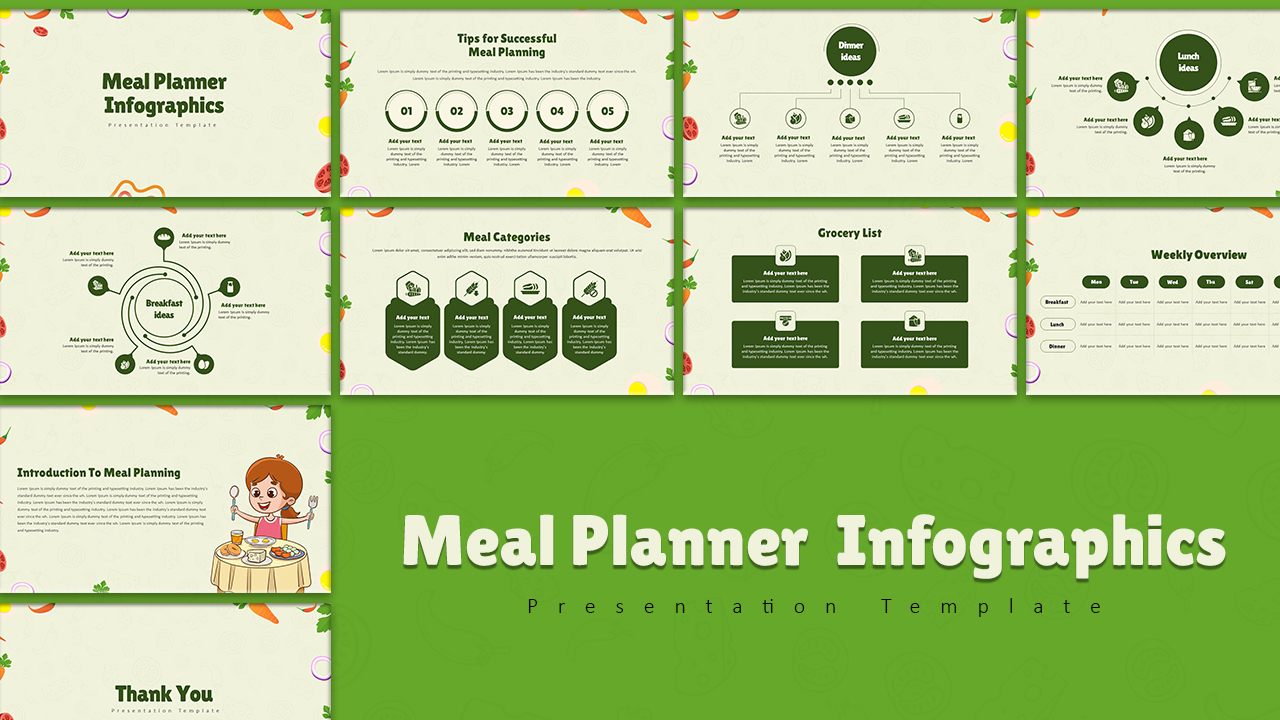
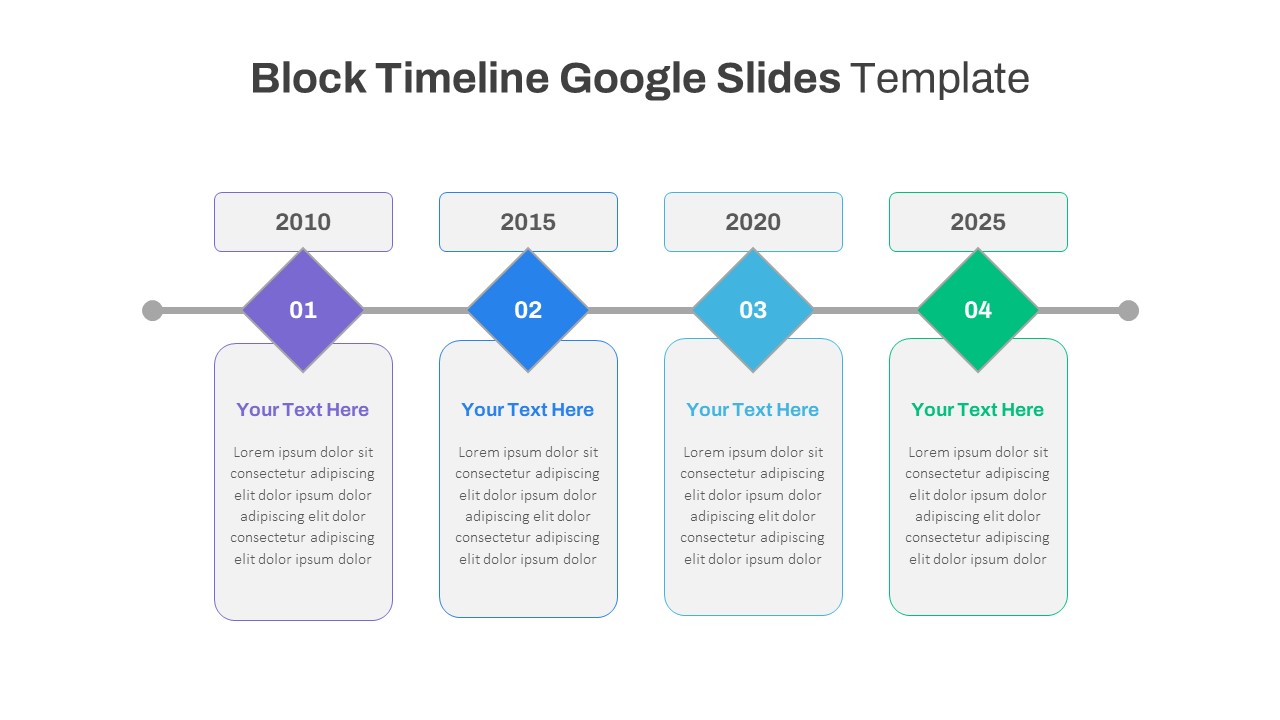
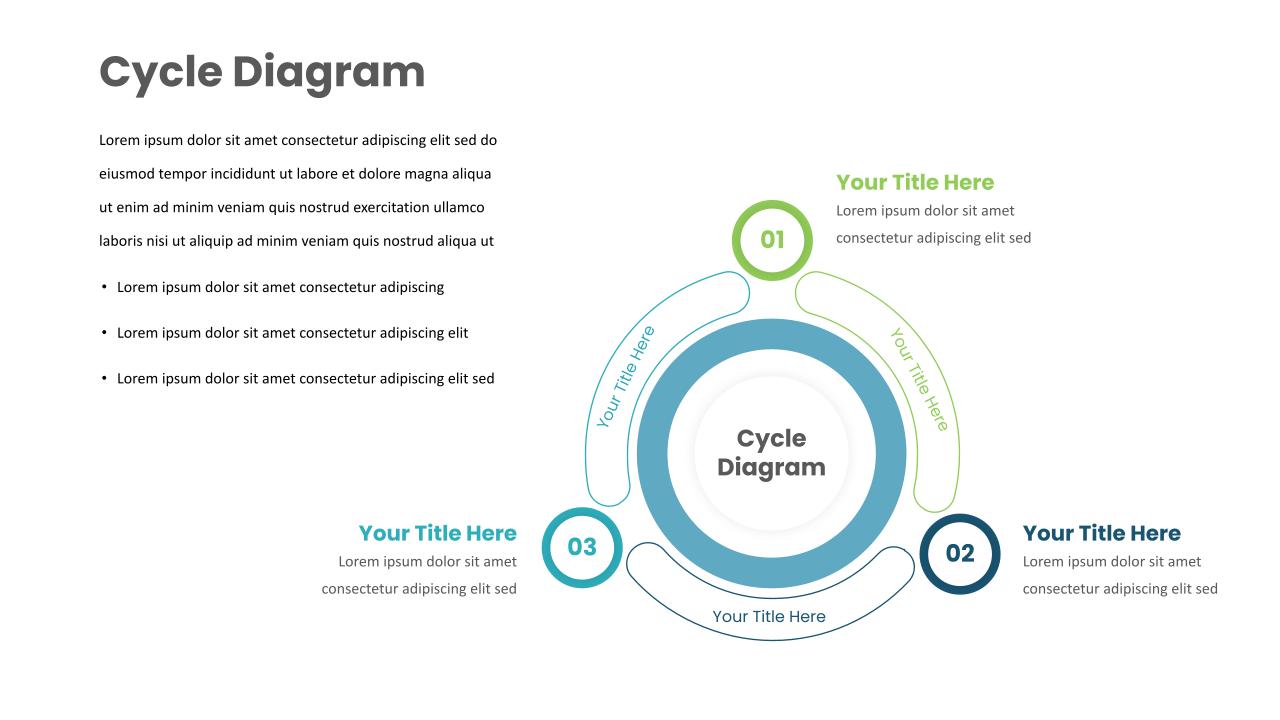
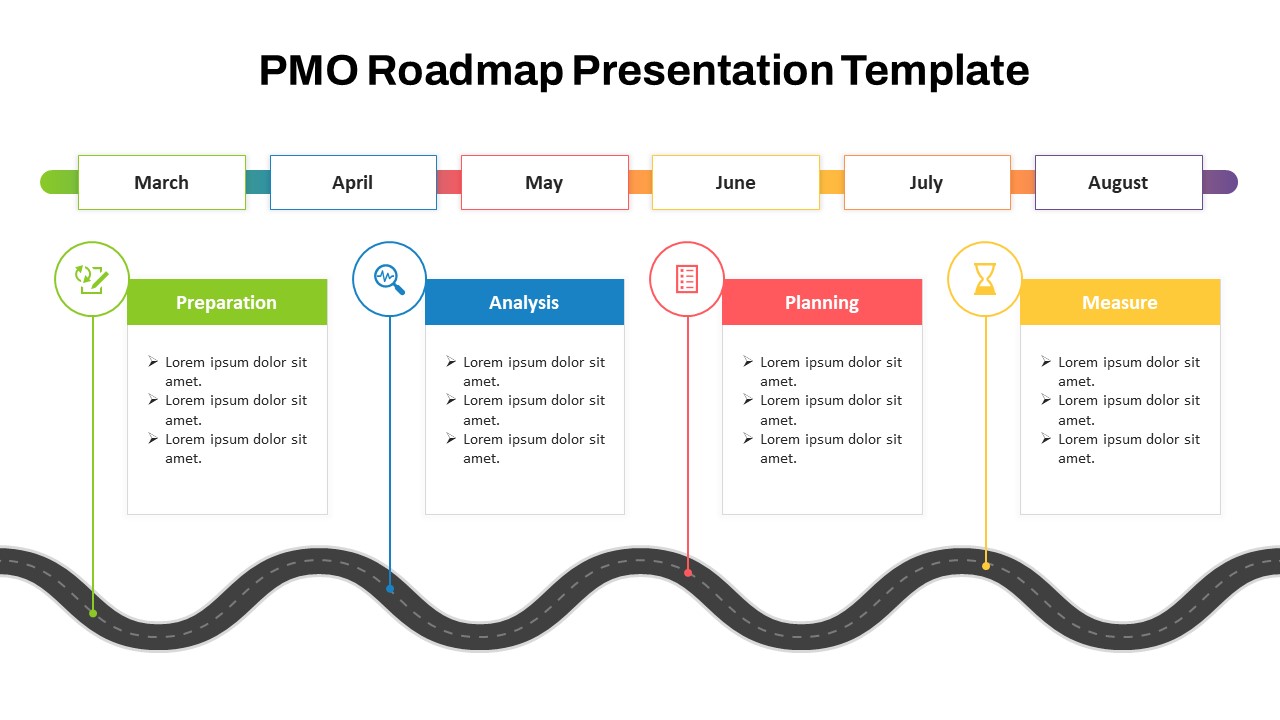
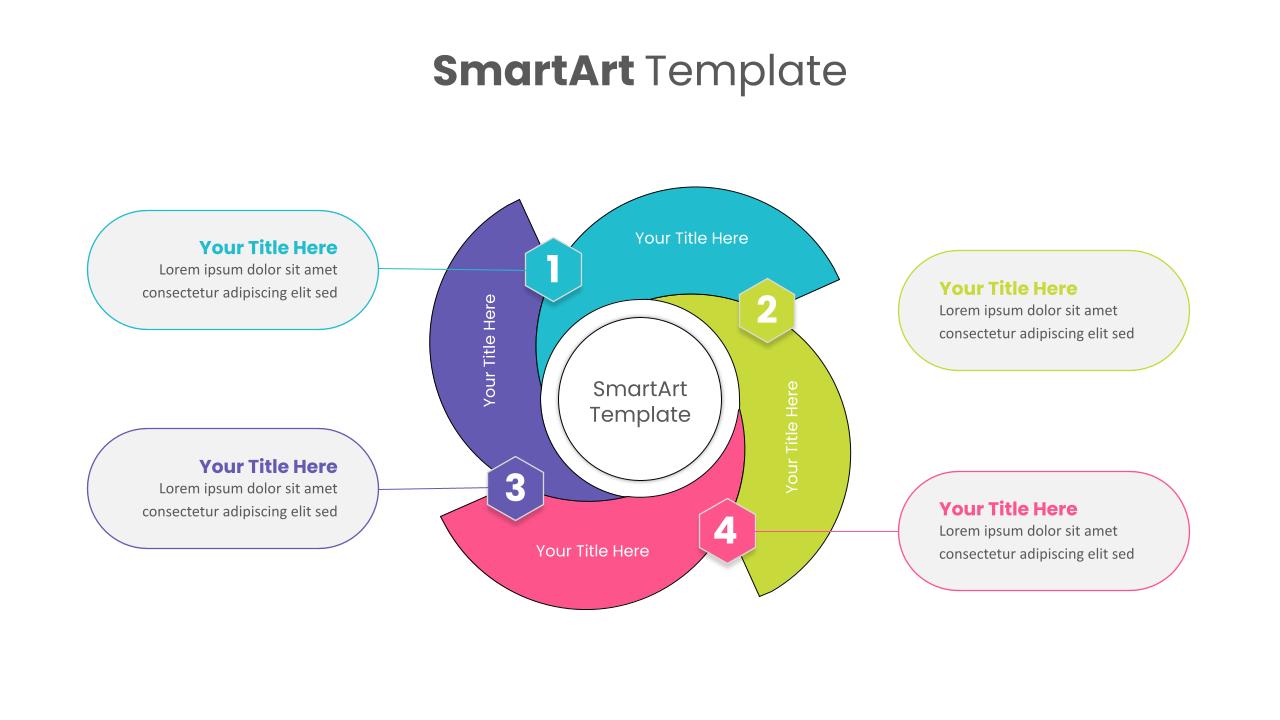
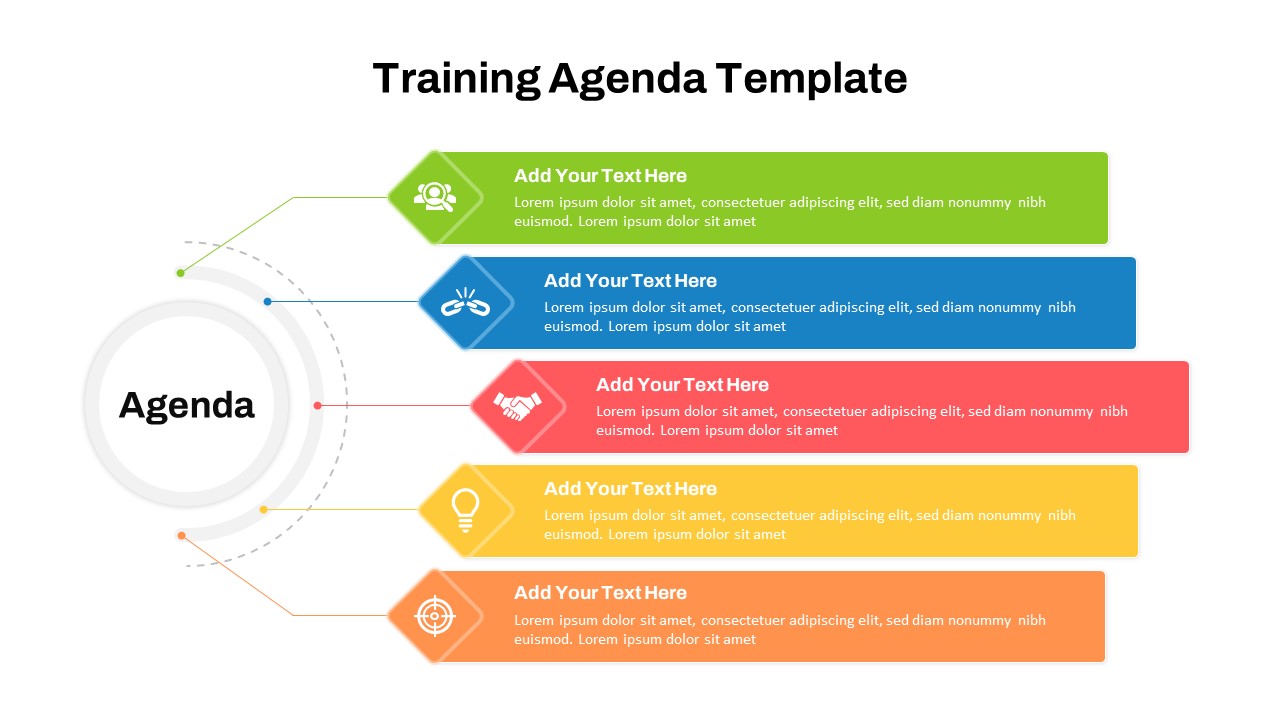
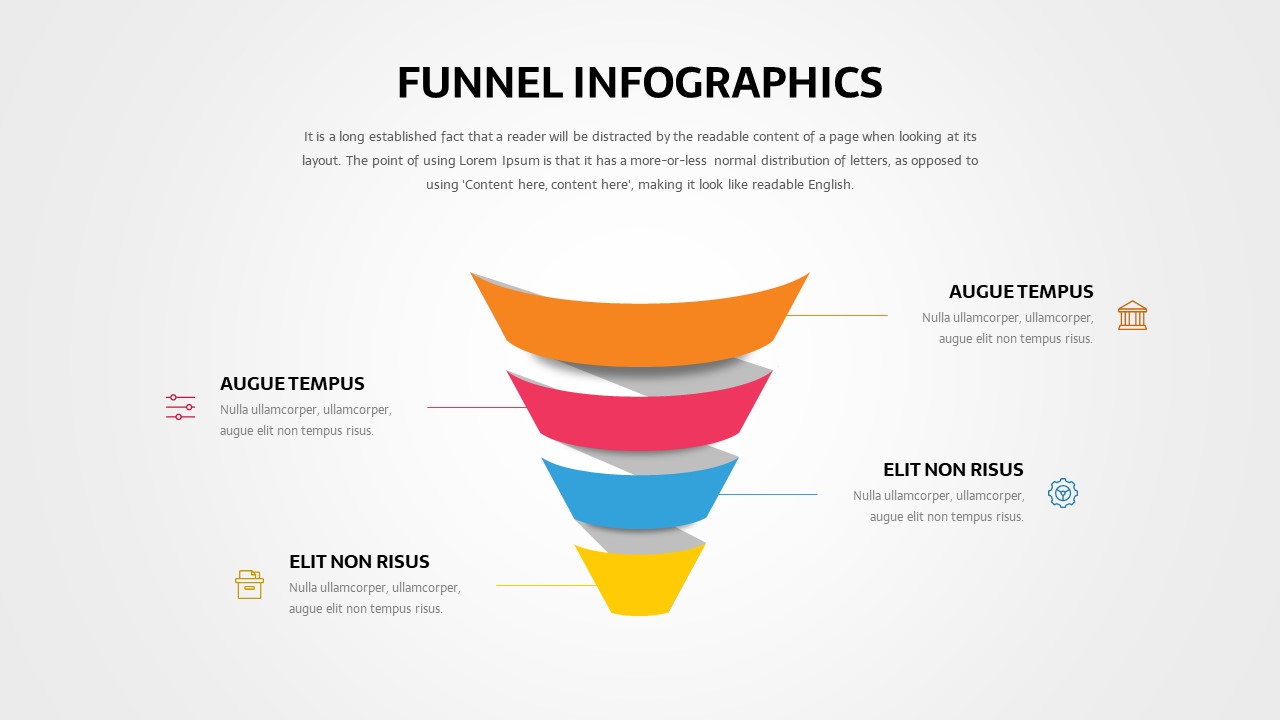
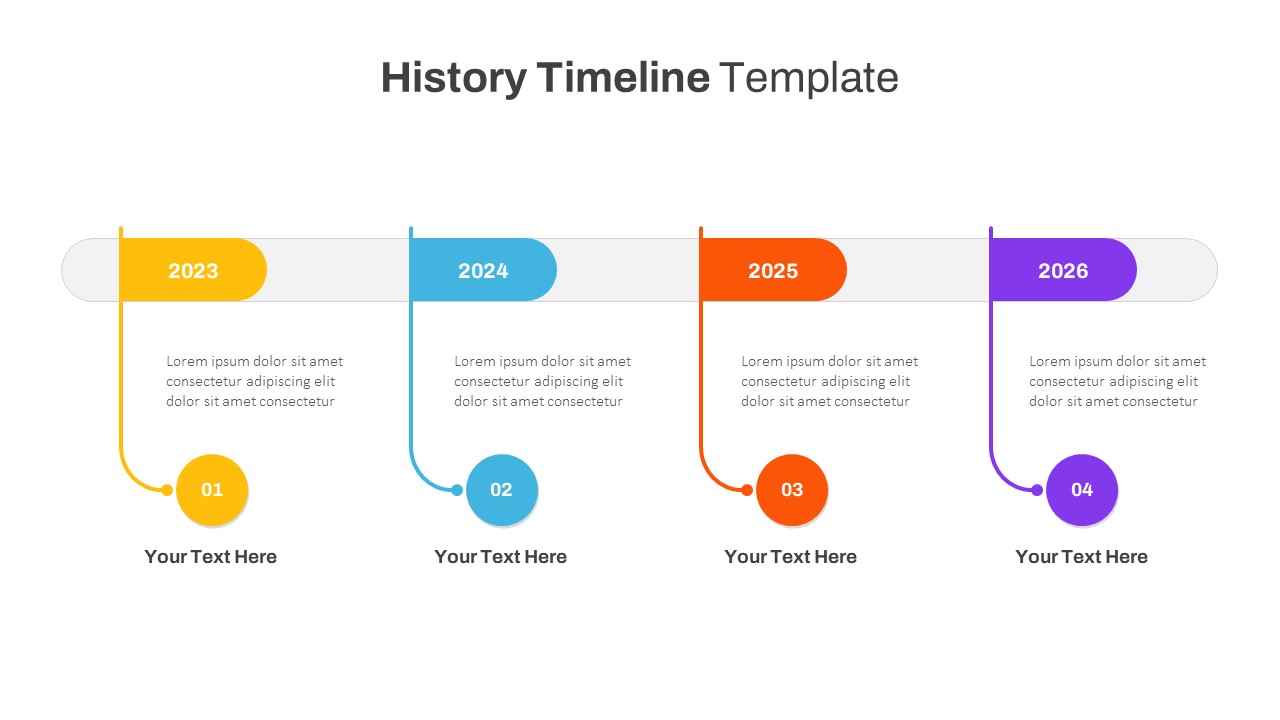
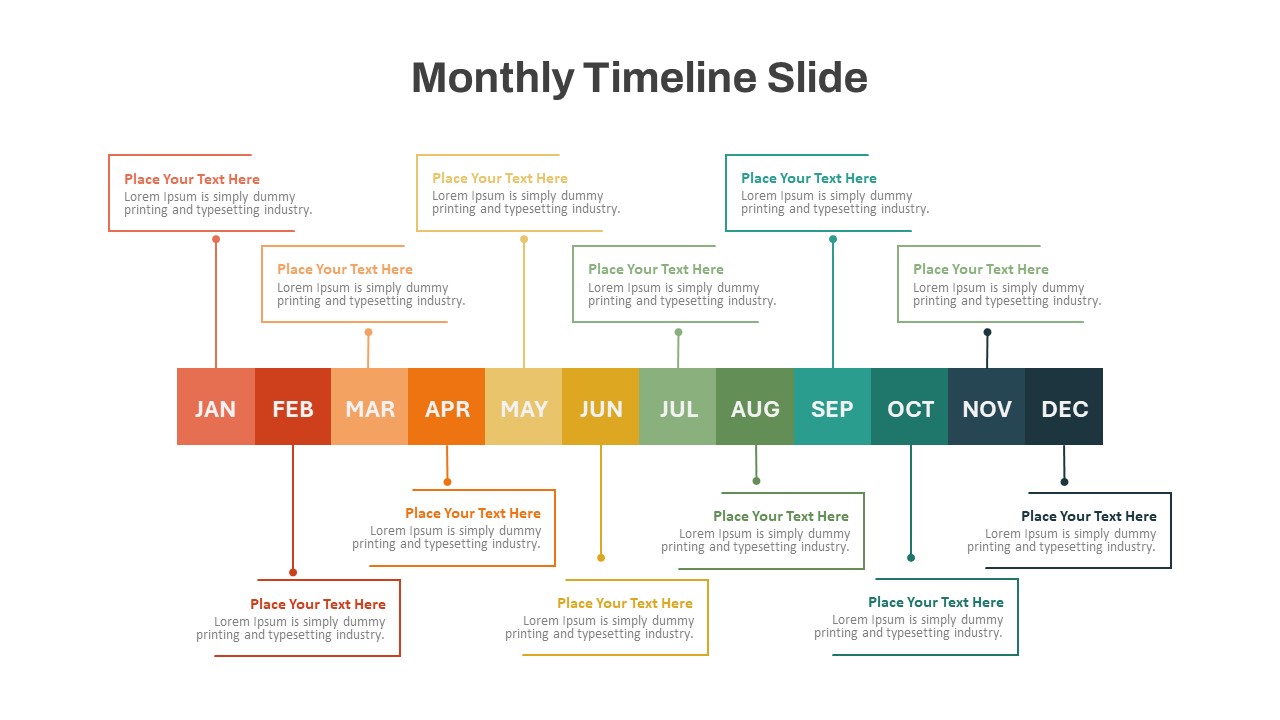
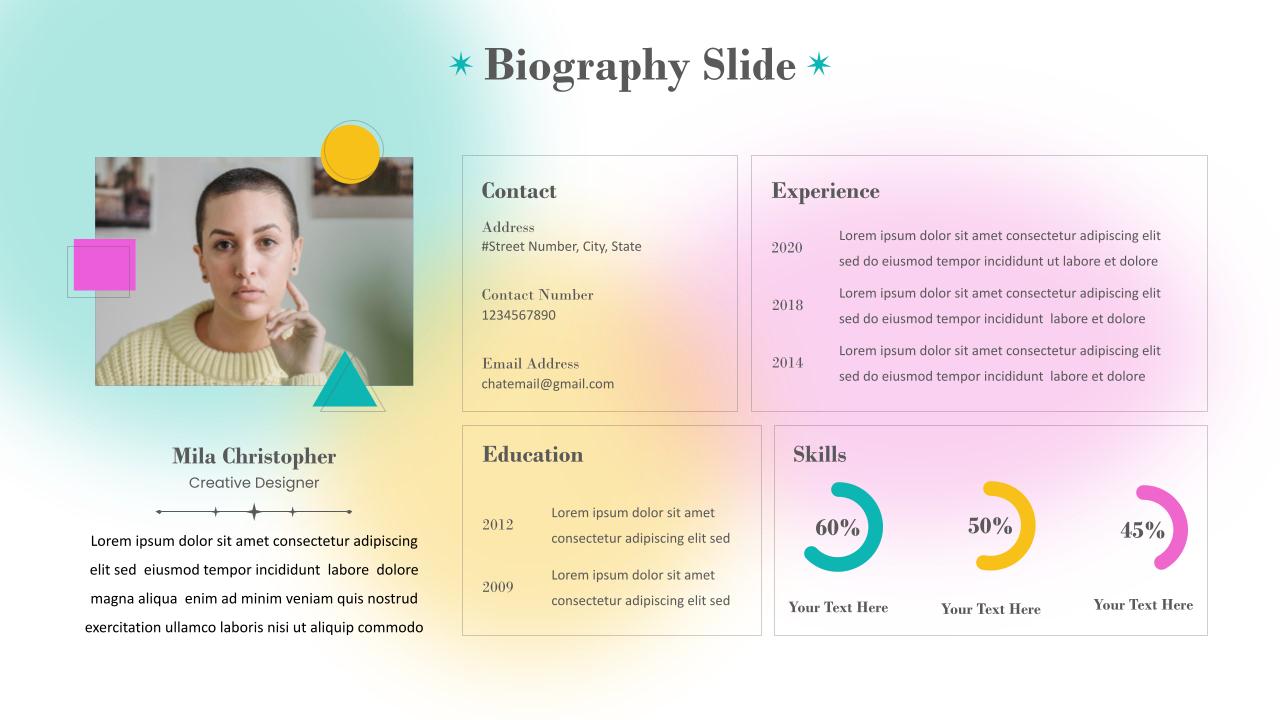
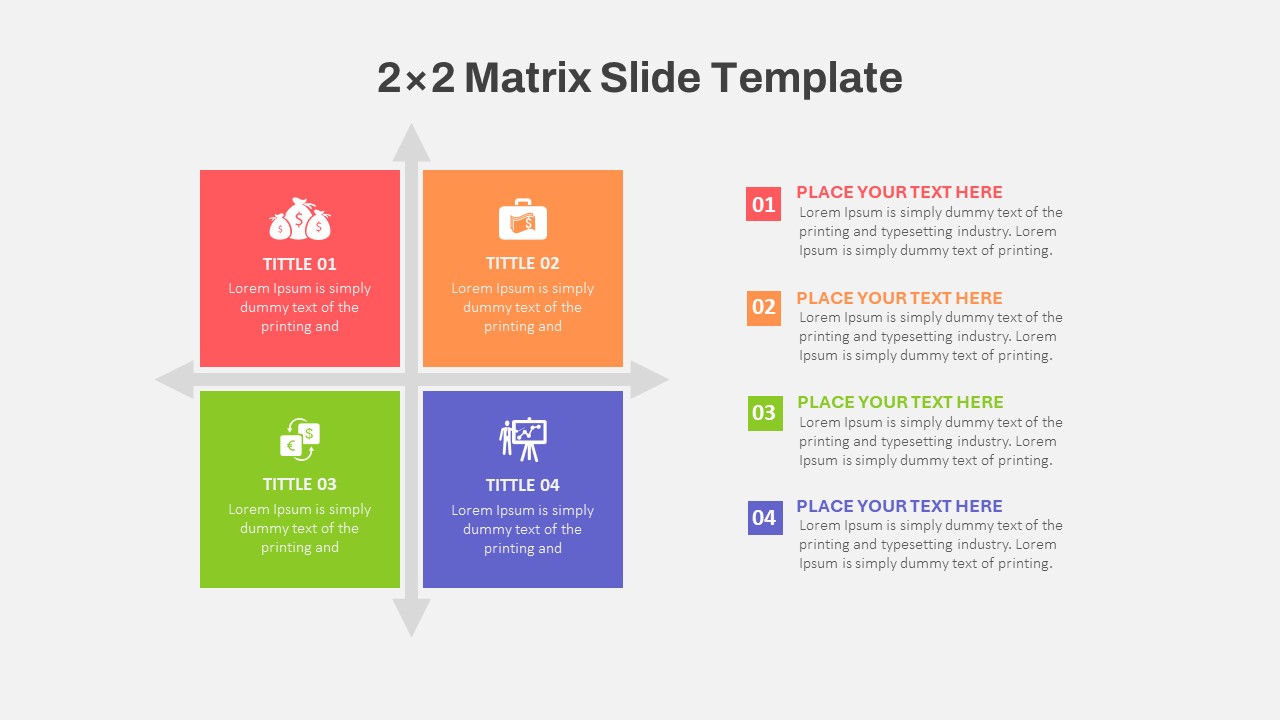
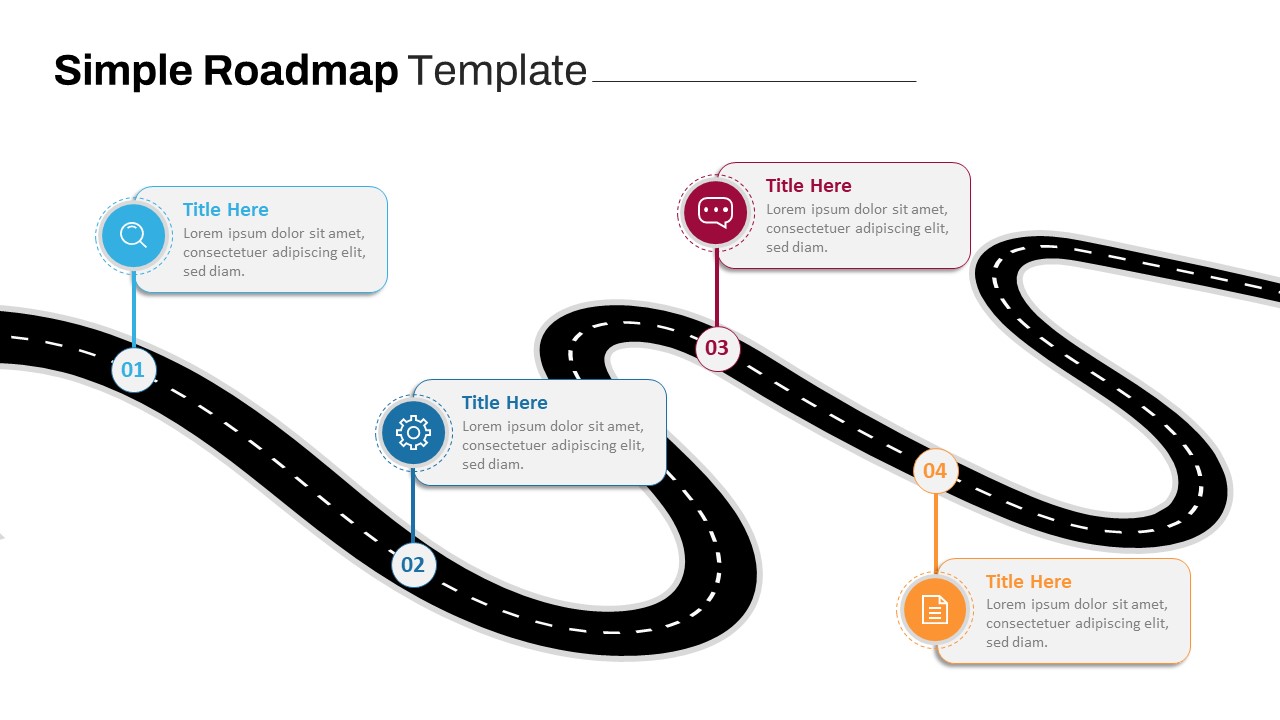
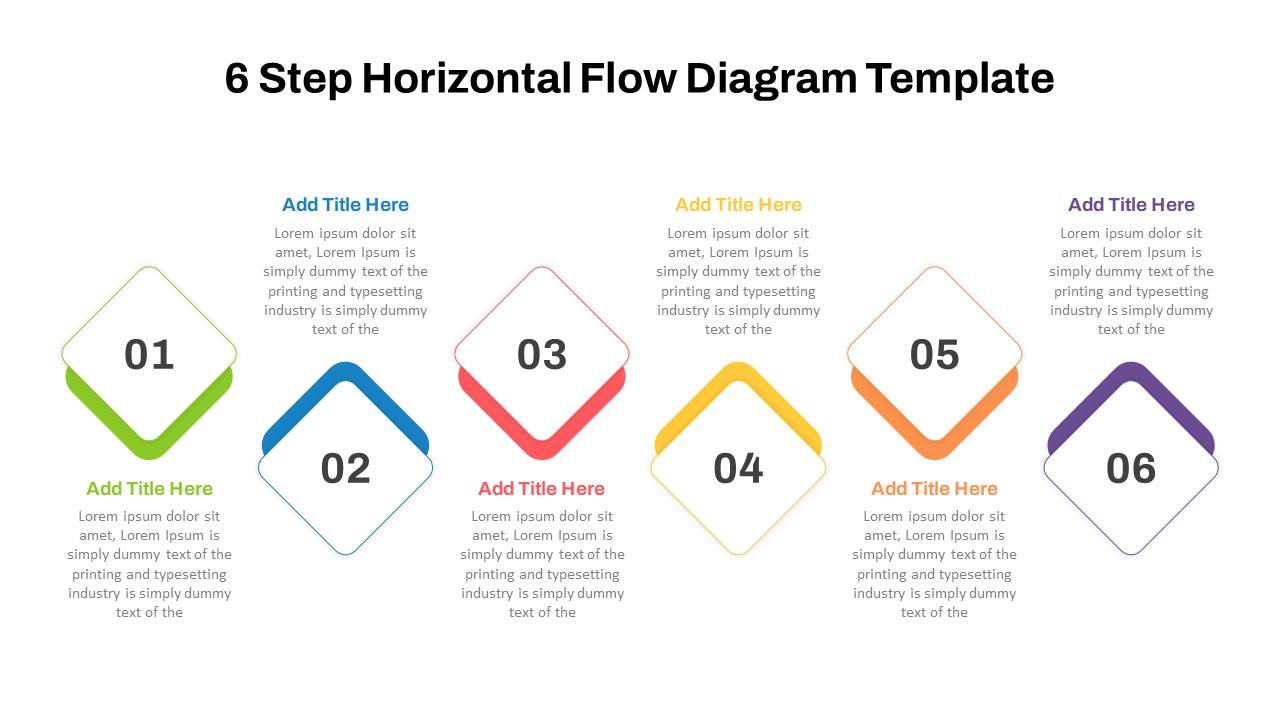
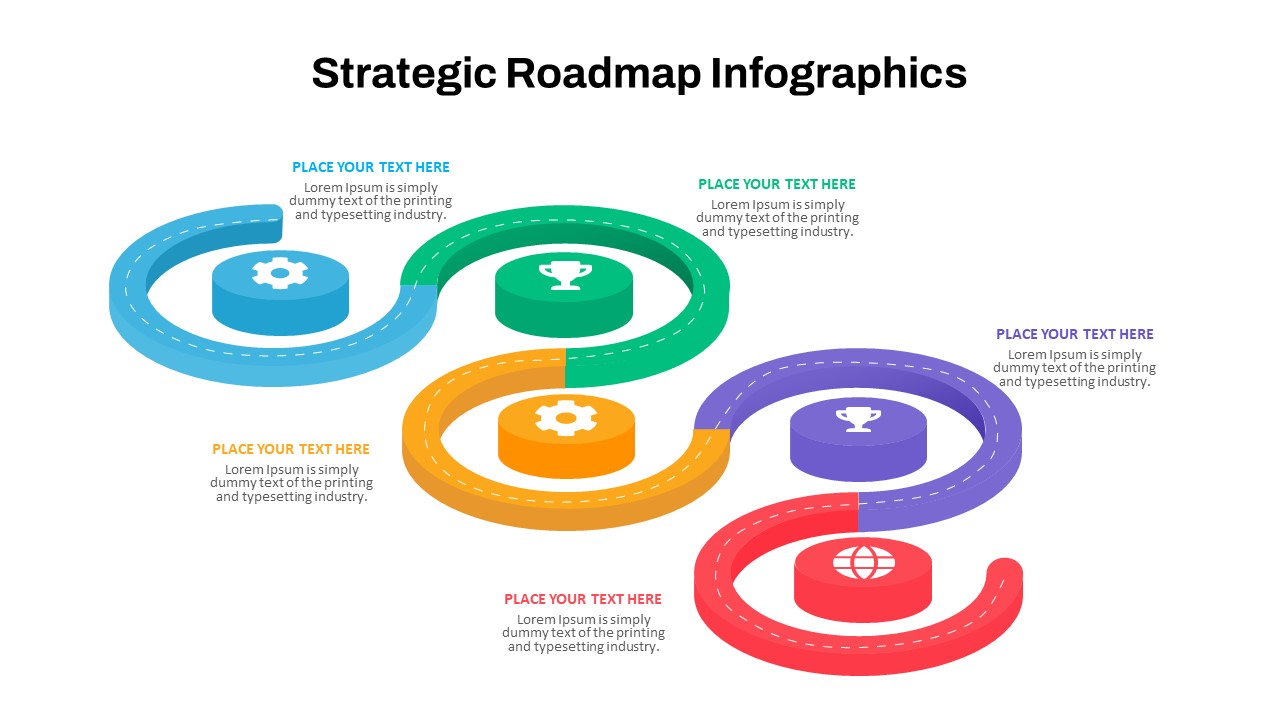
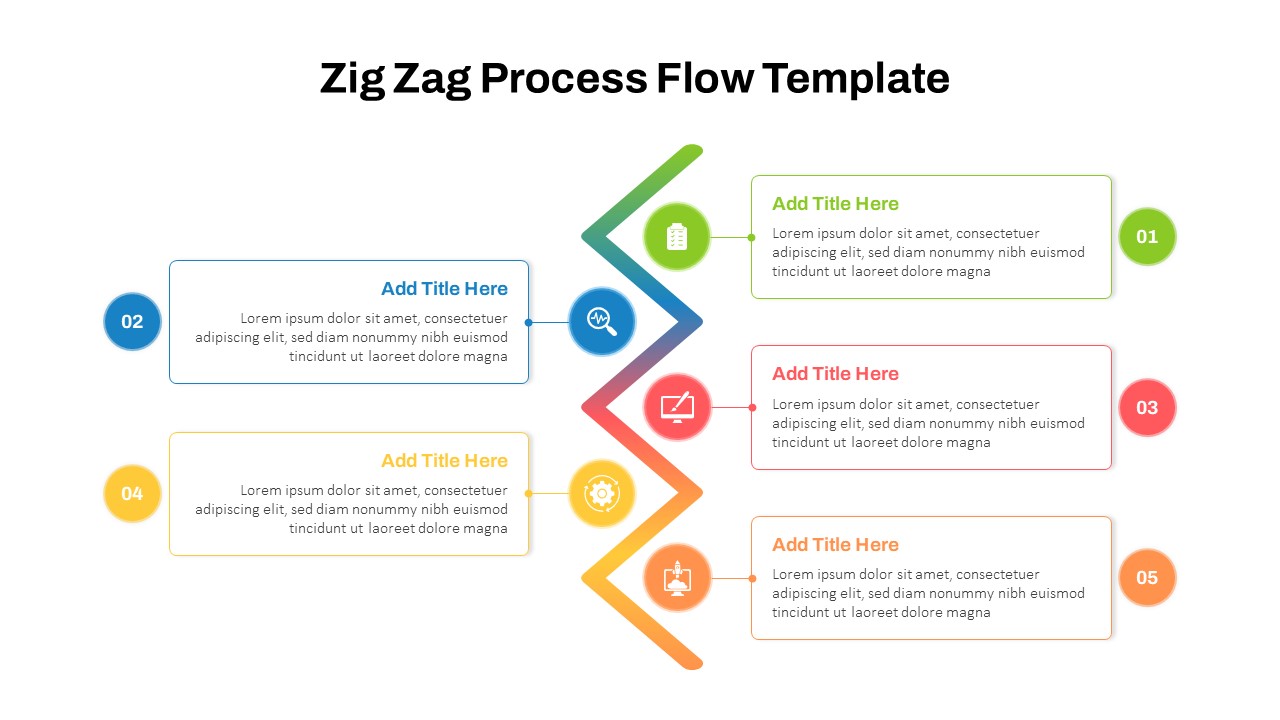
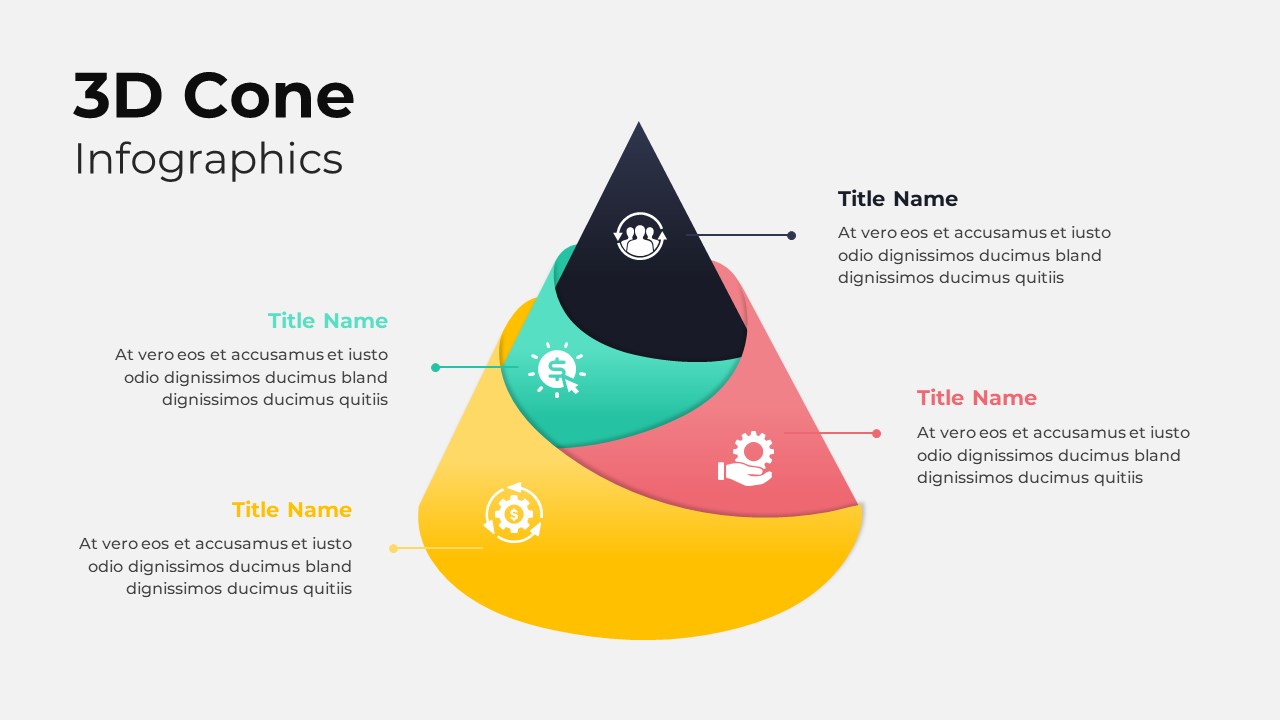
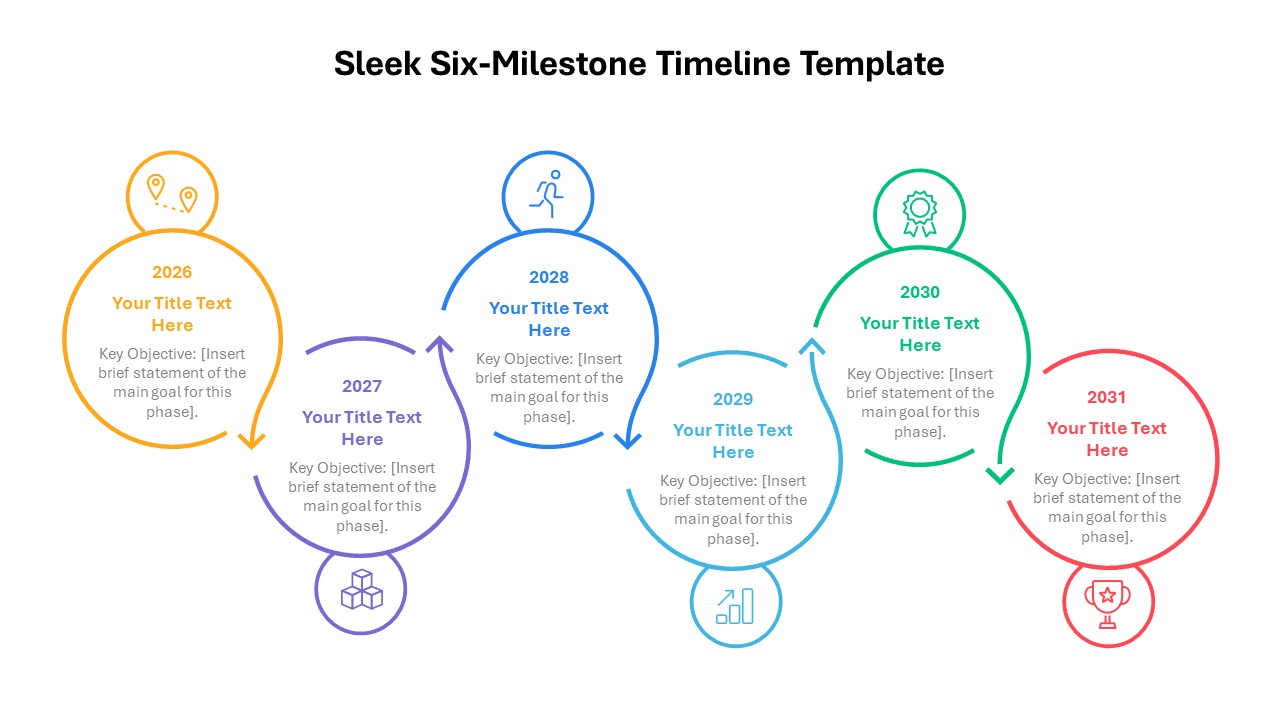
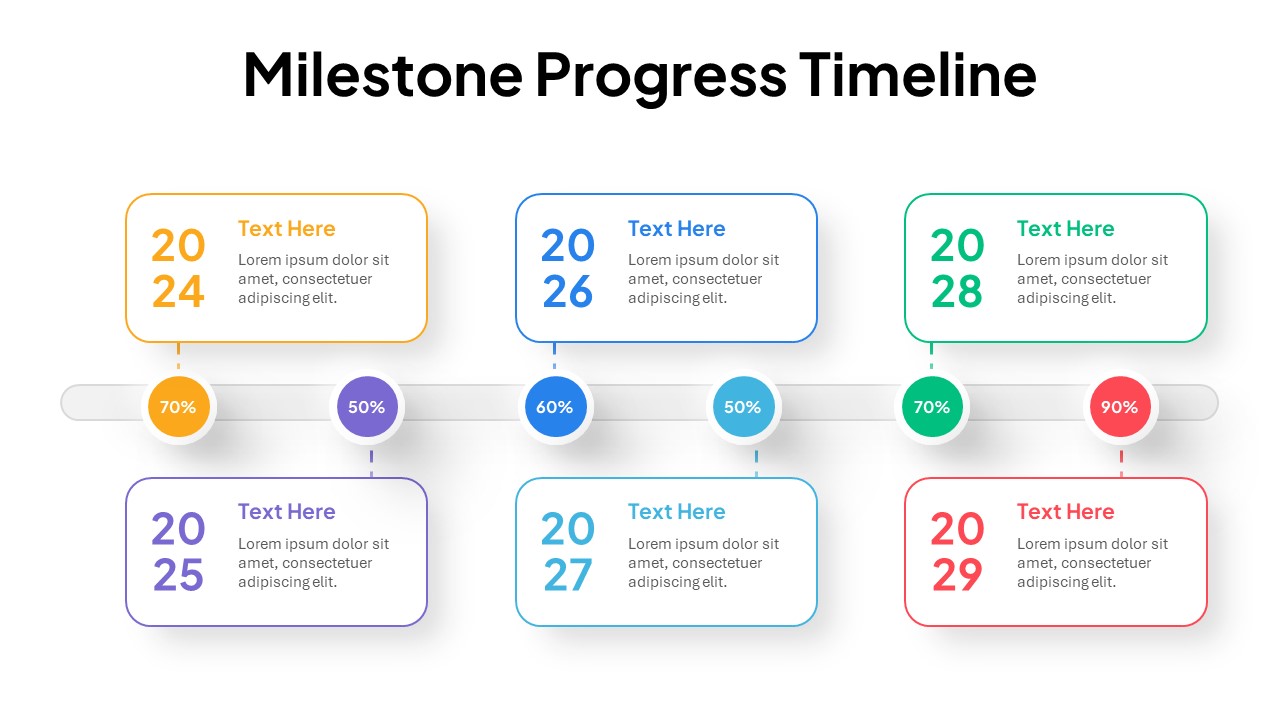
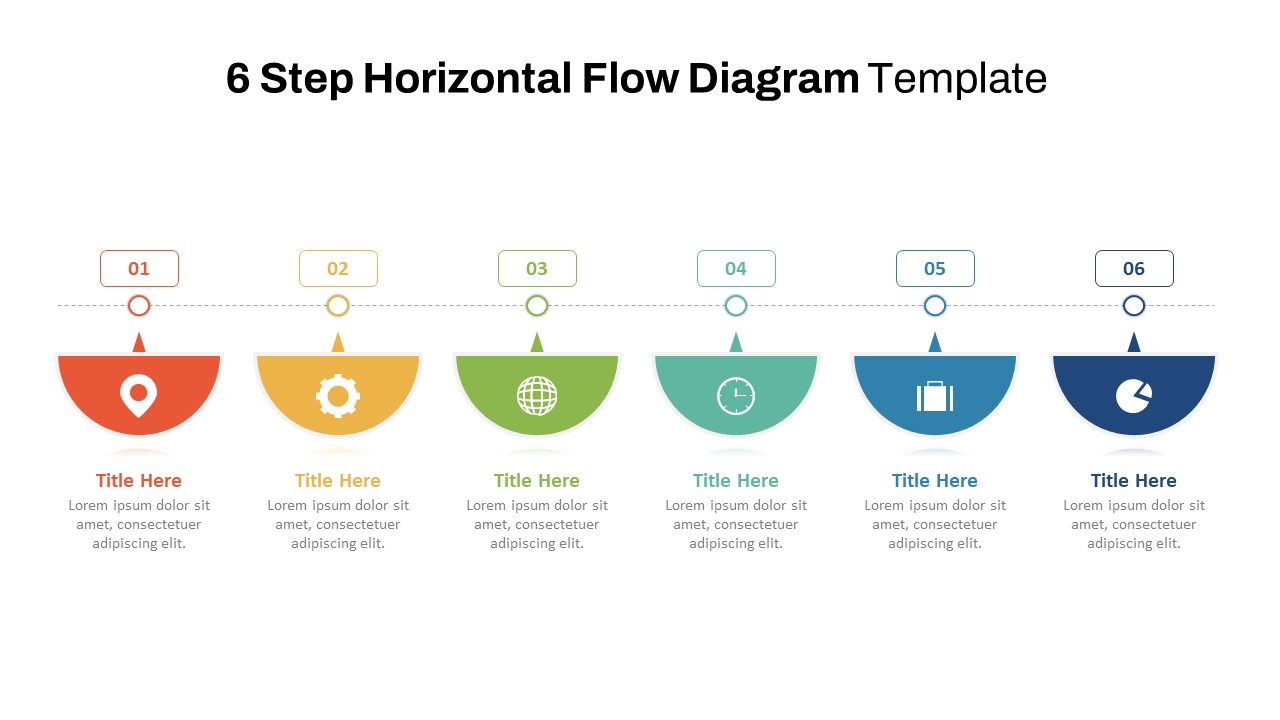
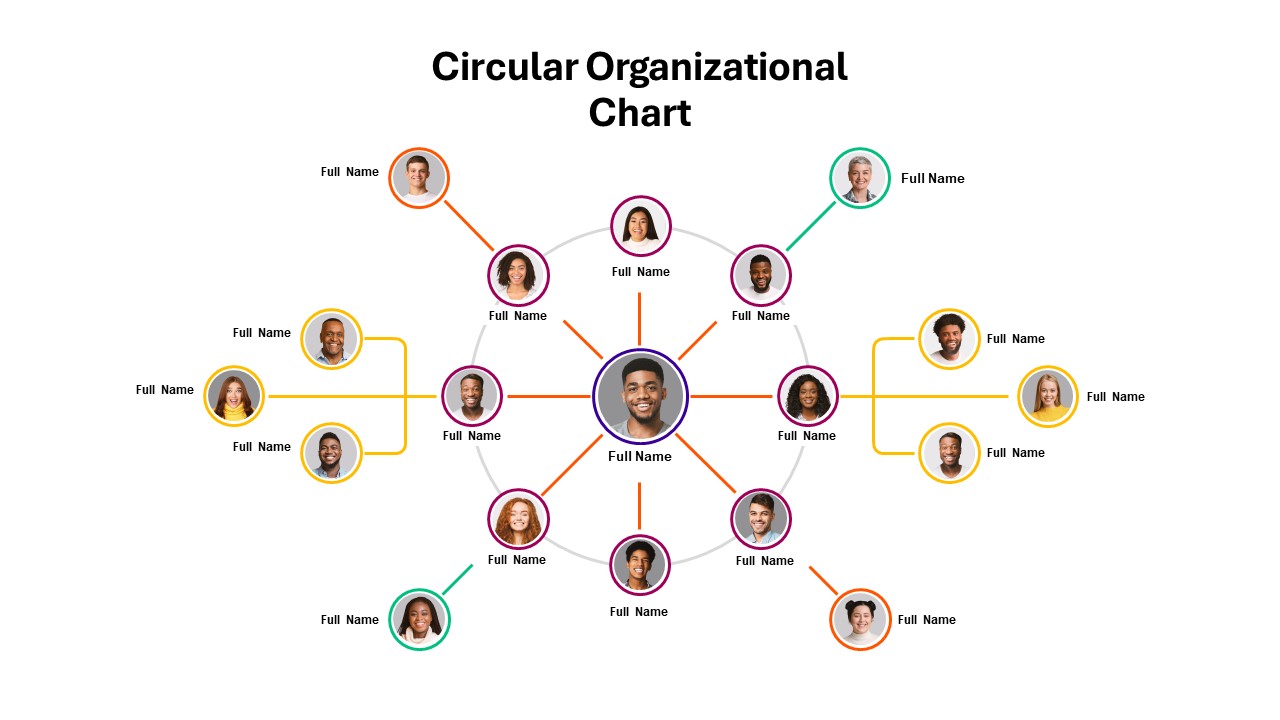
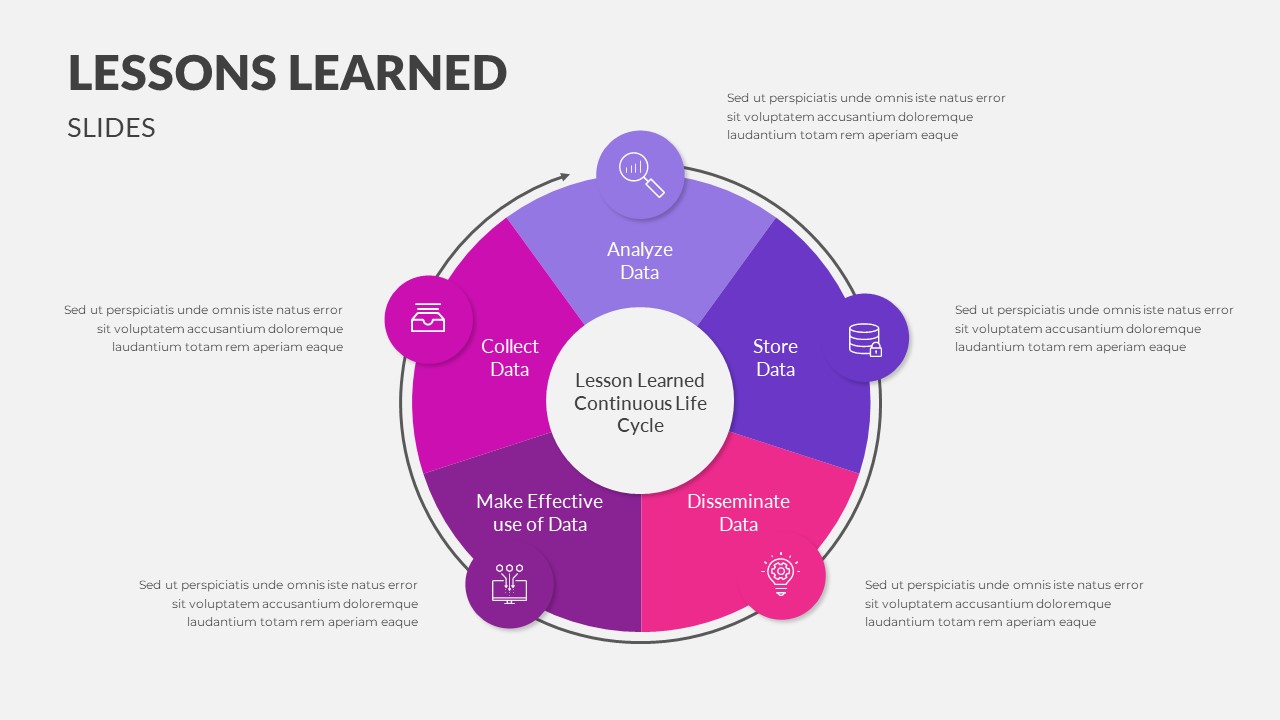
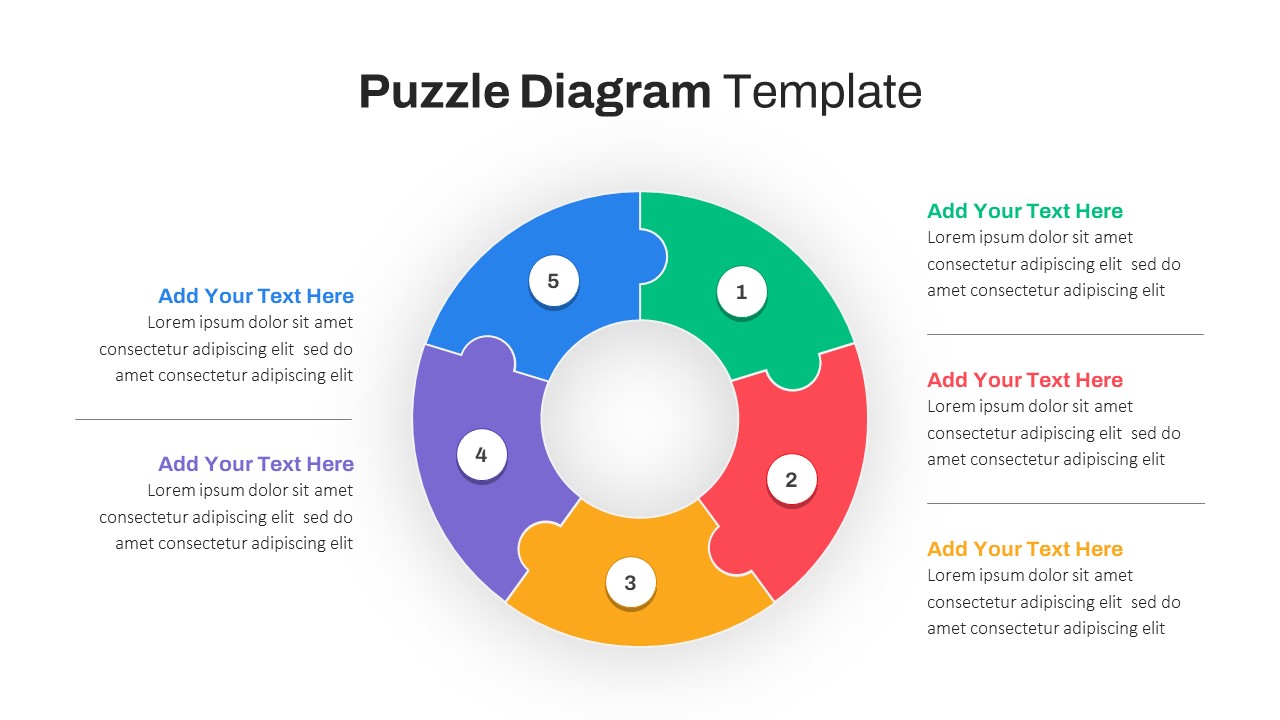
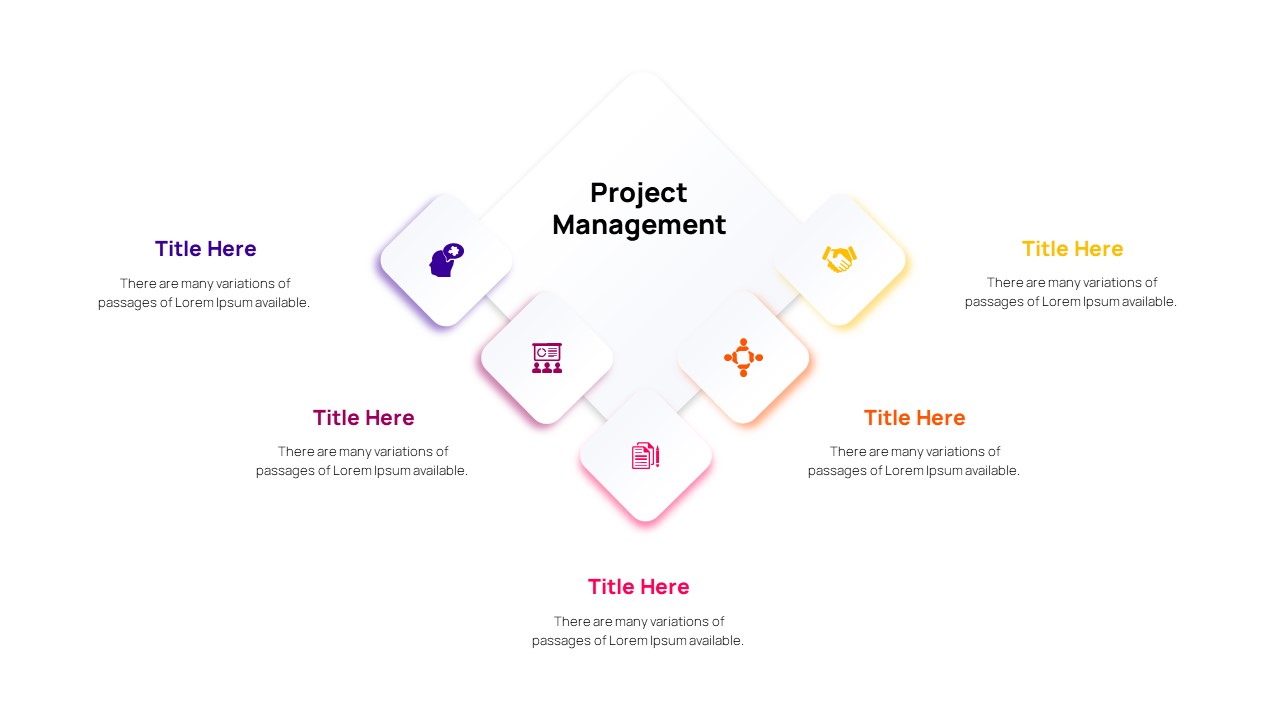
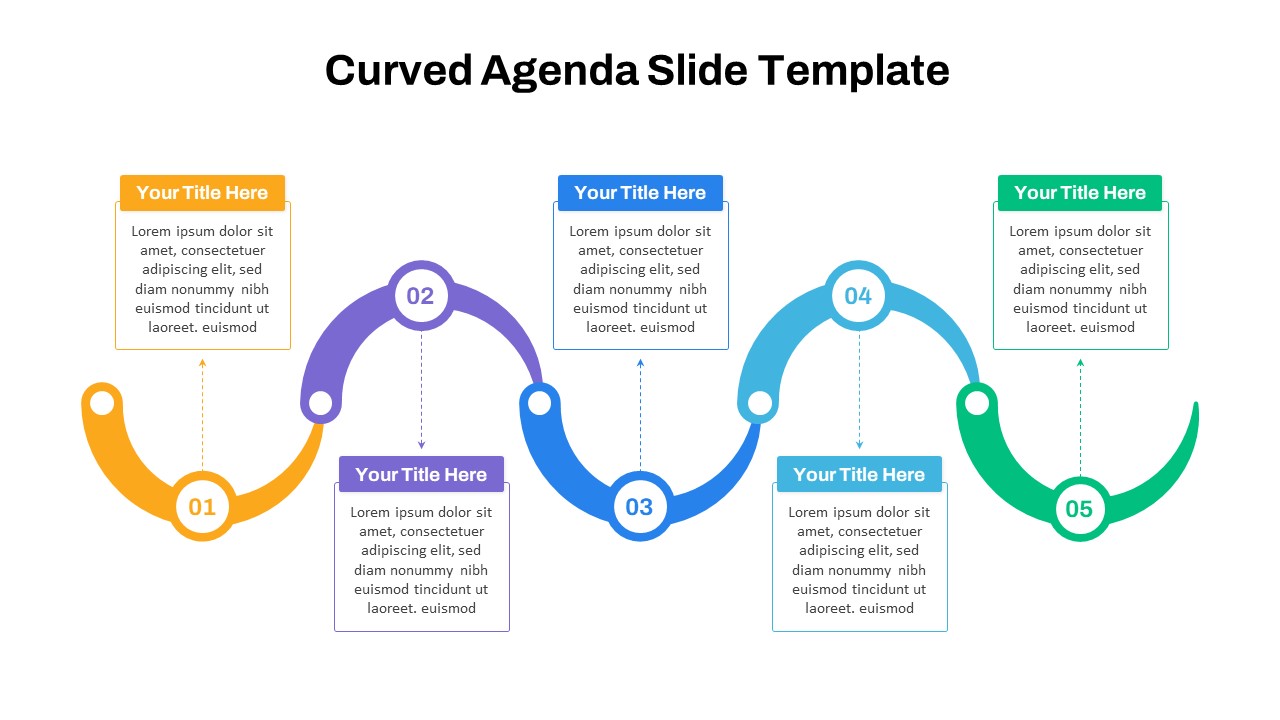
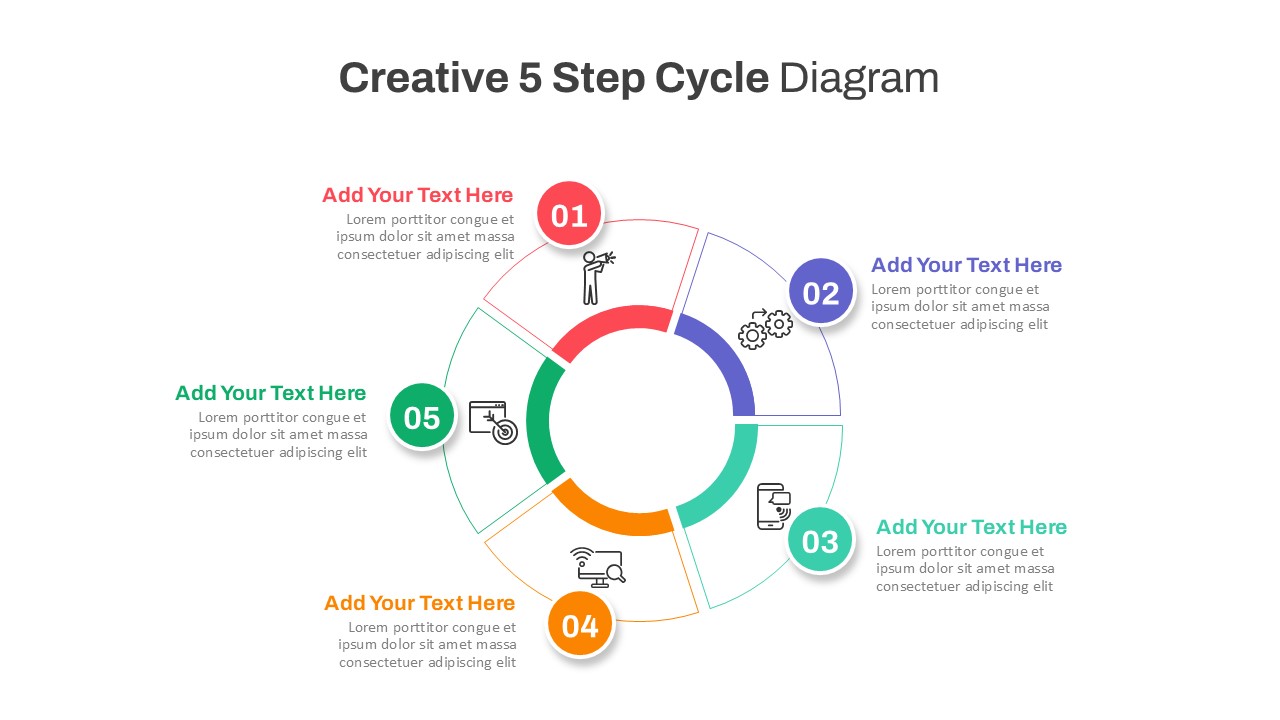
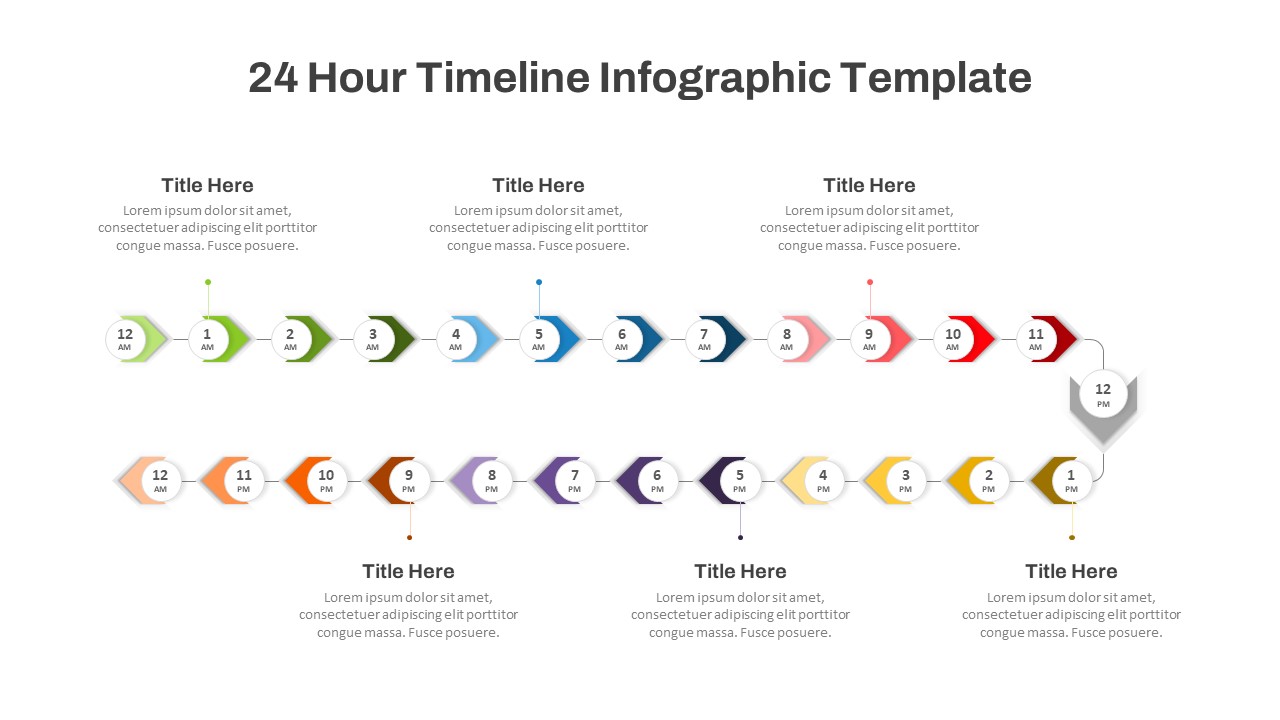
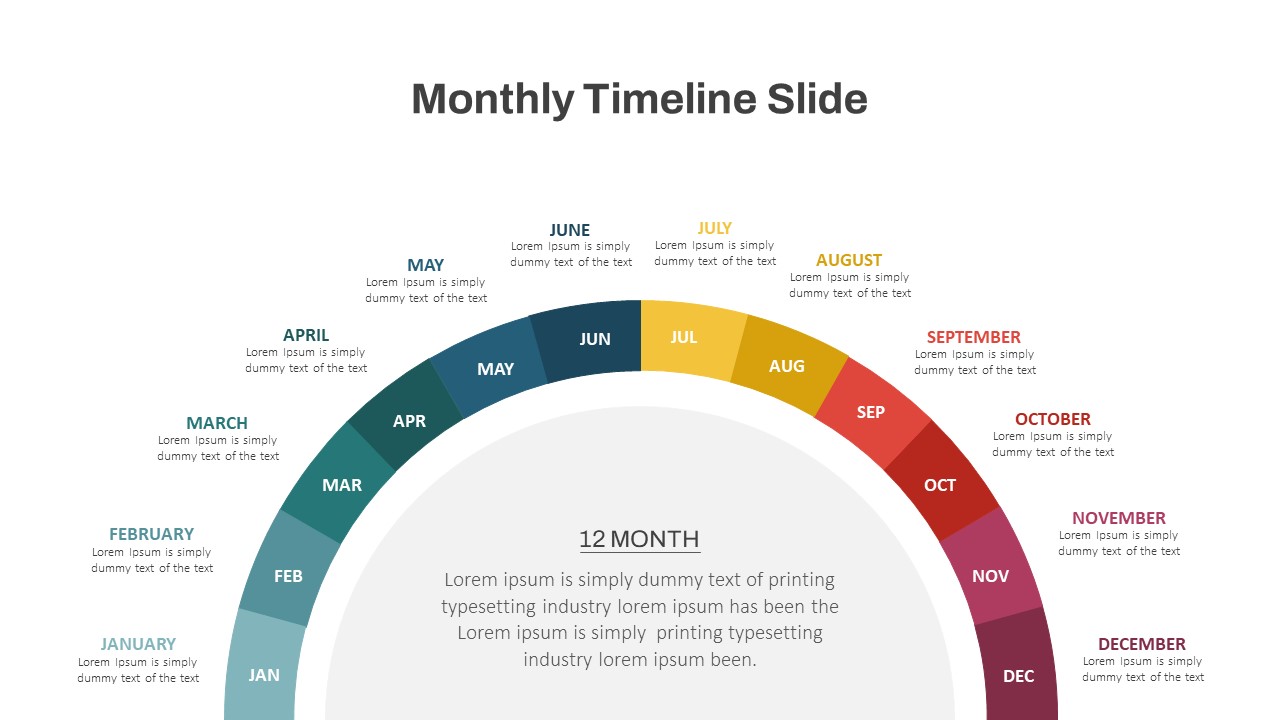
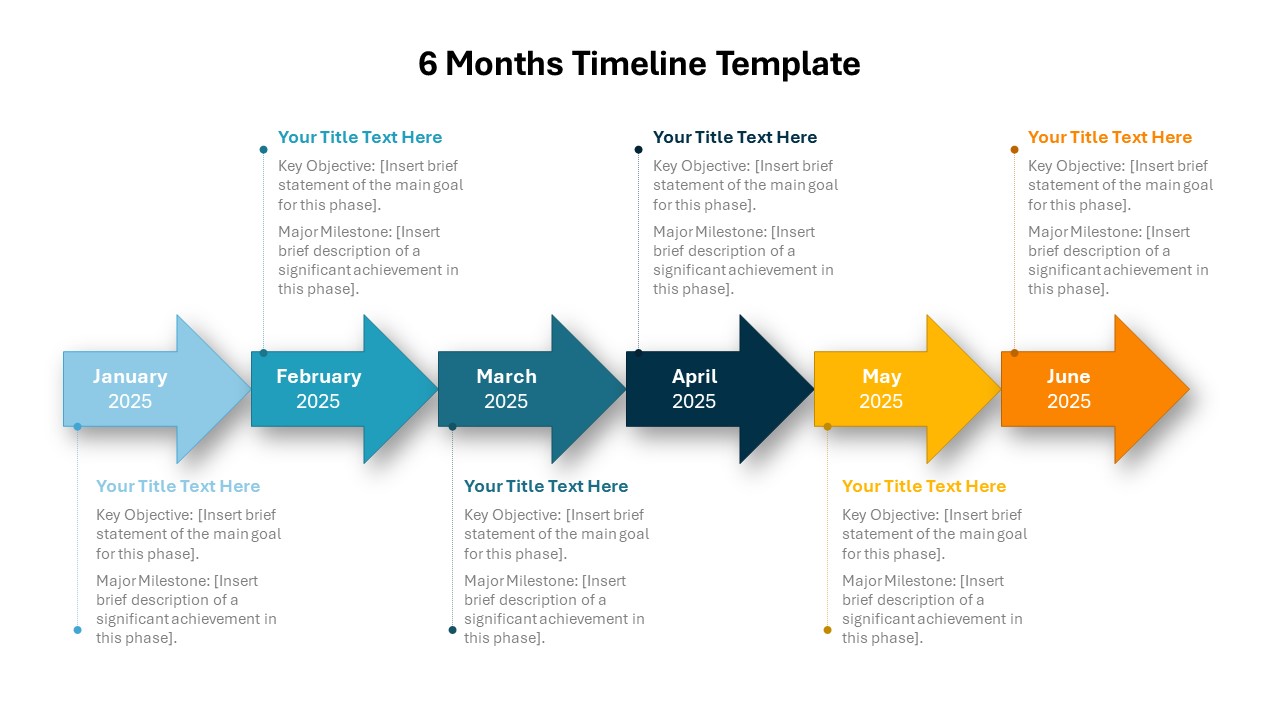
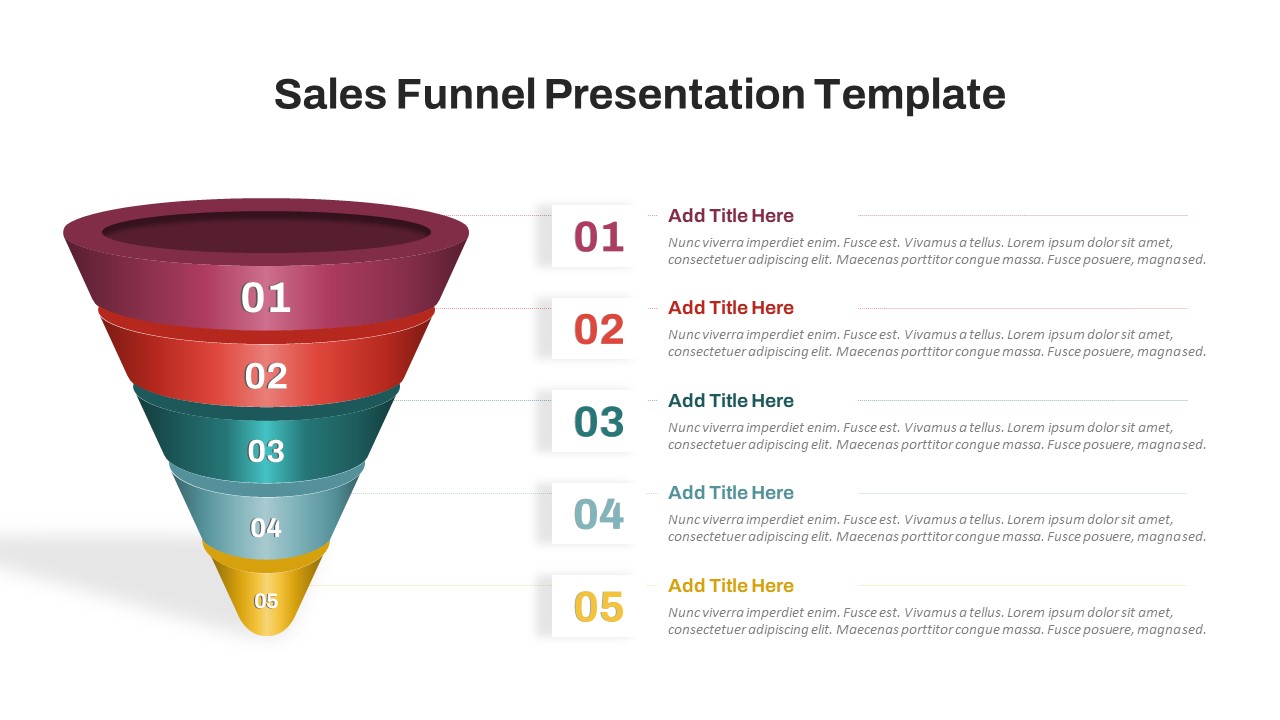
The Project Management Infographics Template is an ideal tool for project managers, team leaders, and business professionals seeking to present project plans and progress visually and effectively. This template features a modern, circular infographic design that segments information into five distinct sections, each represented by an icon and a color-coded area. The infographic is complemented by corresponding text areas, allowing for detailed descriptions and explanations.
Key Features:
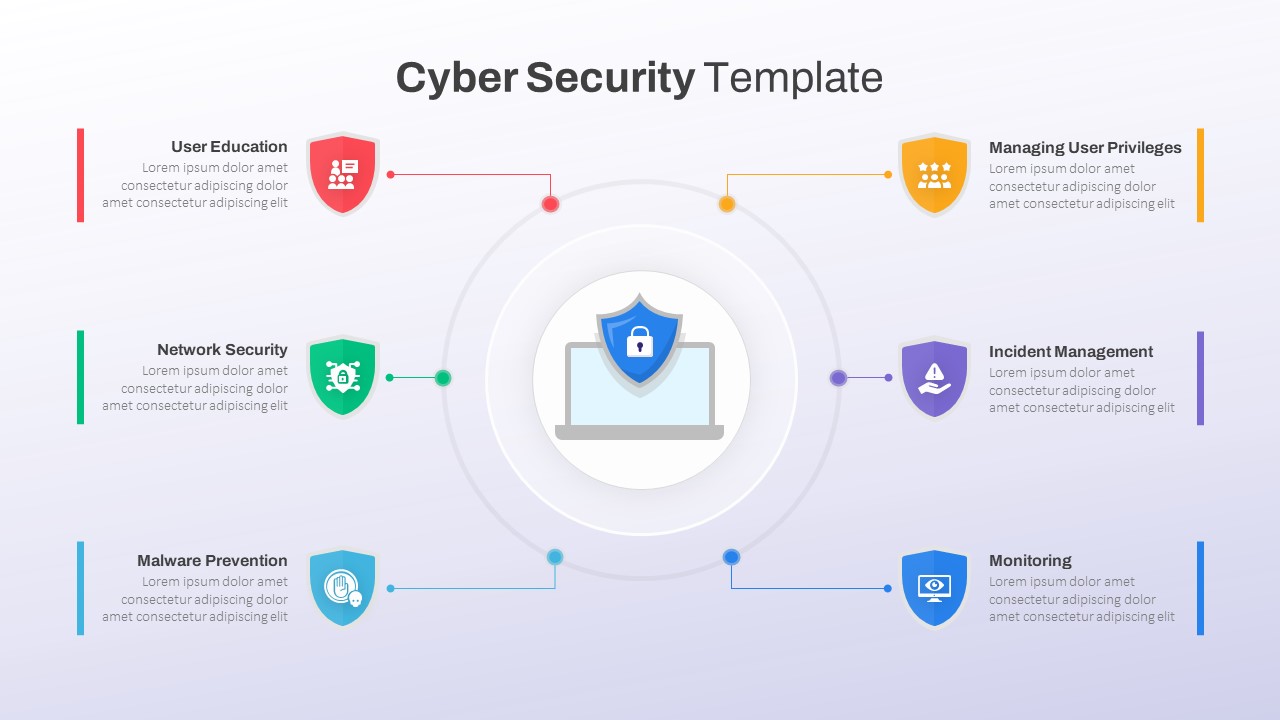
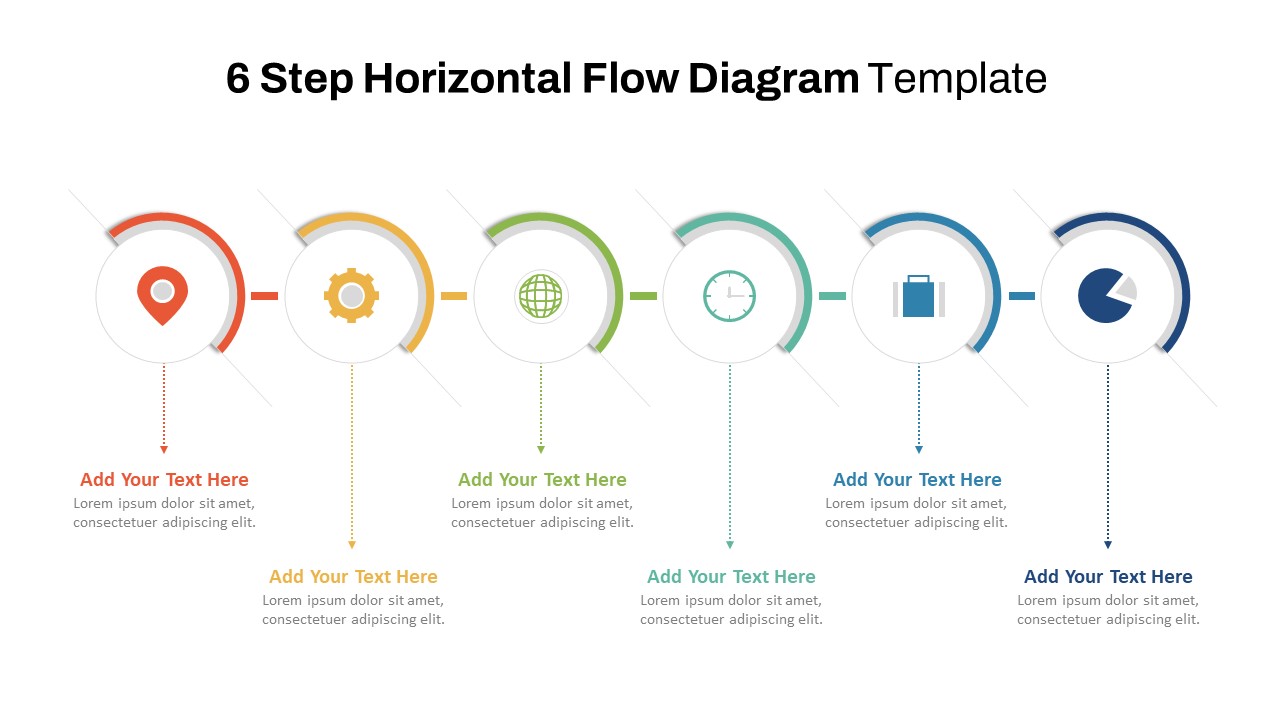
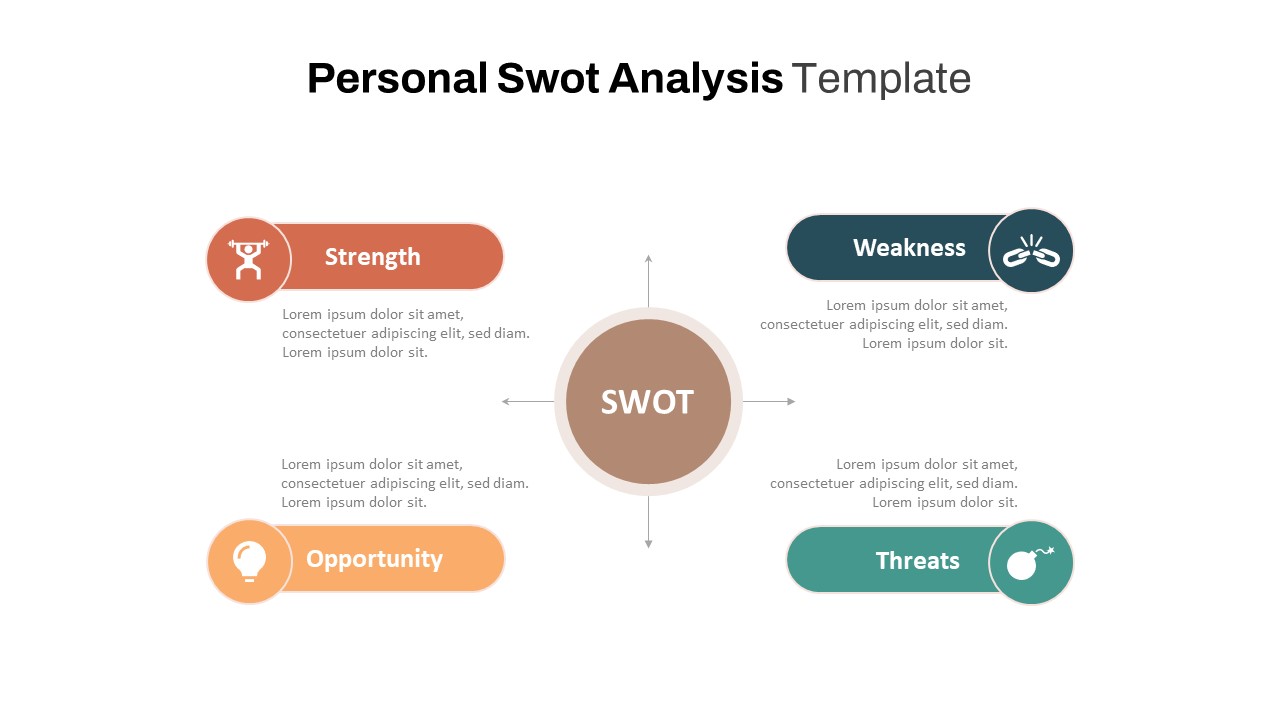
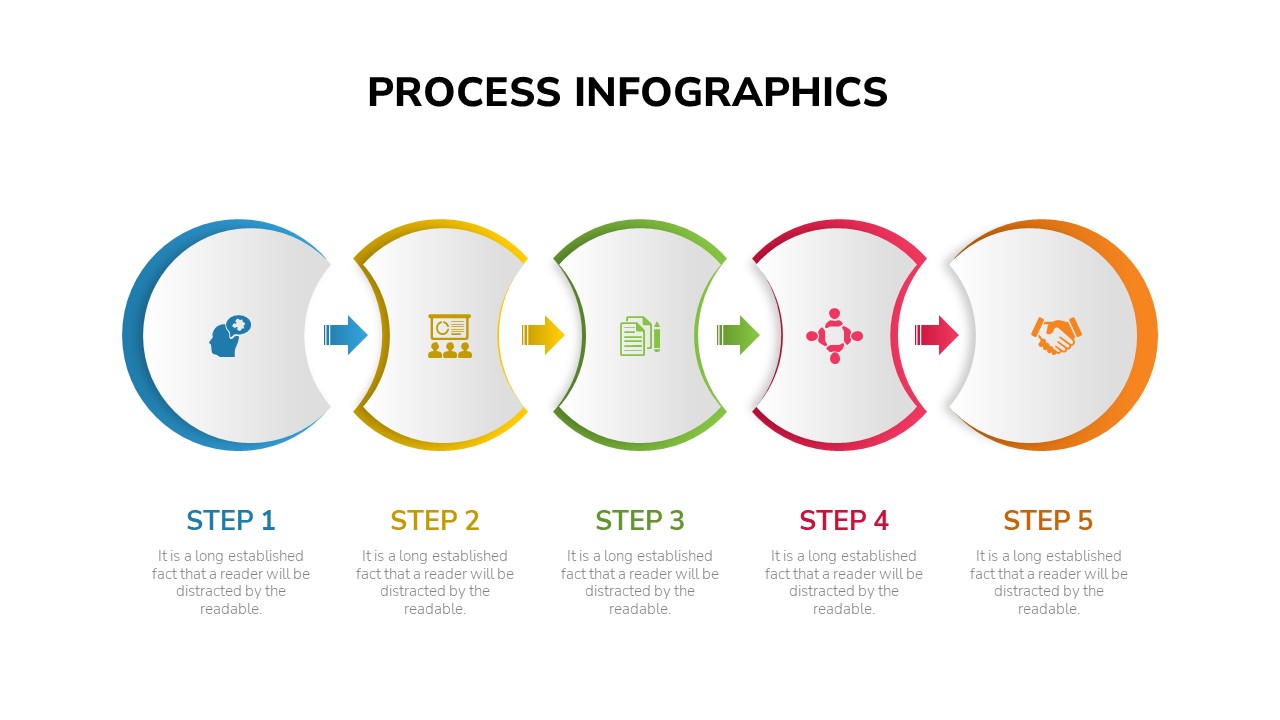
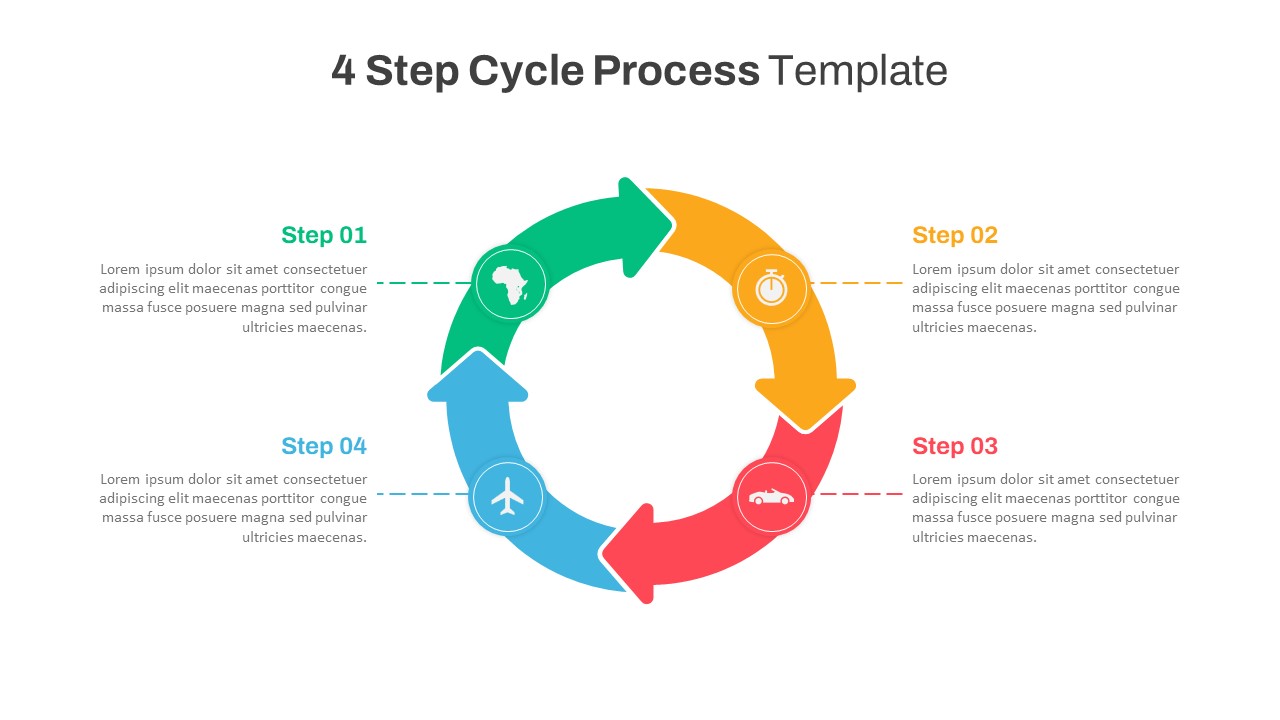
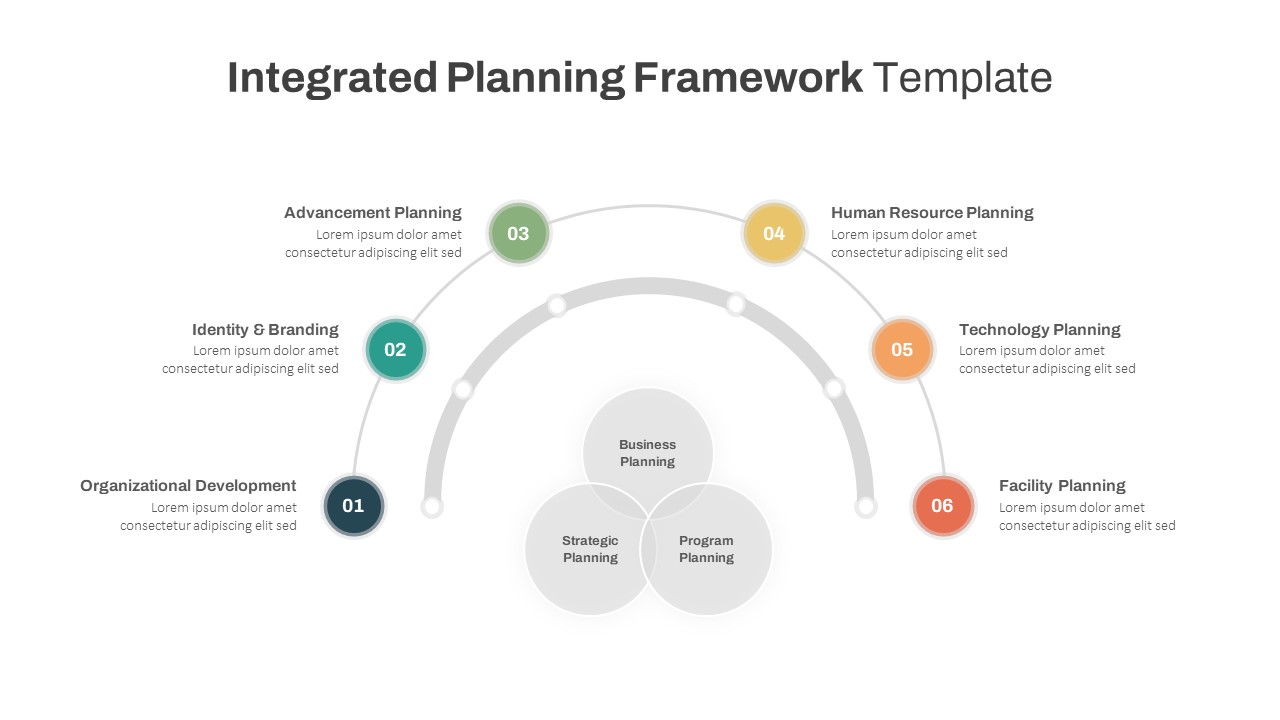
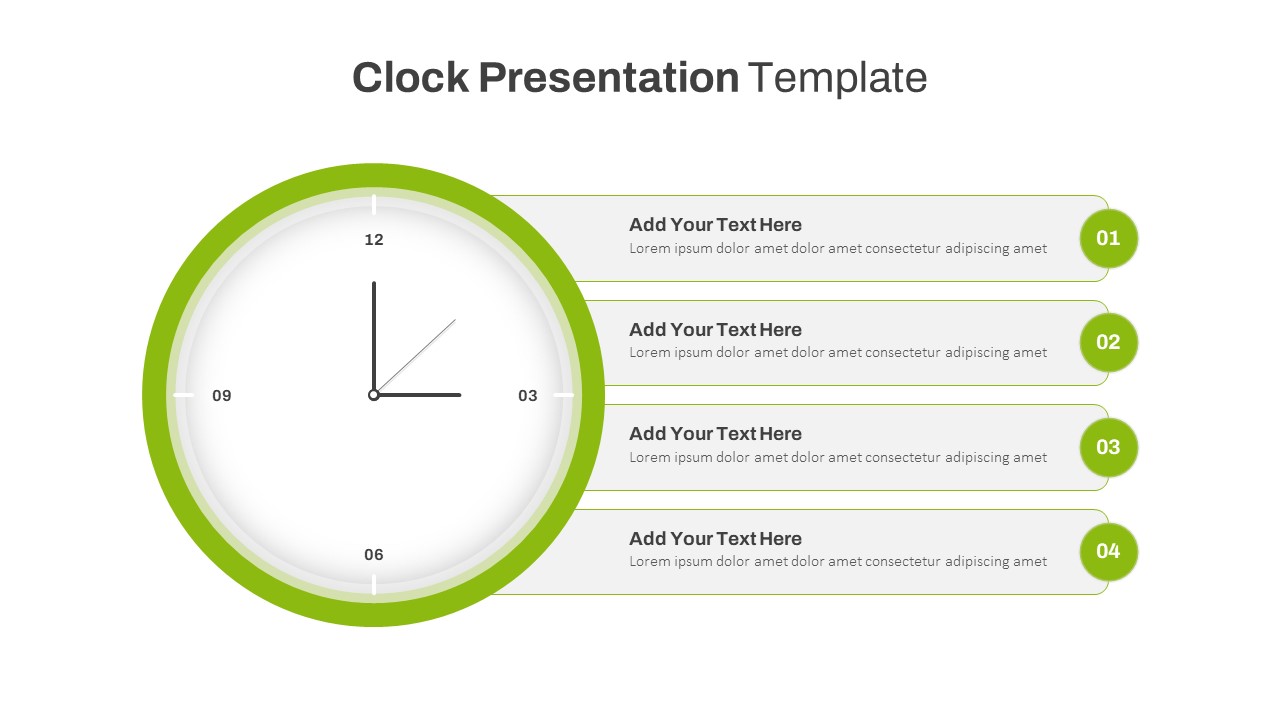
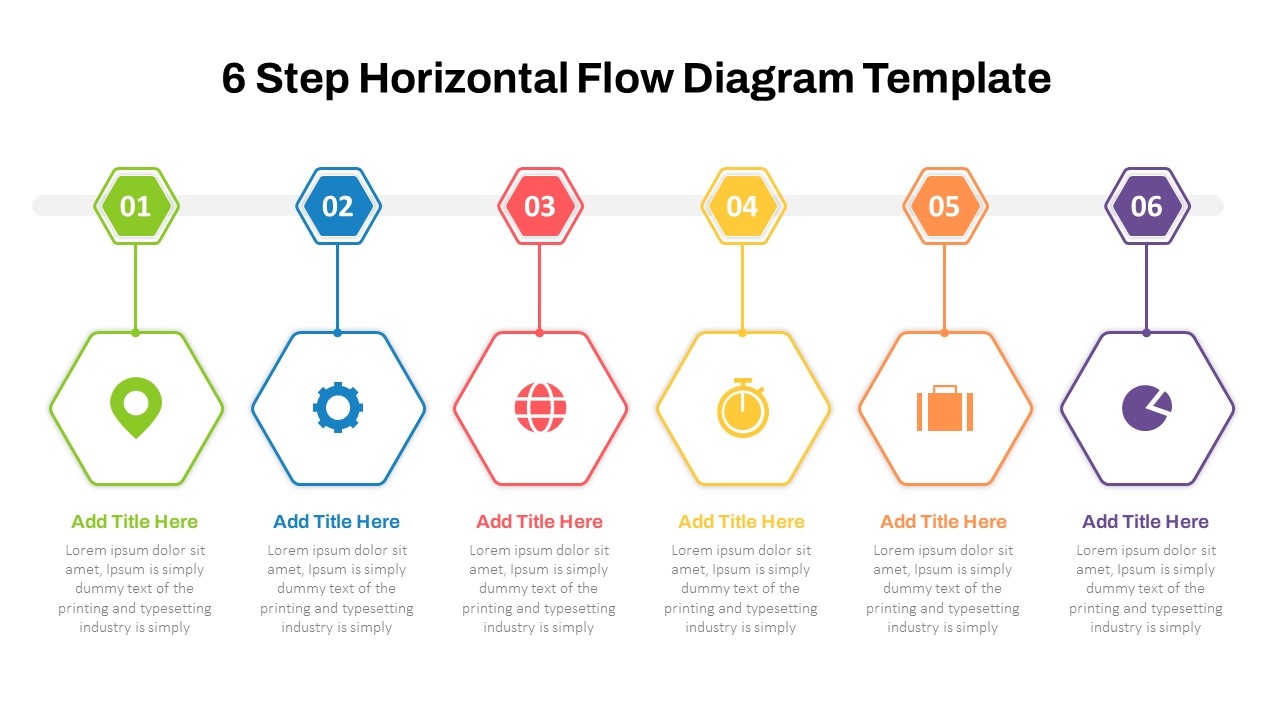
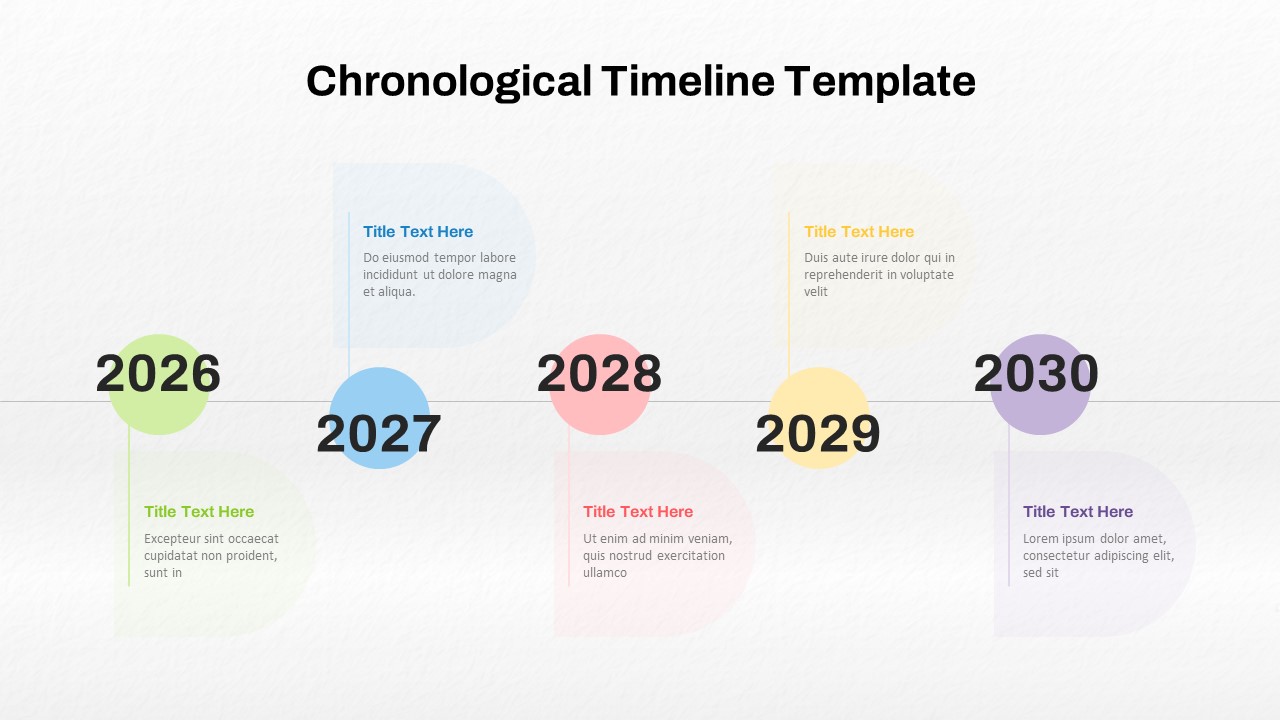
Visually Engaging: A circular design with color-coded segments makes the information easy to understand and visually appealing.
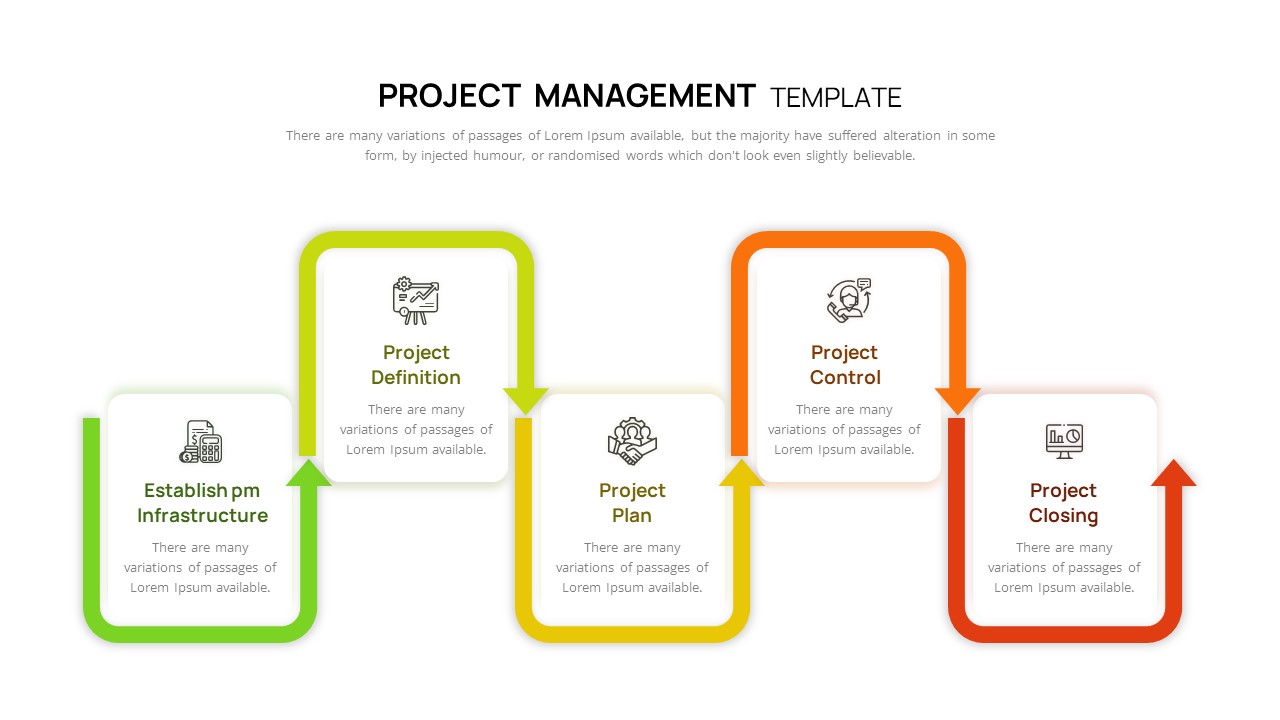
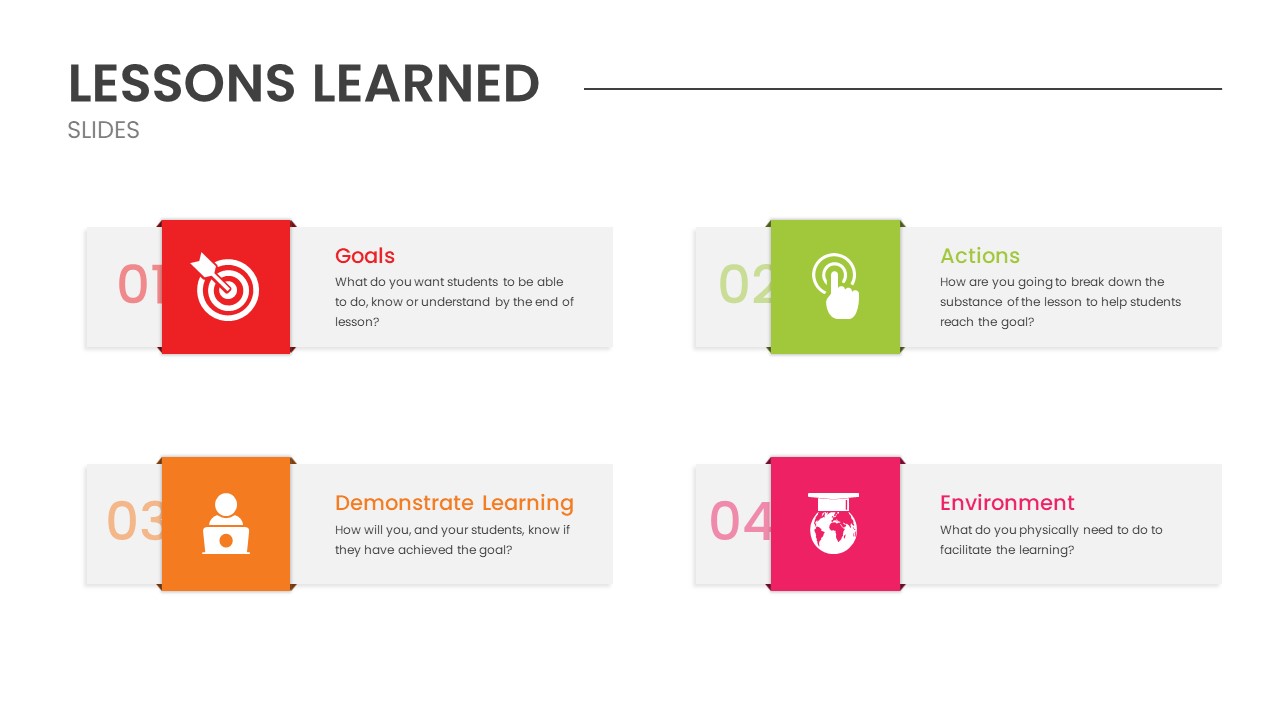
Customizable Icons: Each segment includes an icon representing different project management elements, such as brainstorming, planning, execution, communication, and collaboration.
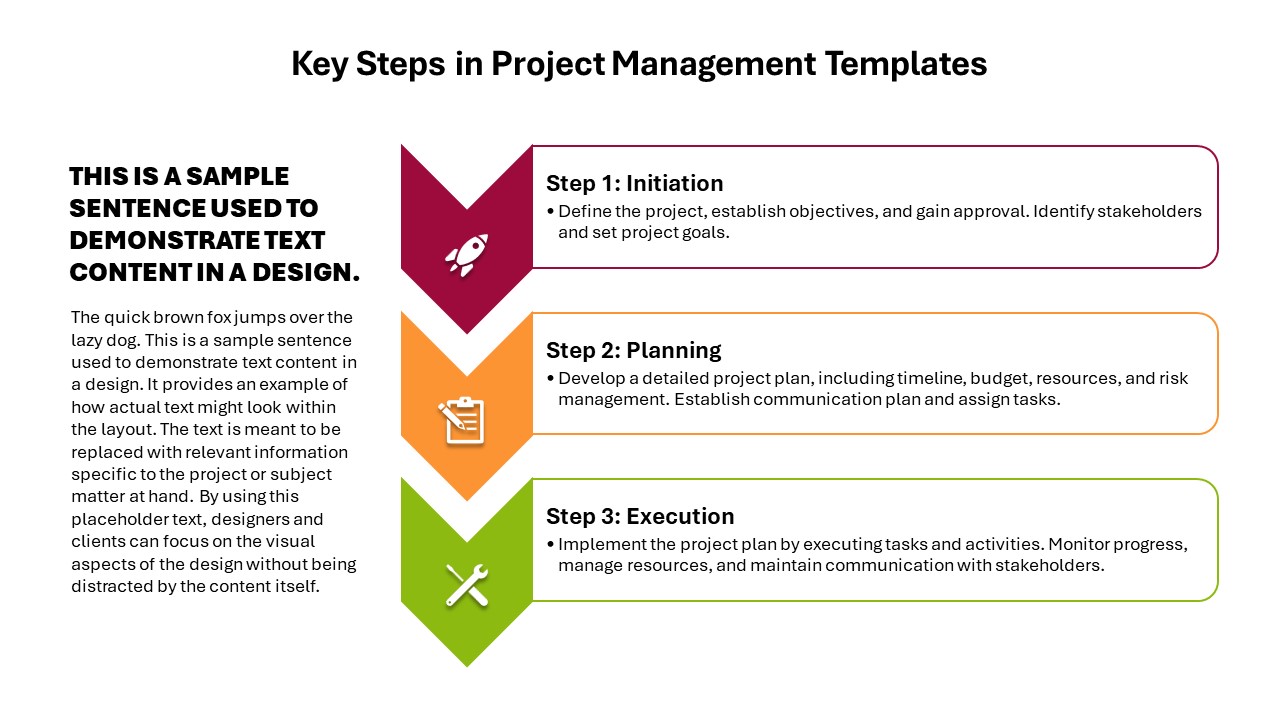
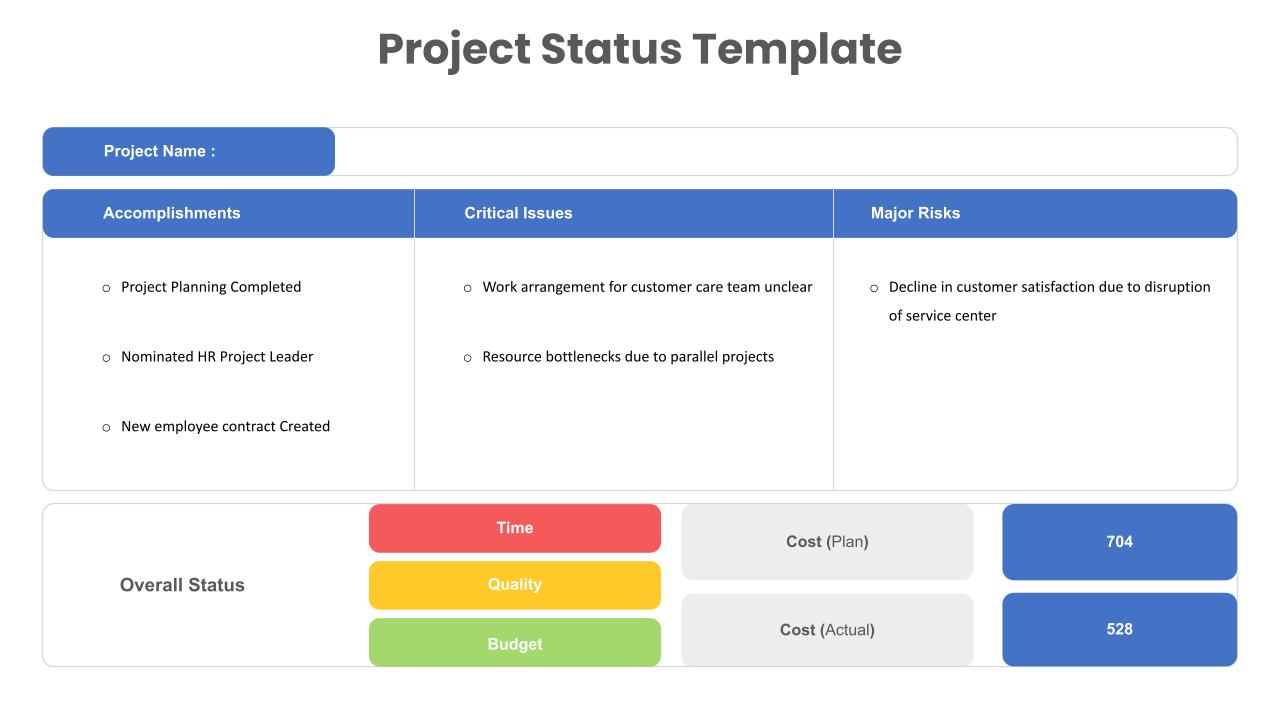
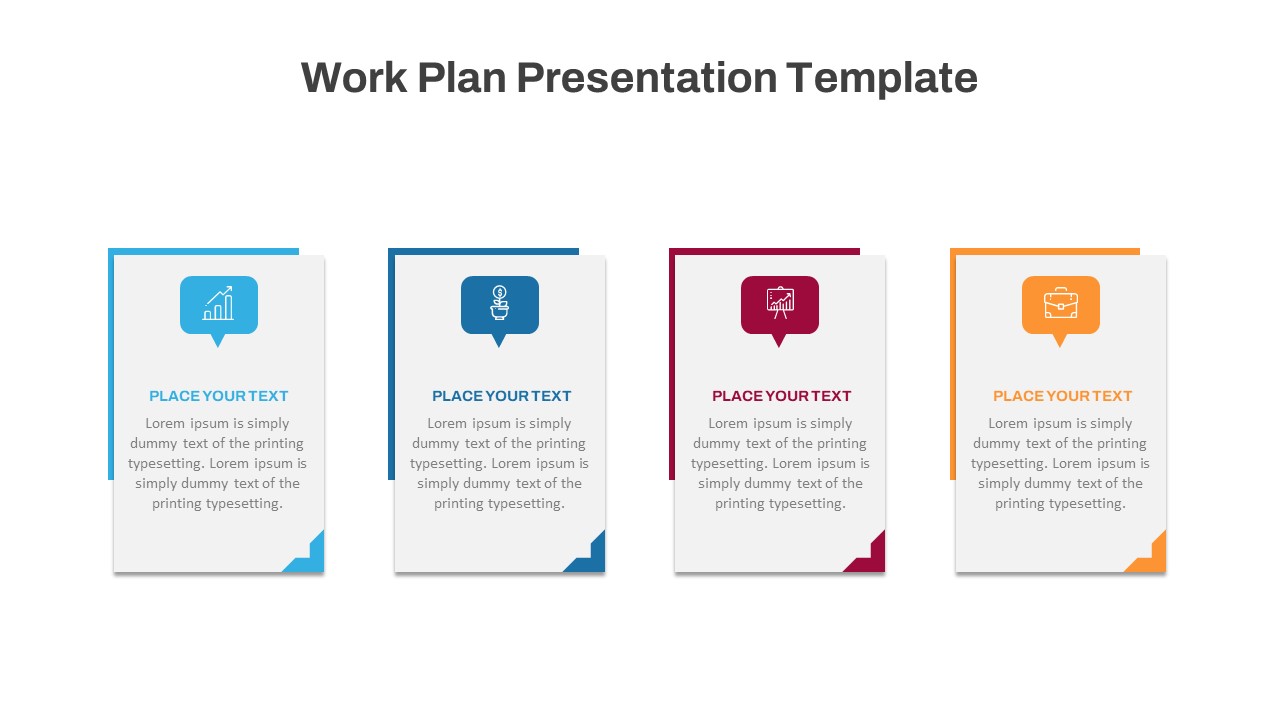
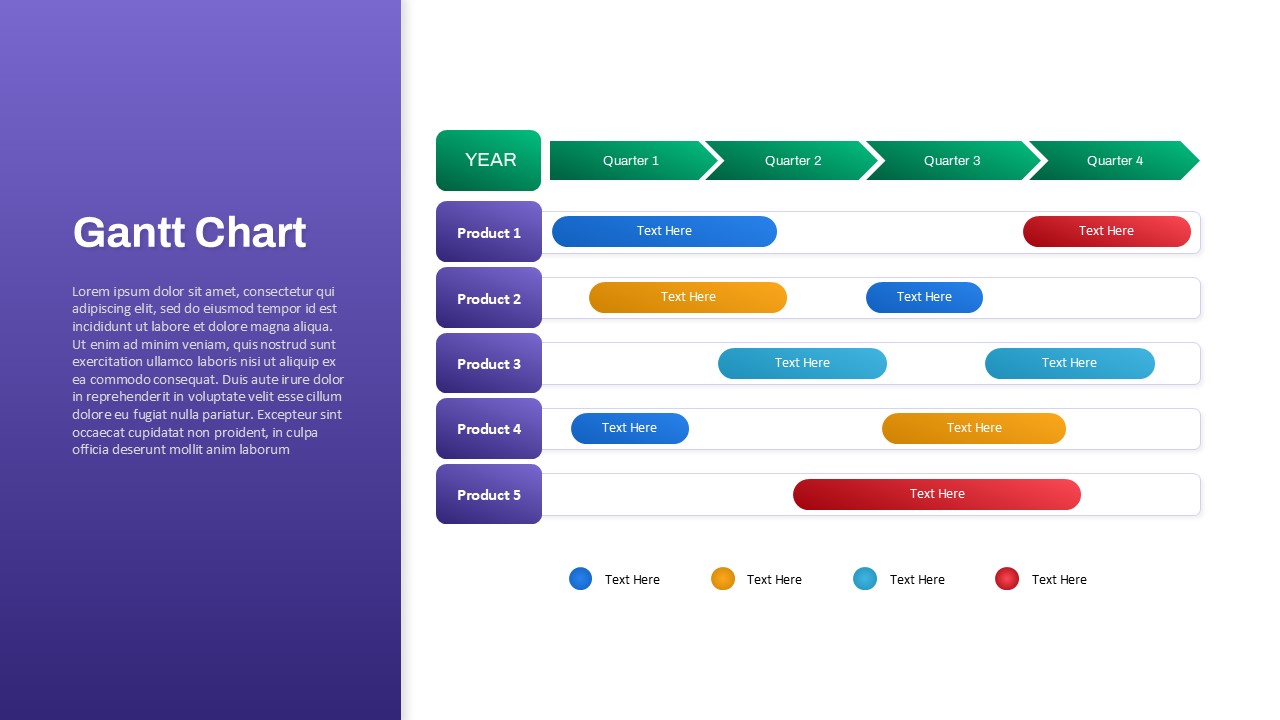
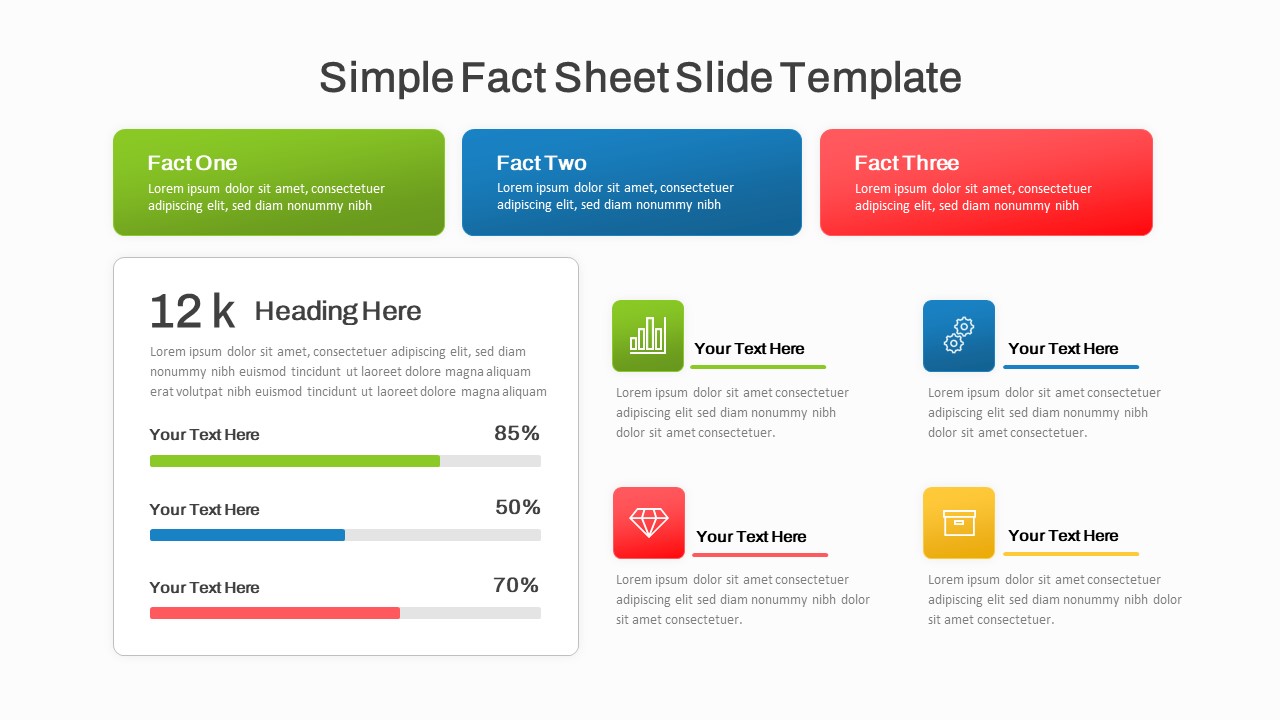
Detailed Text Areas: Provides ample space for detailed descriptions, ensuring comprehensive communication of project details.
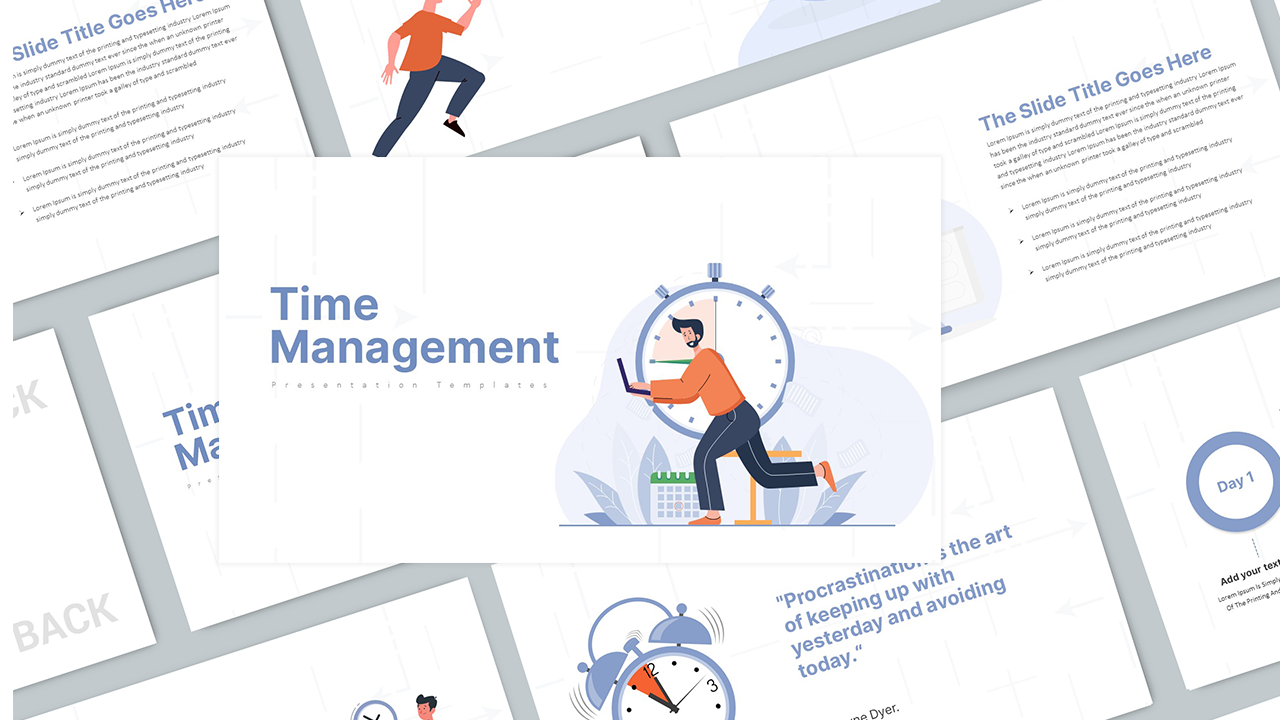
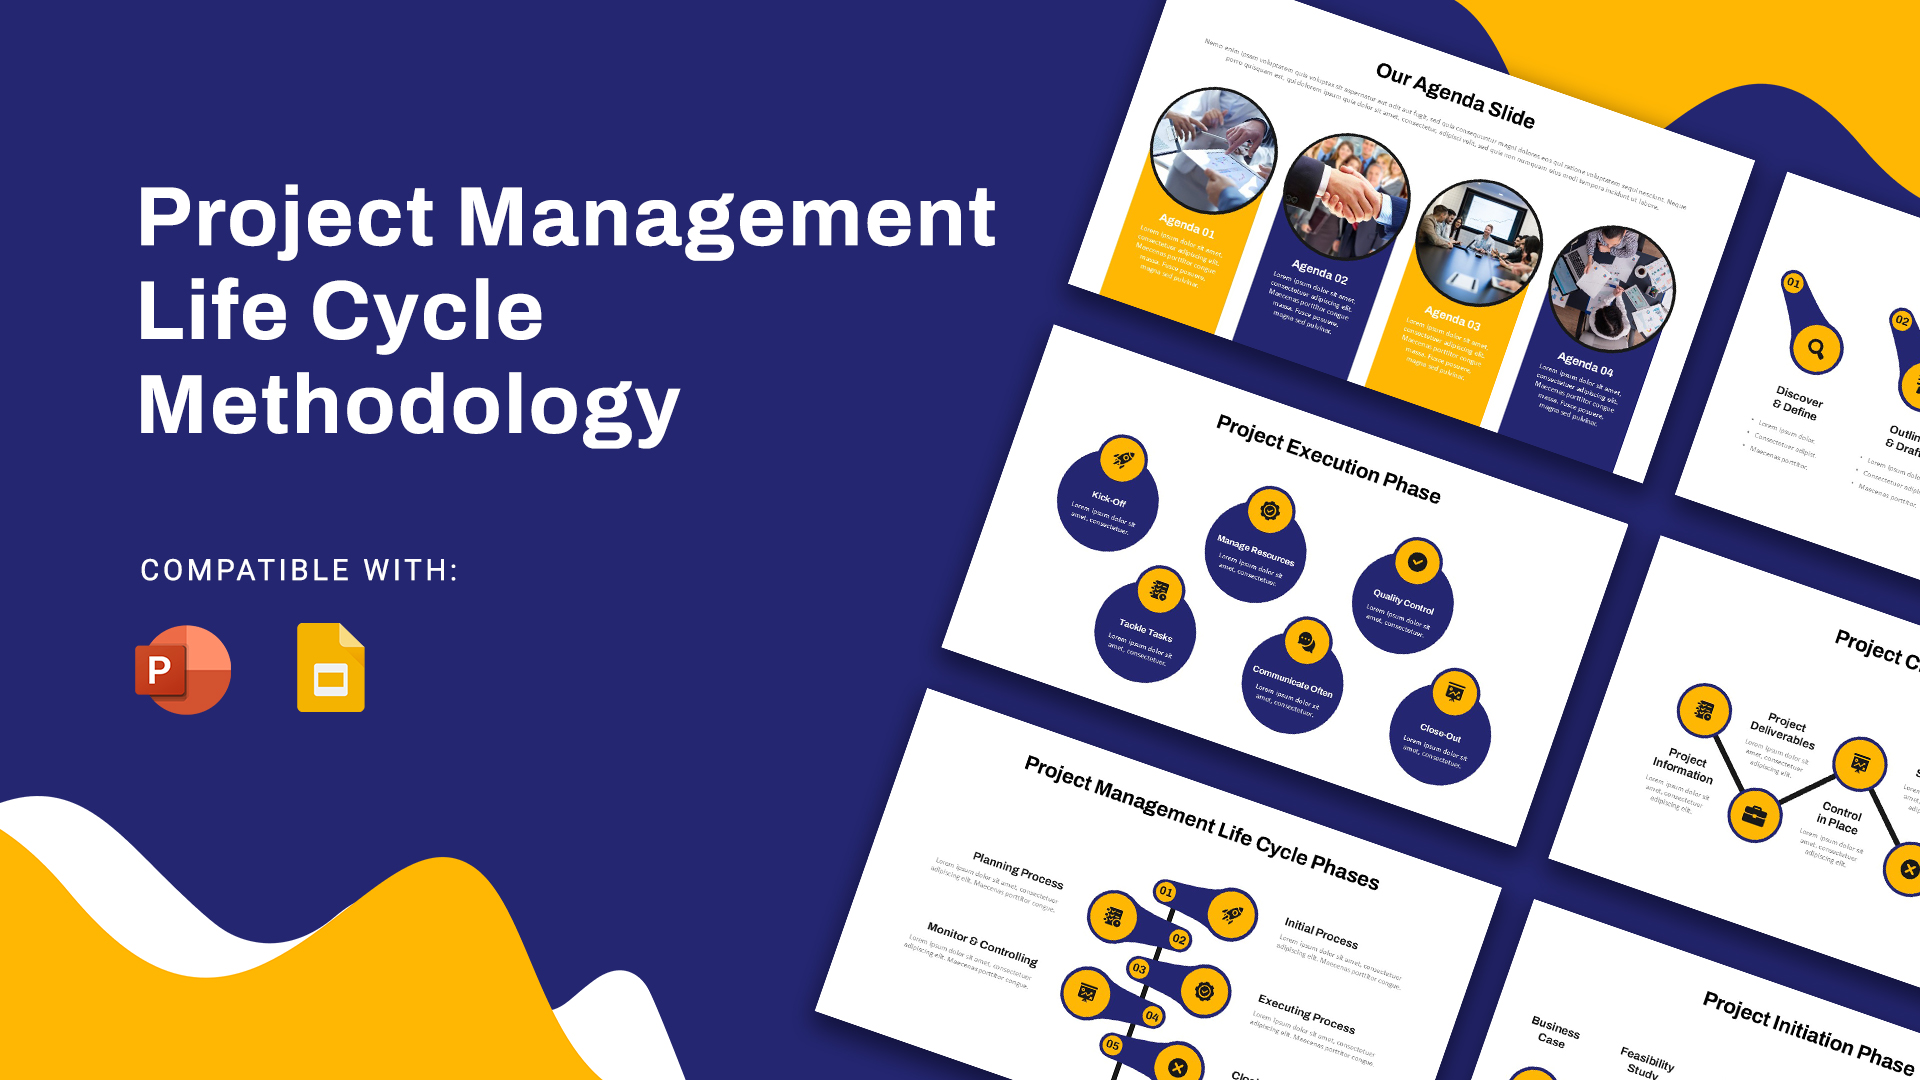
Professional Design: Clean, modern look suitable for corporate presentations, team meetings, and client pitches.
Easy Customization: Fully editable elements, allowing users to tailor the content to their specific needs and organizational style.
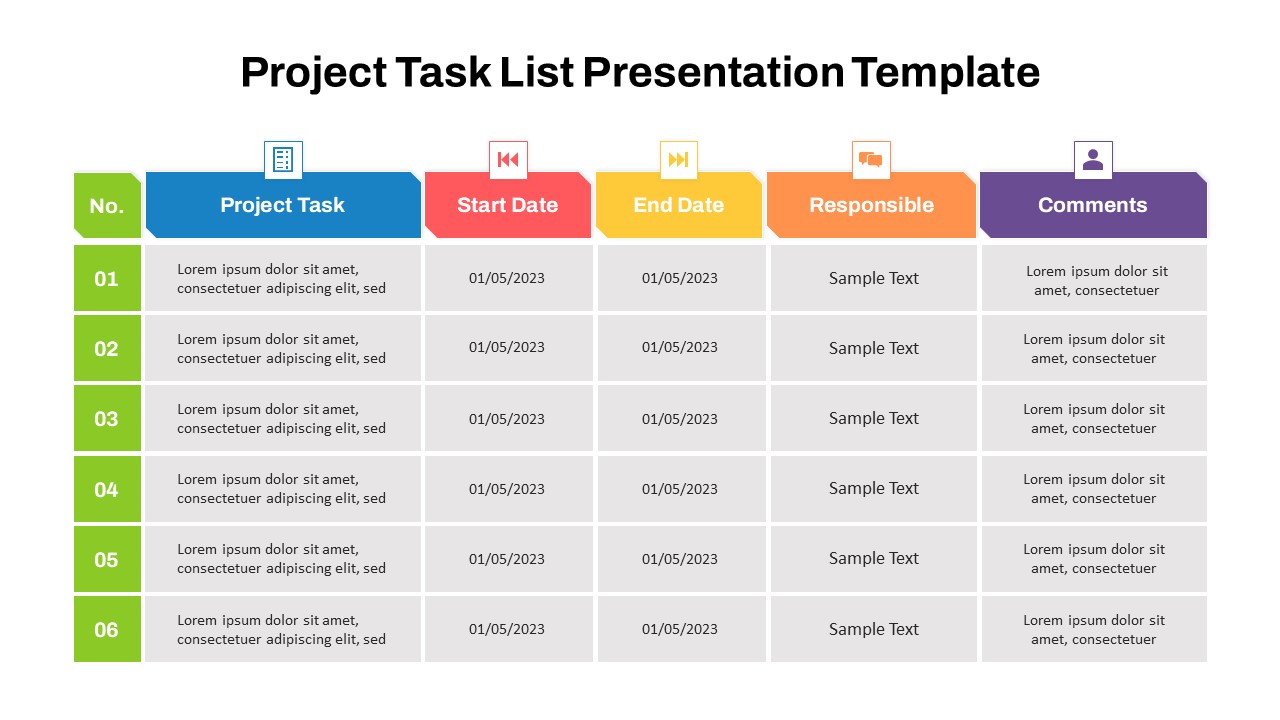
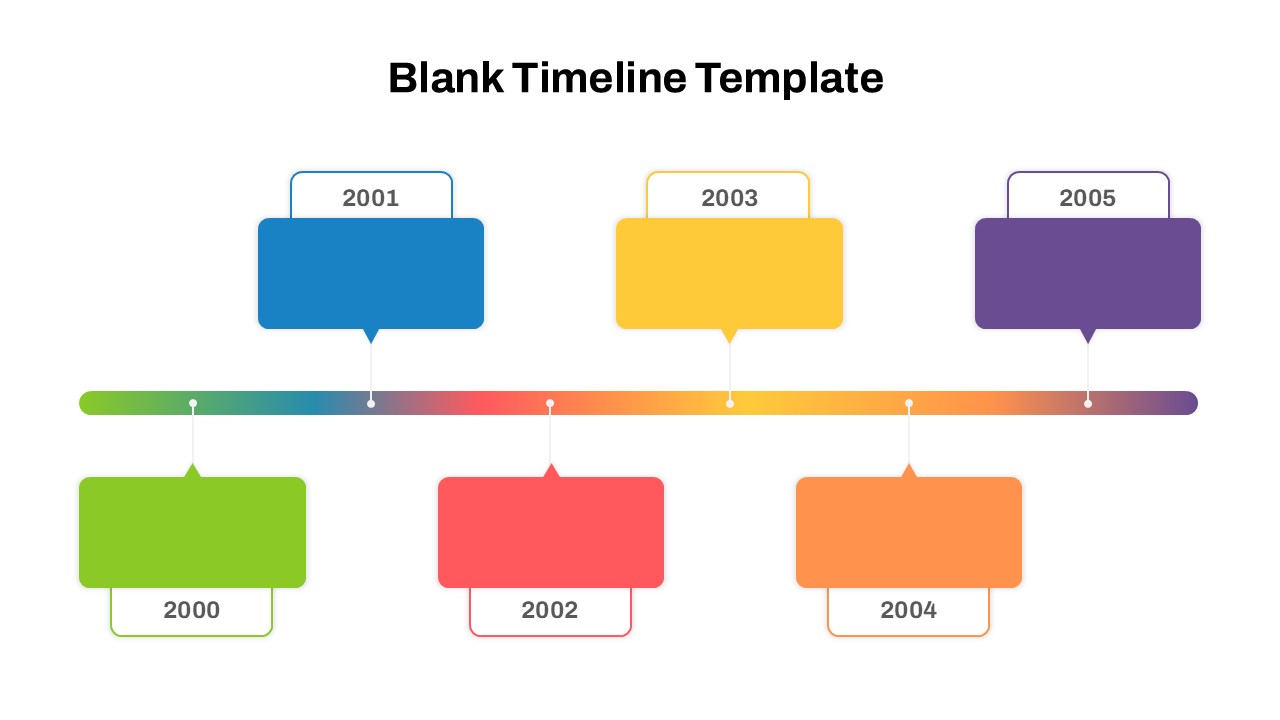
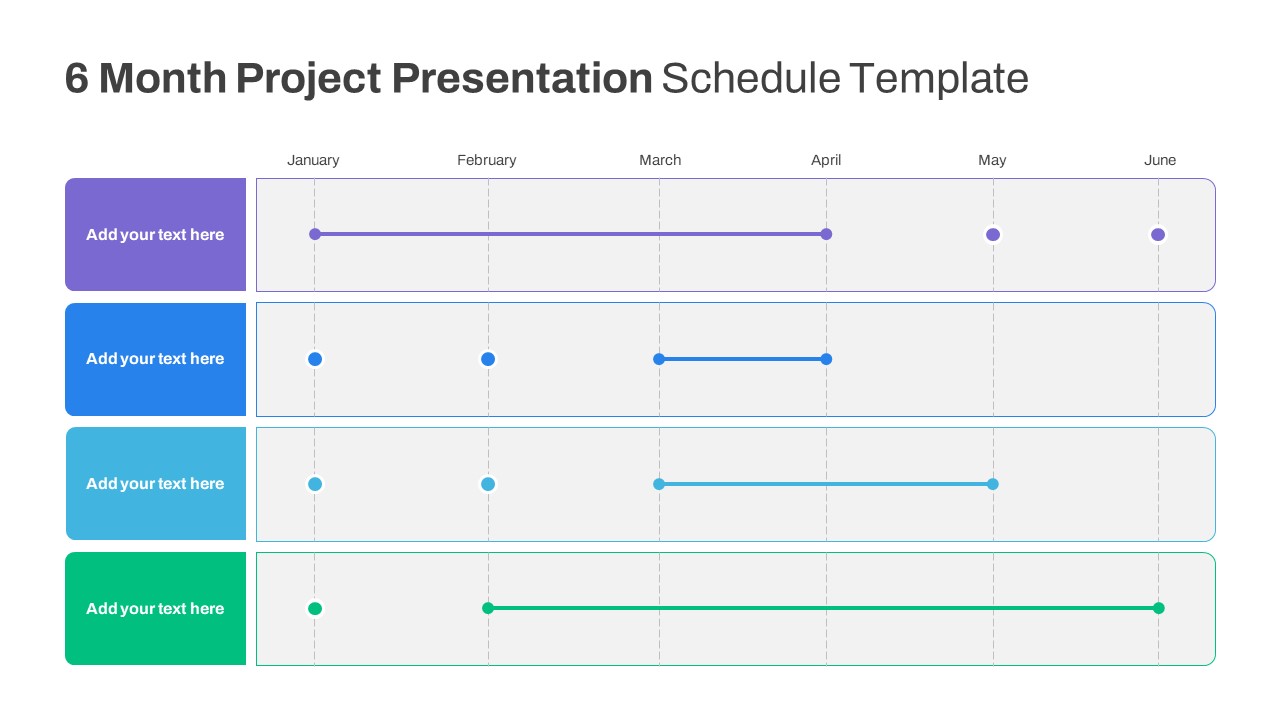
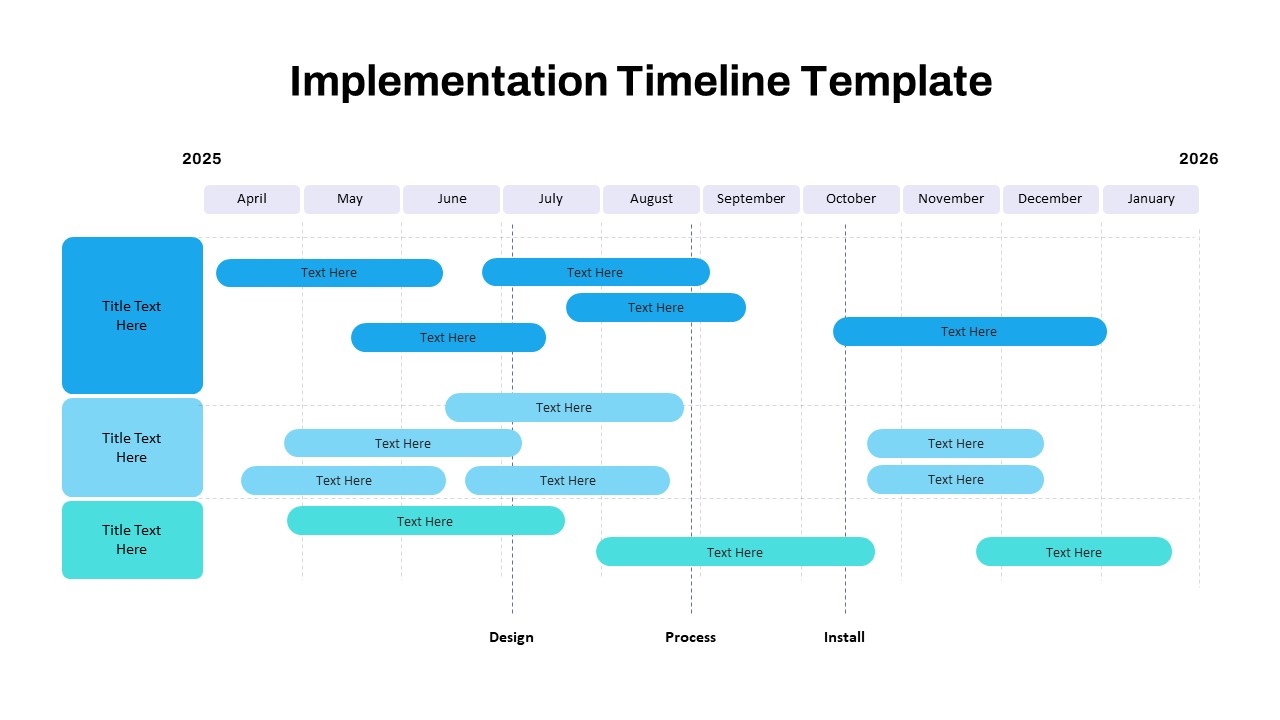
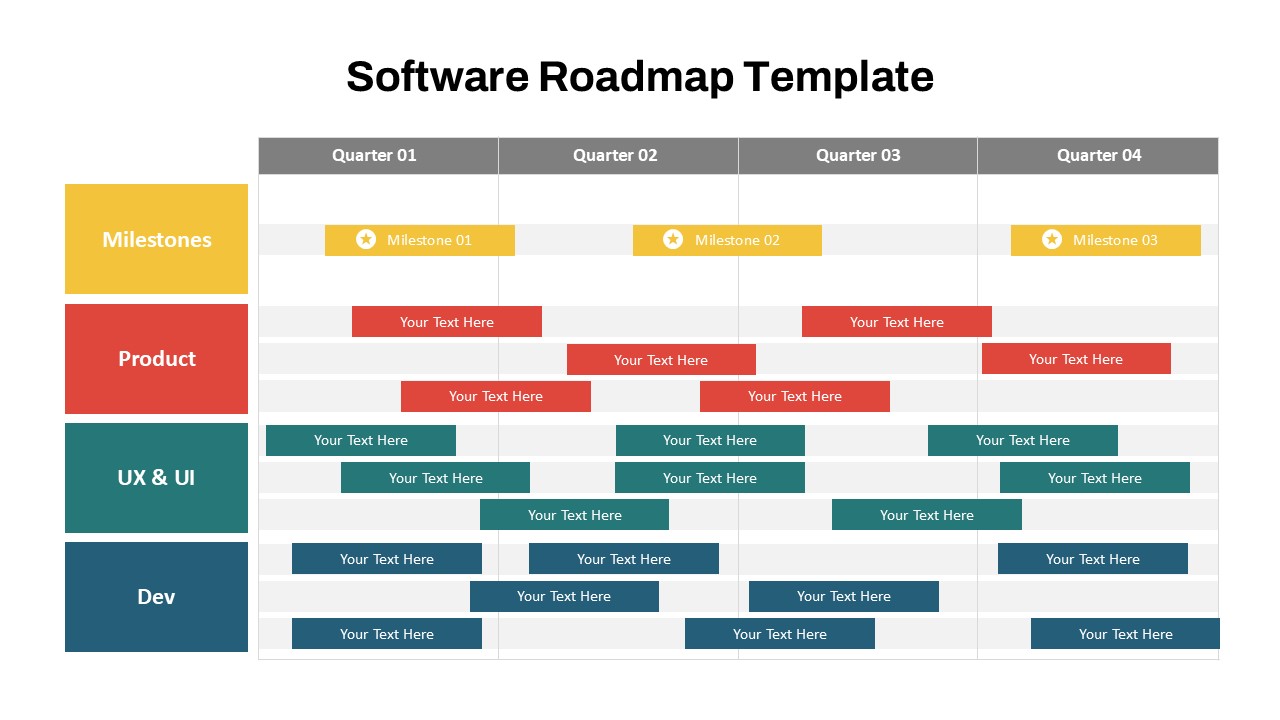
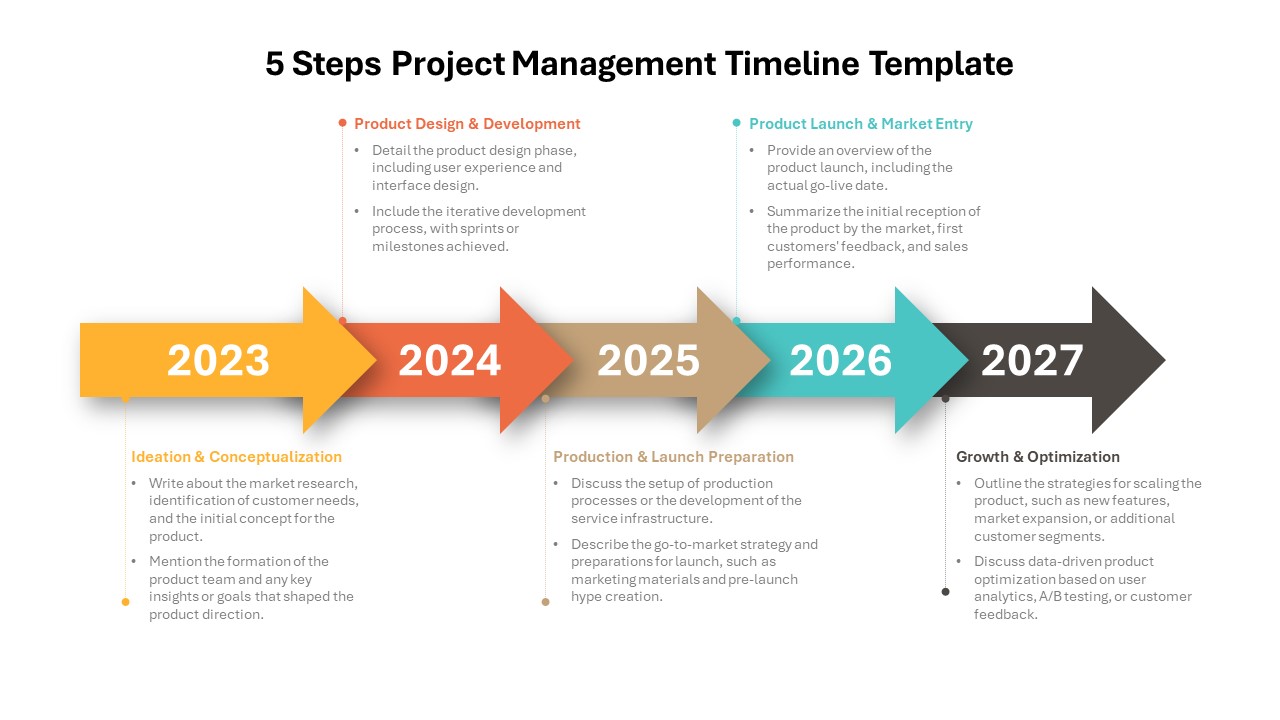
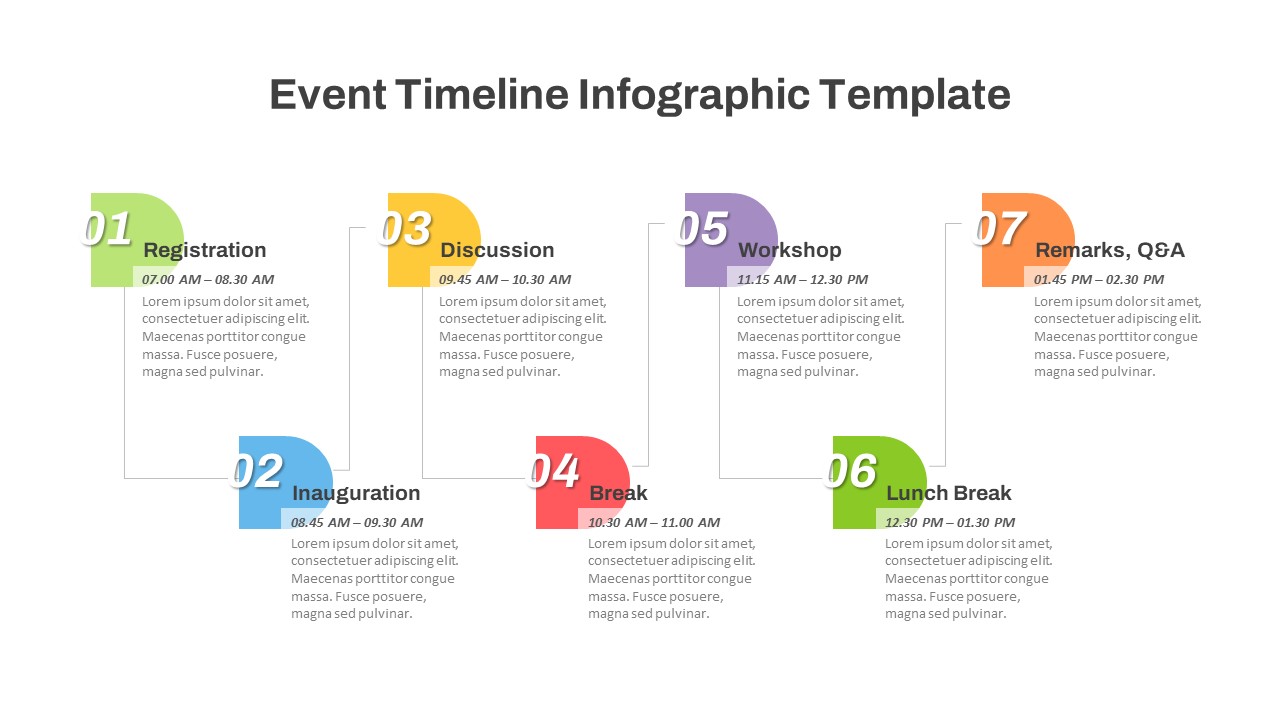
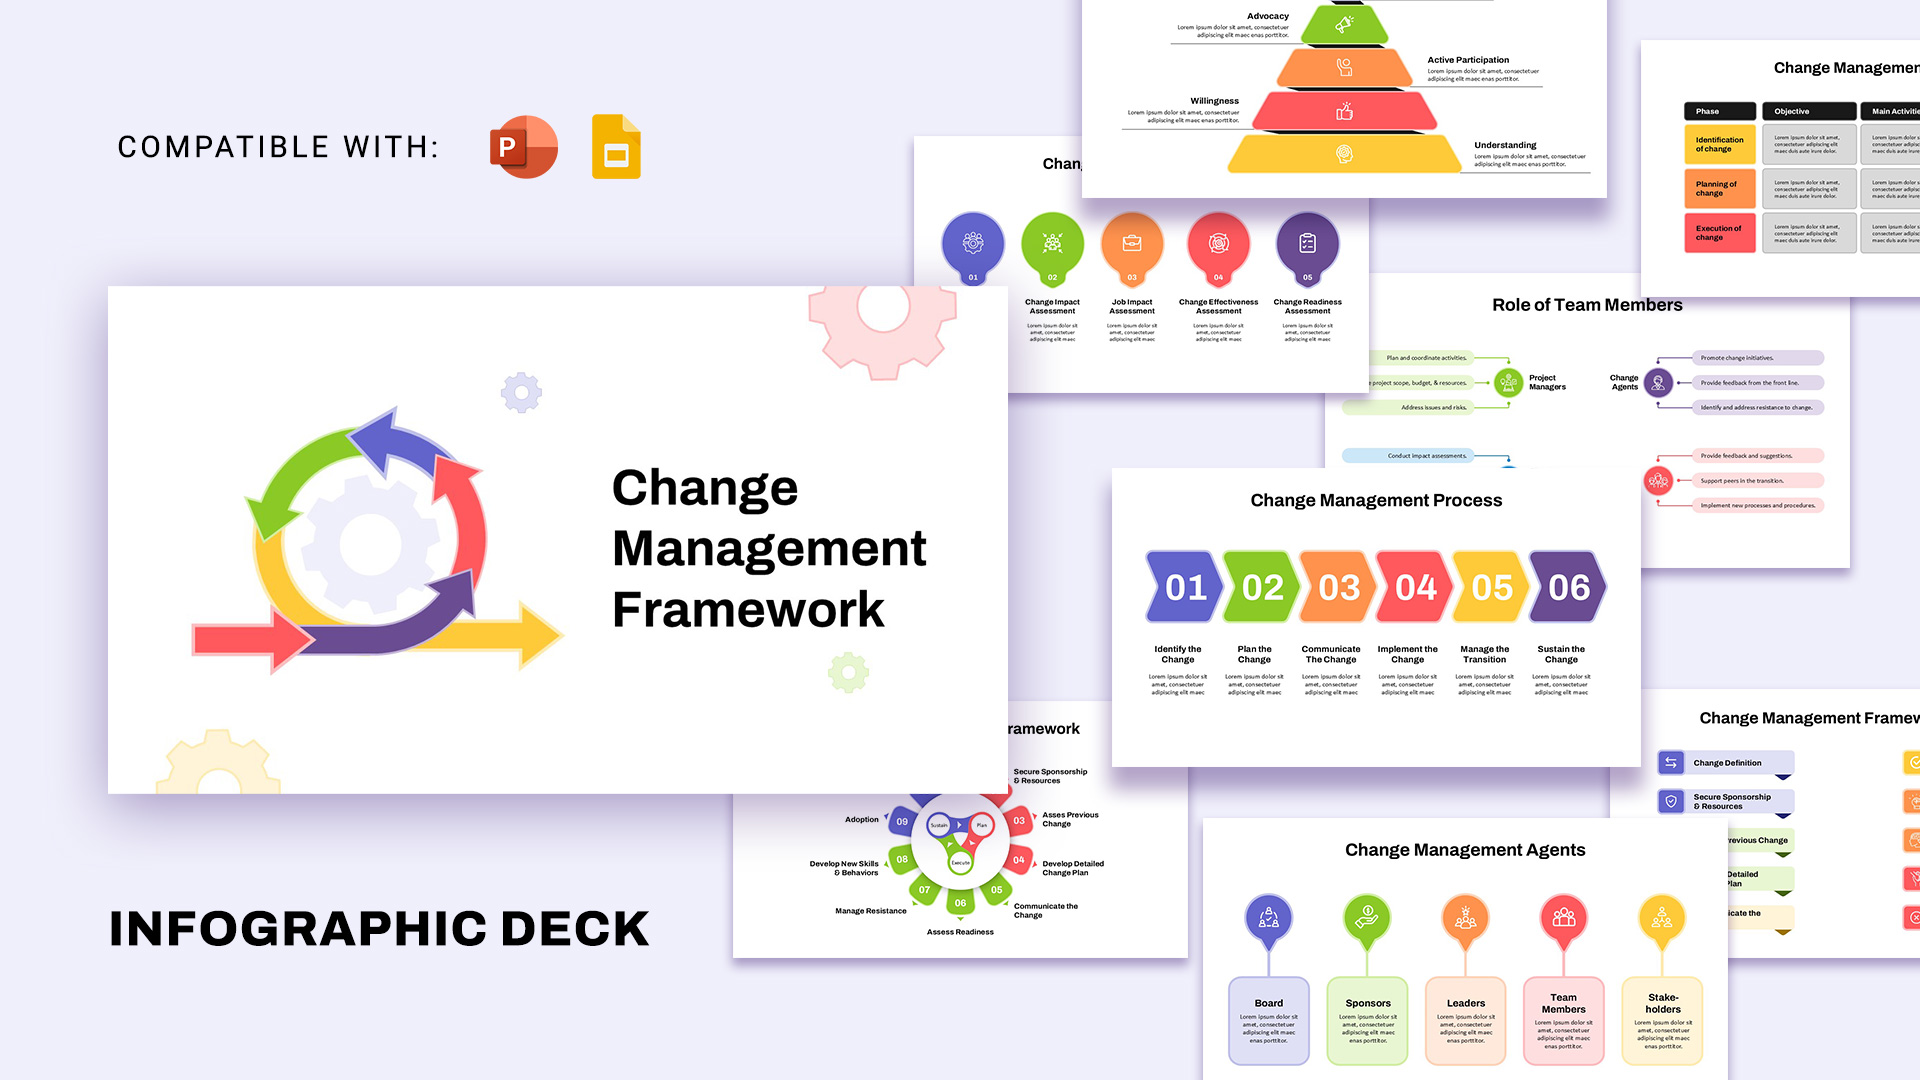
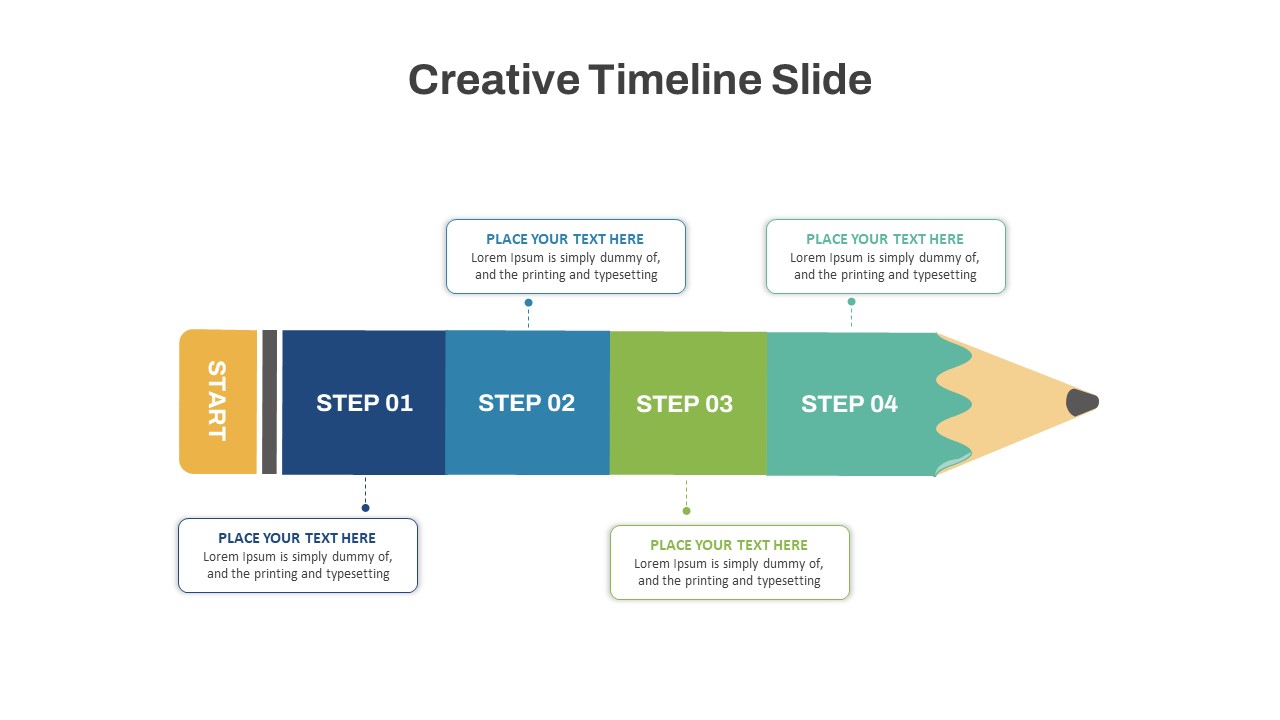
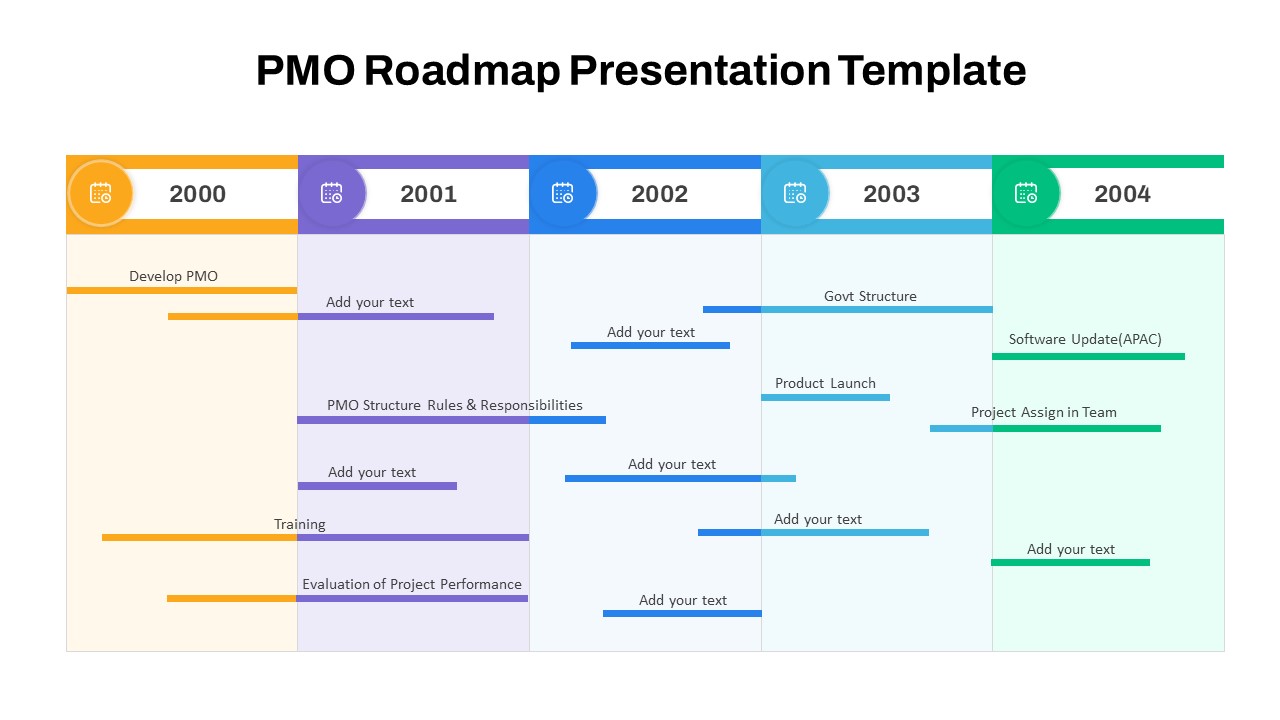
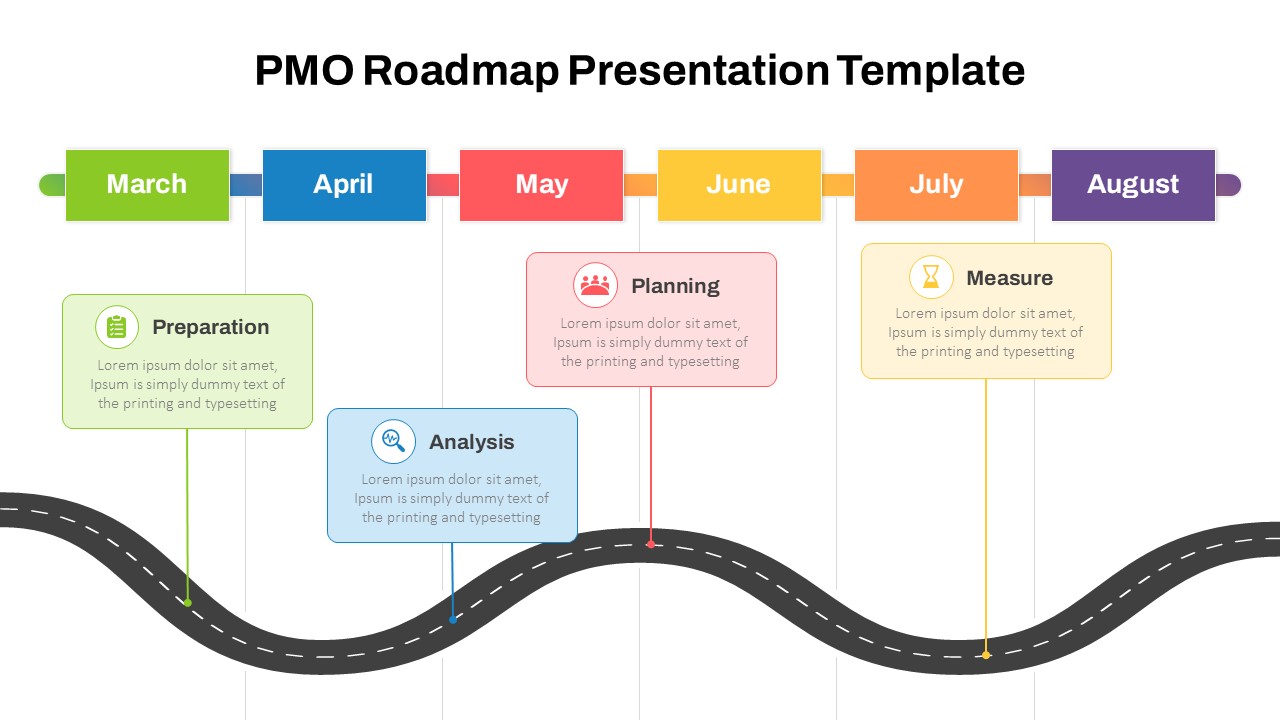
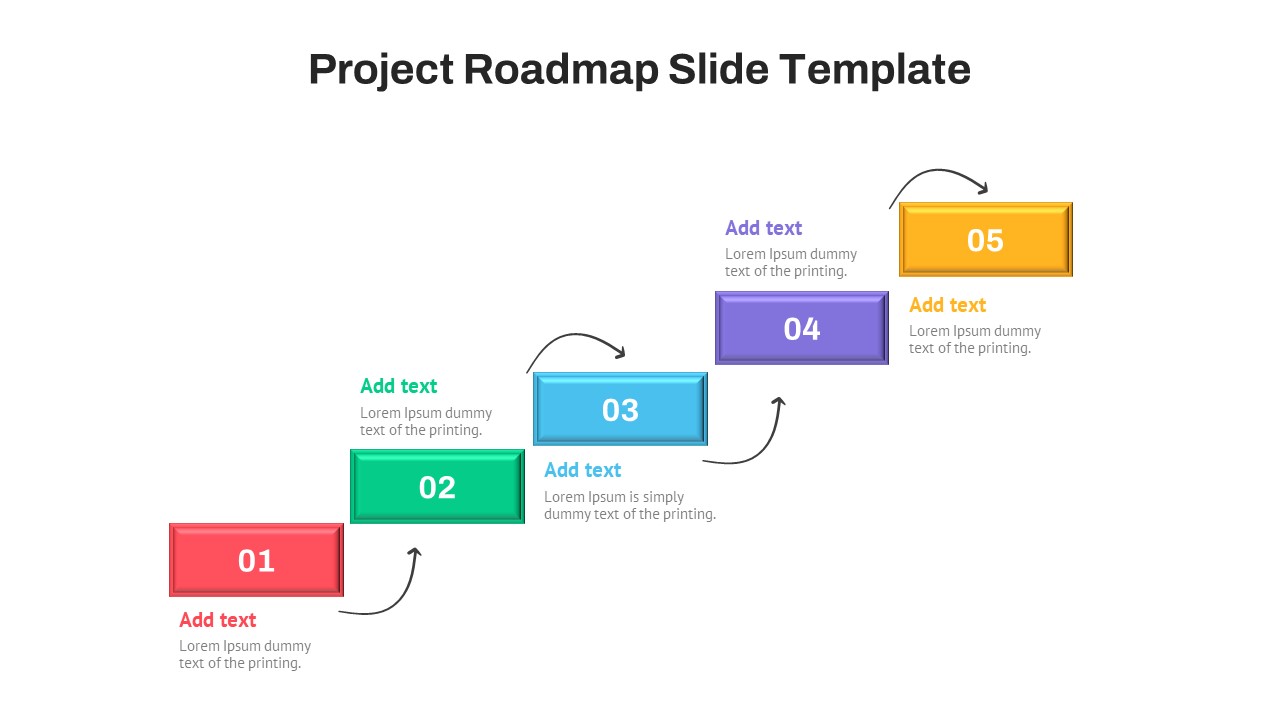
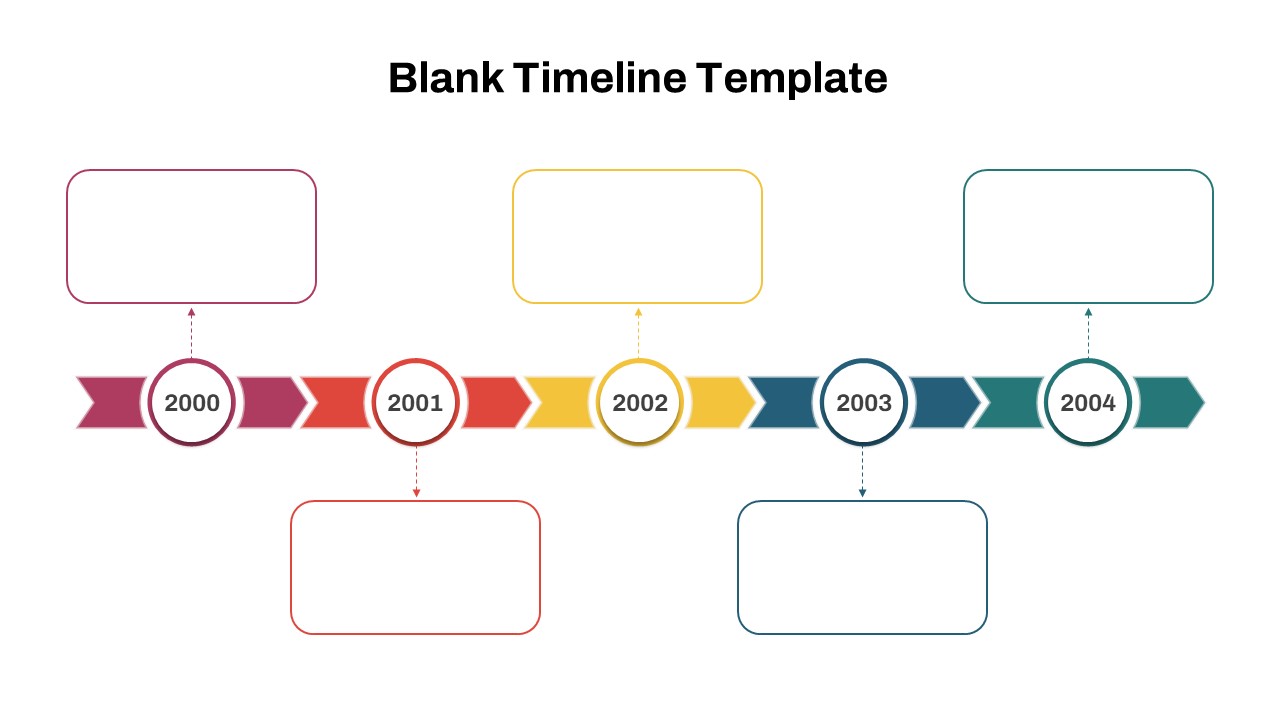
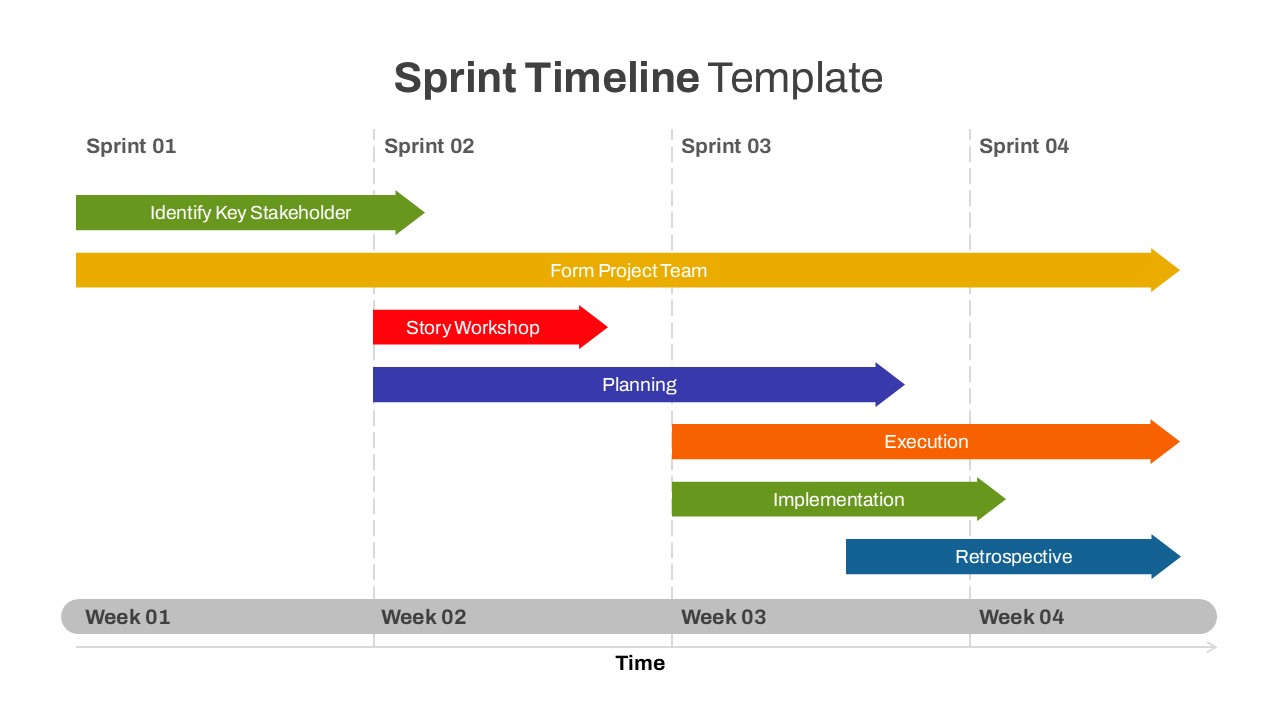
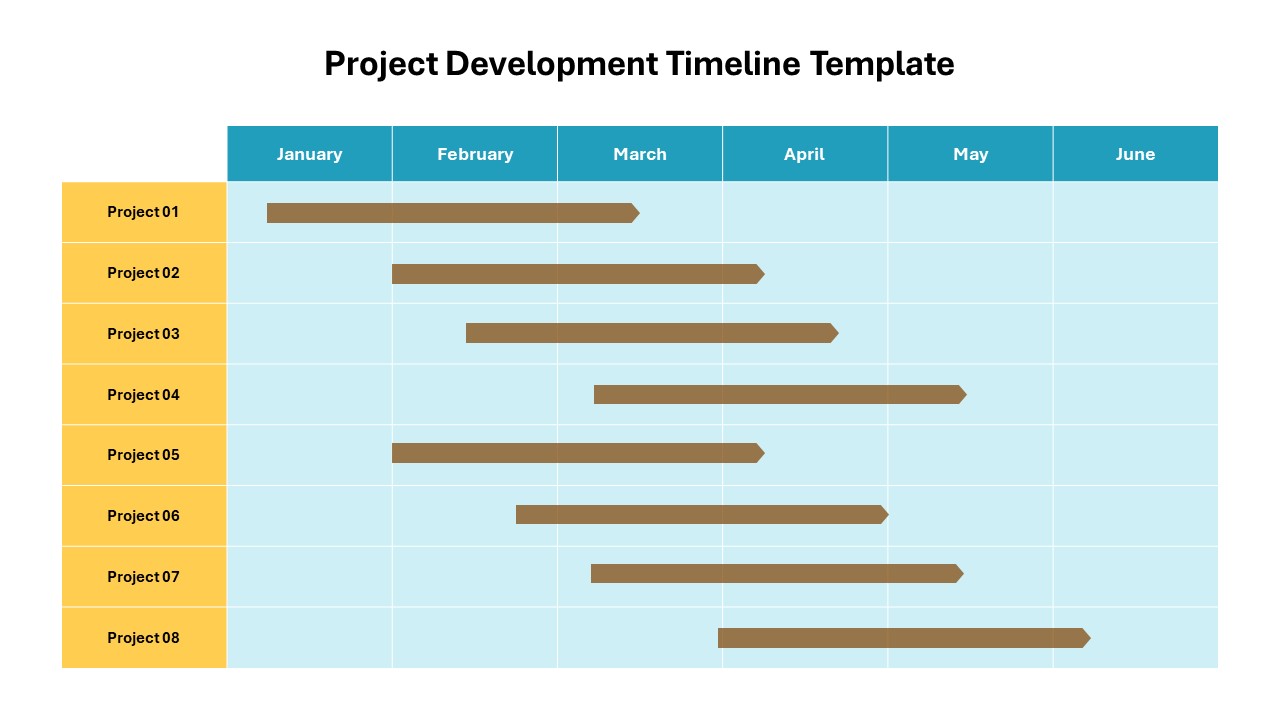
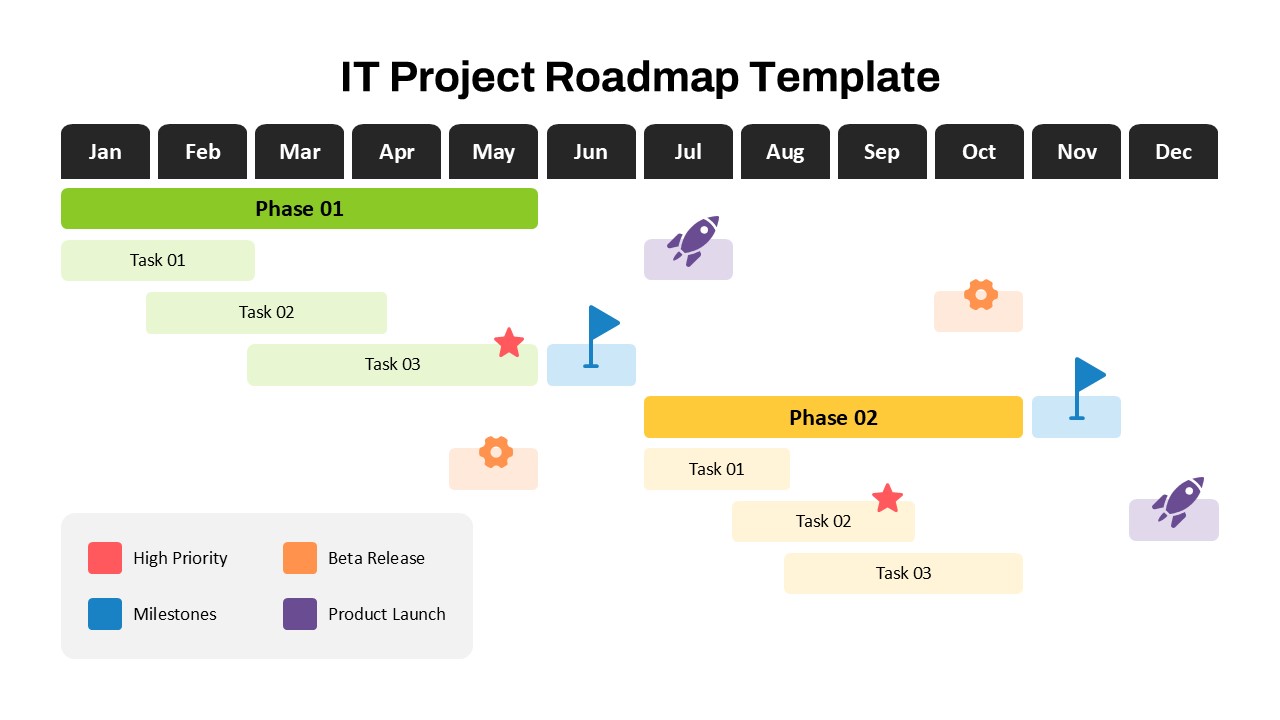
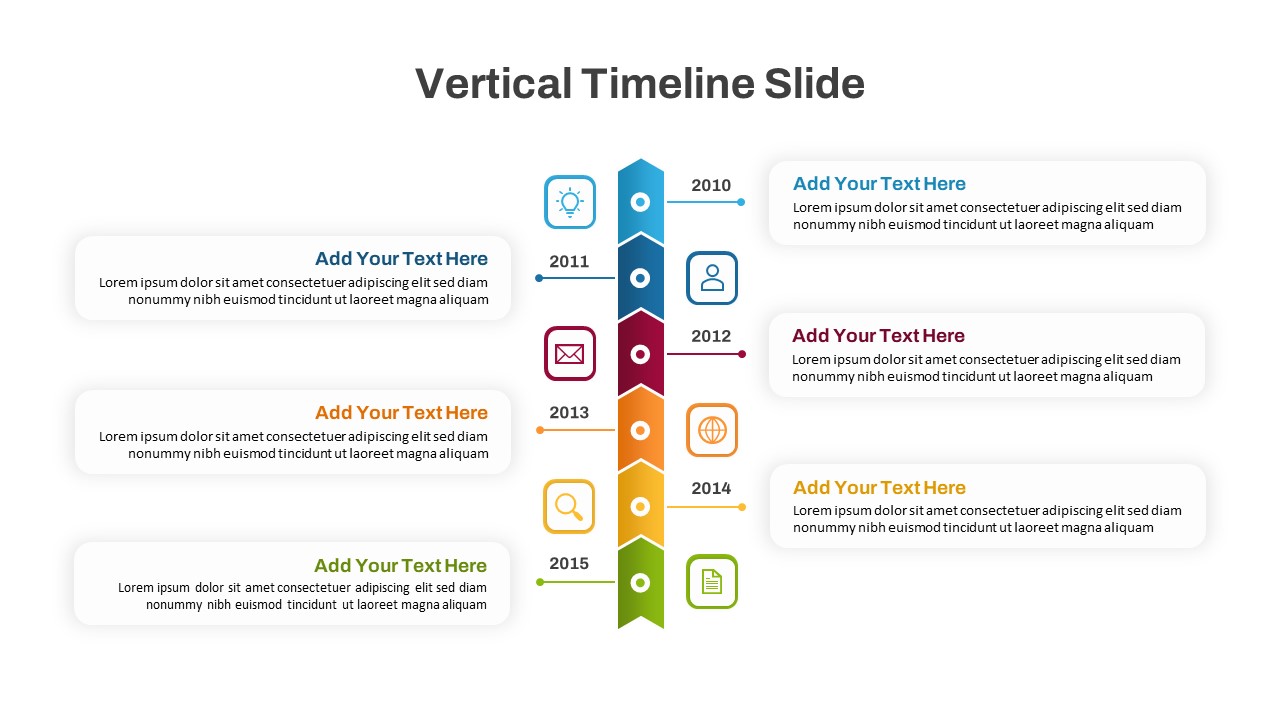
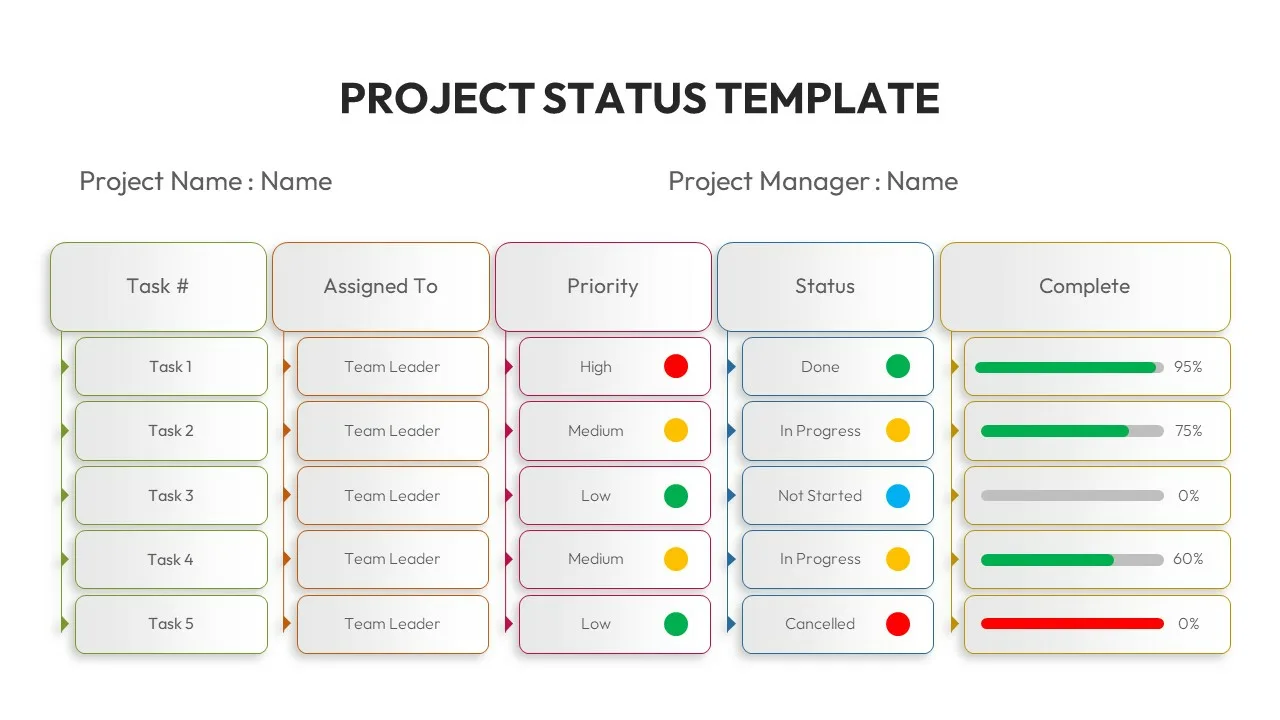
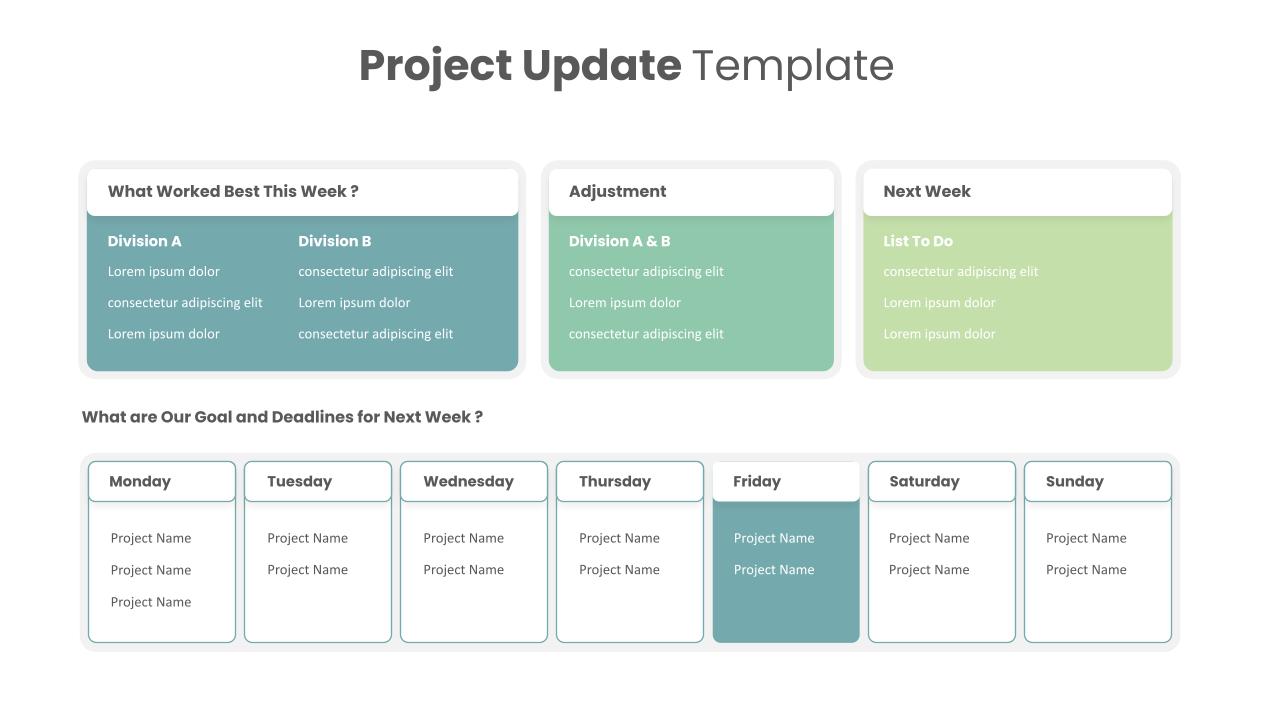
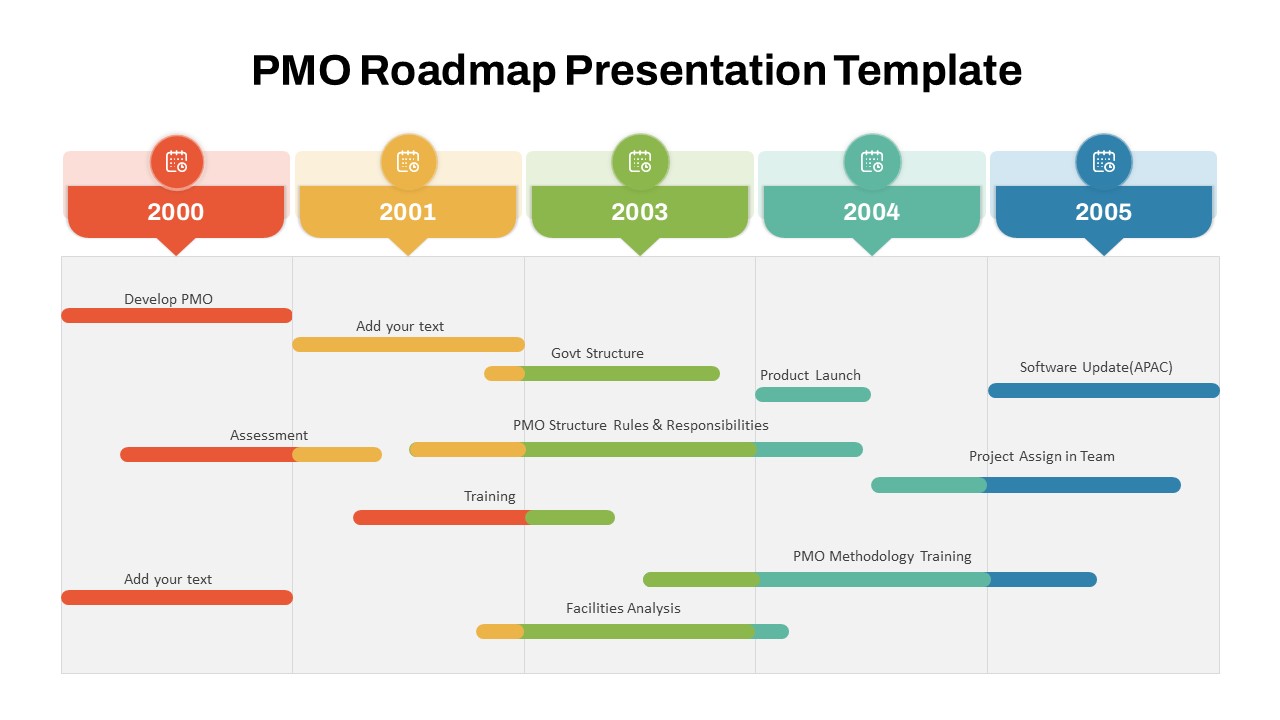
This Google Slides and PowerPoint template for project management is perfect for illustrating project timelines, task distributions, workflow processes, and team roles. It is an invaluable resource for anyone looking to enhance their project presentations with clear, concise, and compelling visuals.
See more

Aspect Ratio
16:9Item ID
SKT00997
Features of this template
Other Use Cases of the Template:
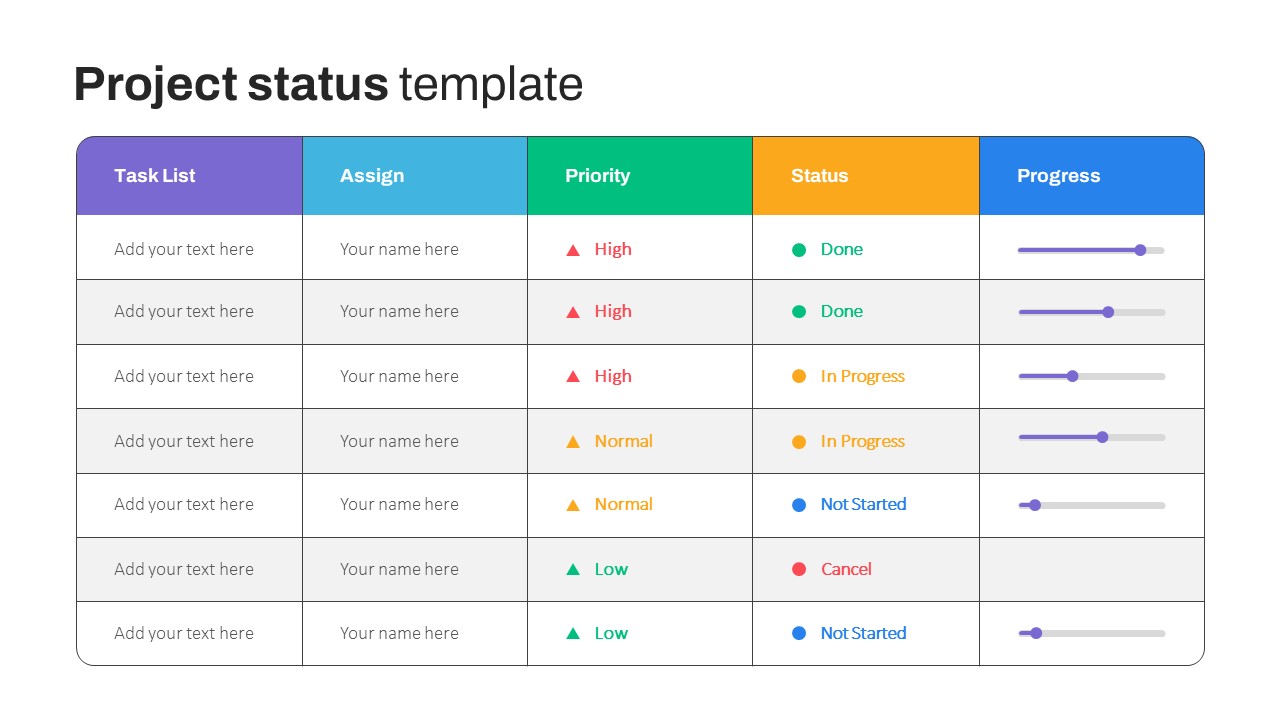
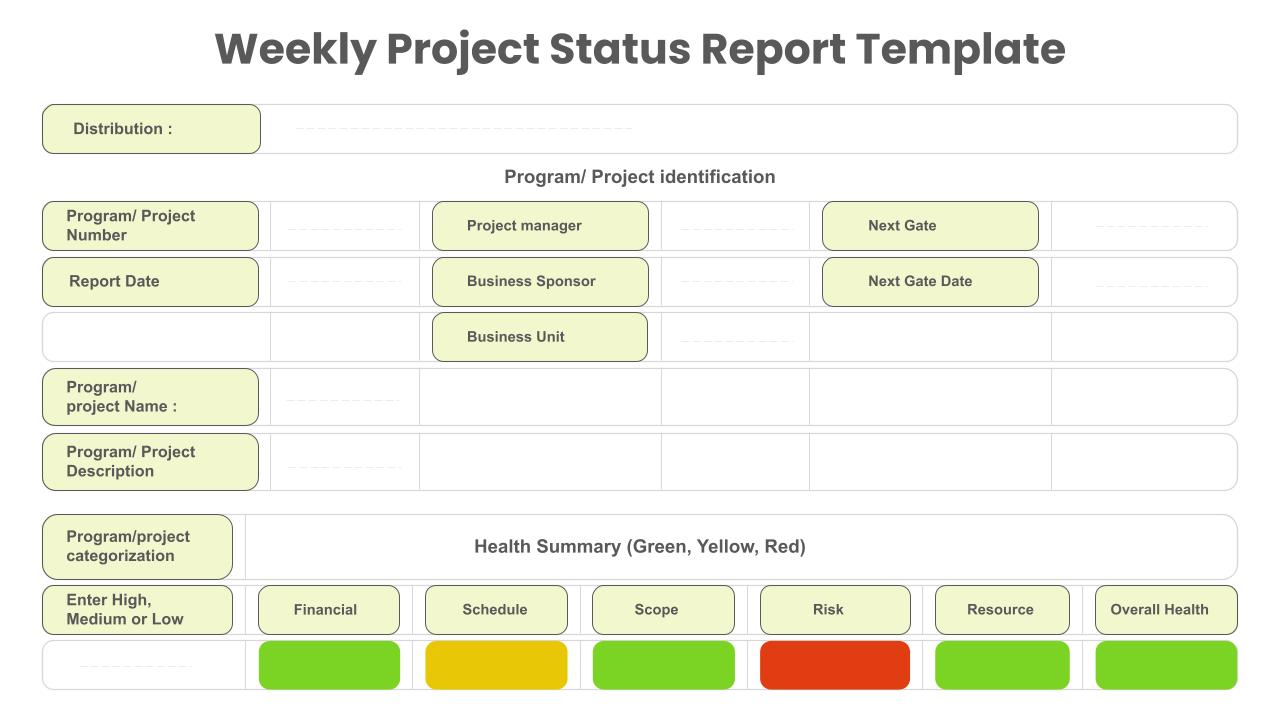
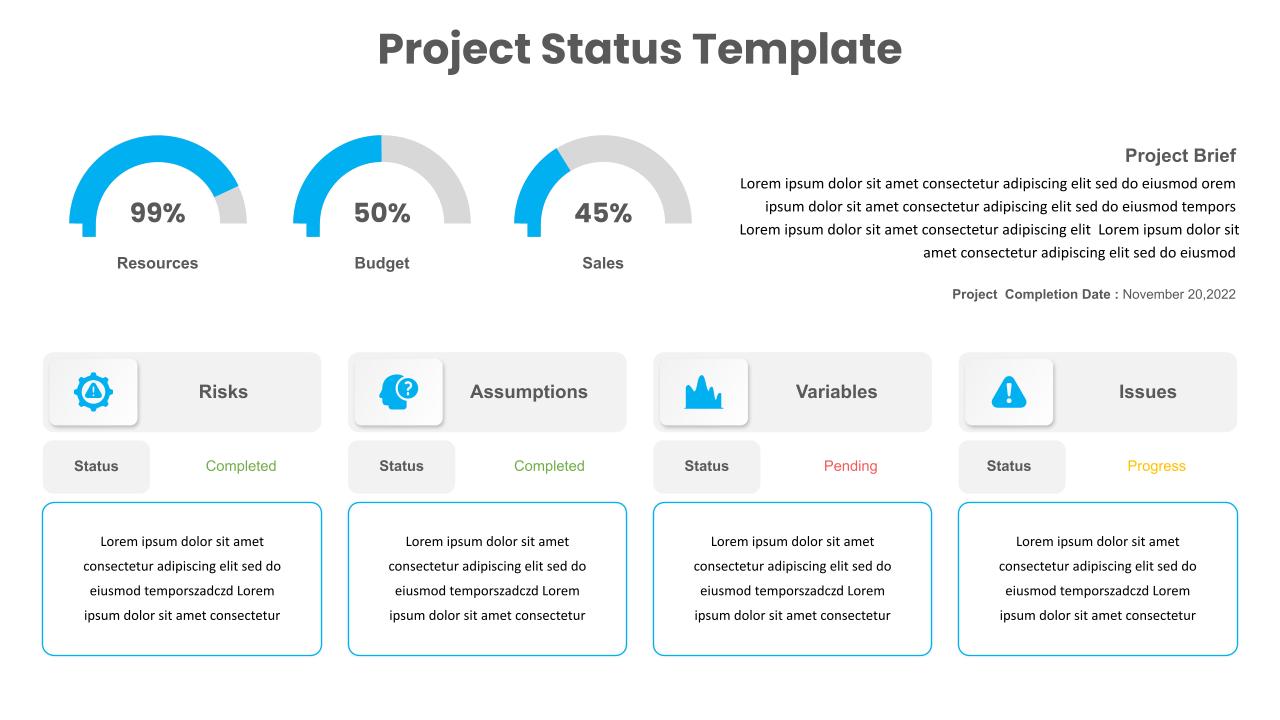
Project timeline presentations, task distribution charts, workflow process diagrams, team role definitions, client project updates, strategic planning sessions, Agile methodology presentations, project status reports, milestone tracking, resource allocation charts.FAQs
You May Also Like These Presentation Templates


- Free
- Free
- Free
- Free
- Free
- Free
- Free
- Free
- Free