Rose Diagram PowerPoint Template
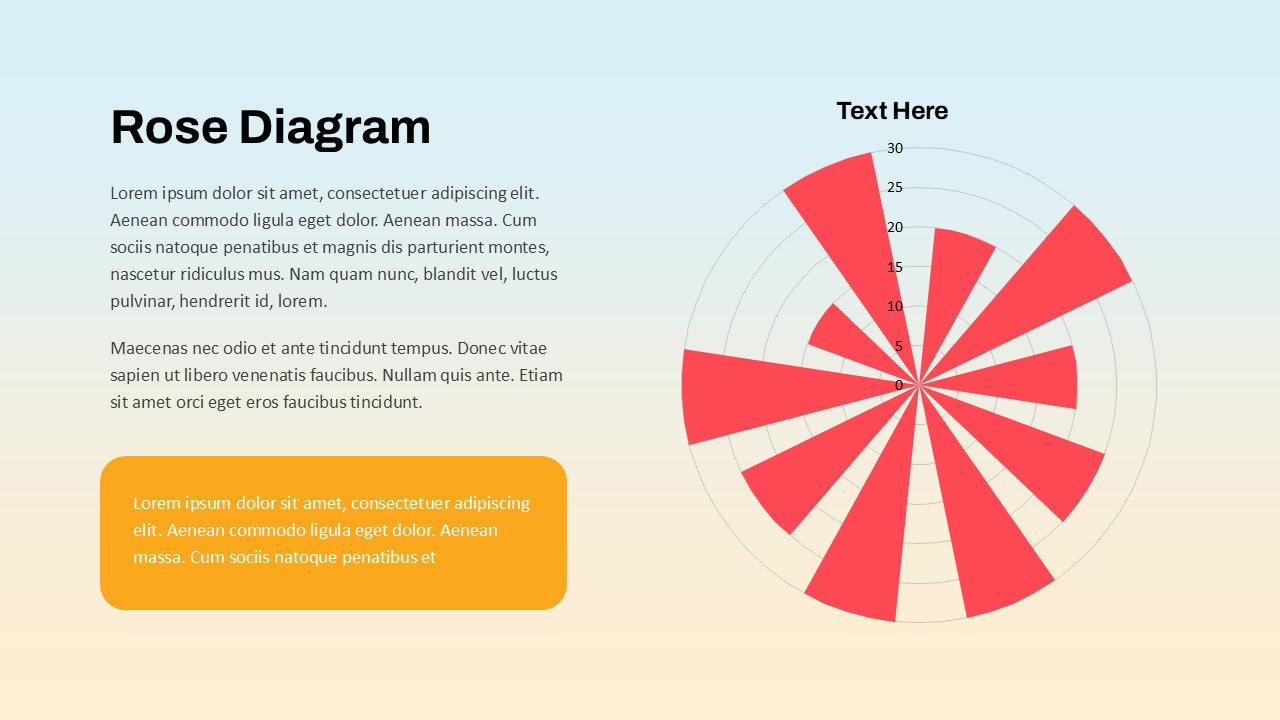
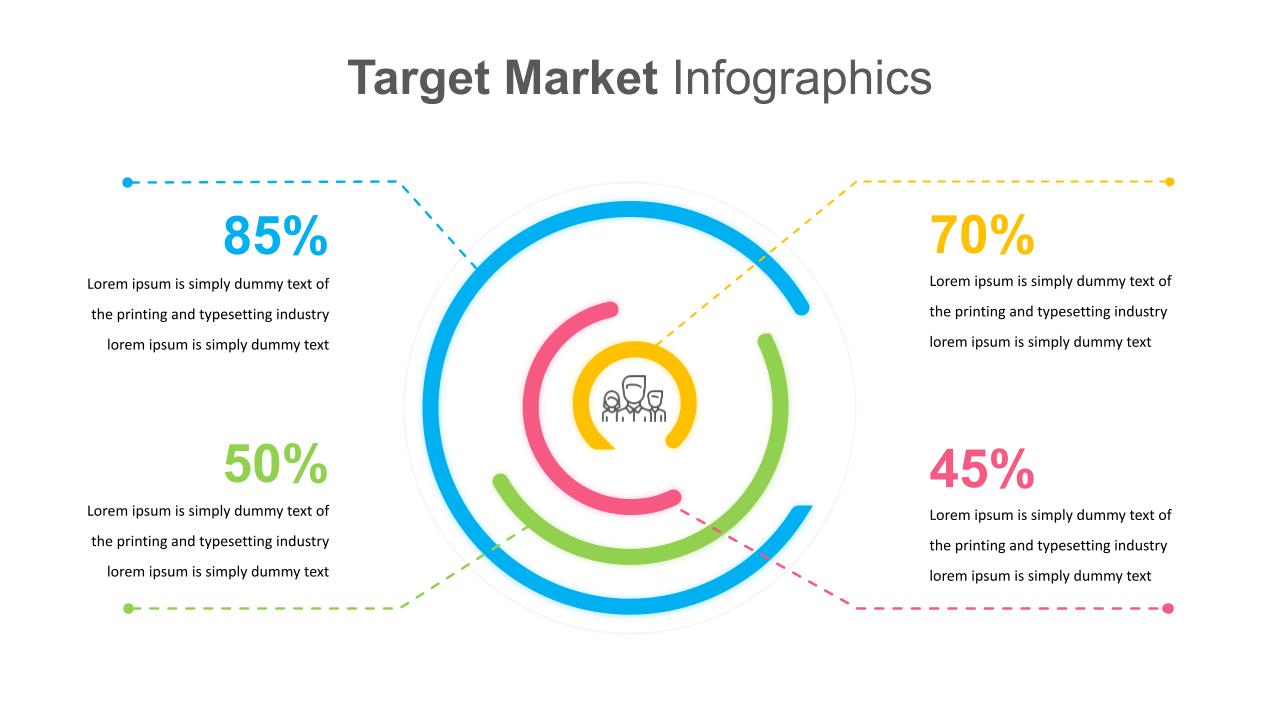
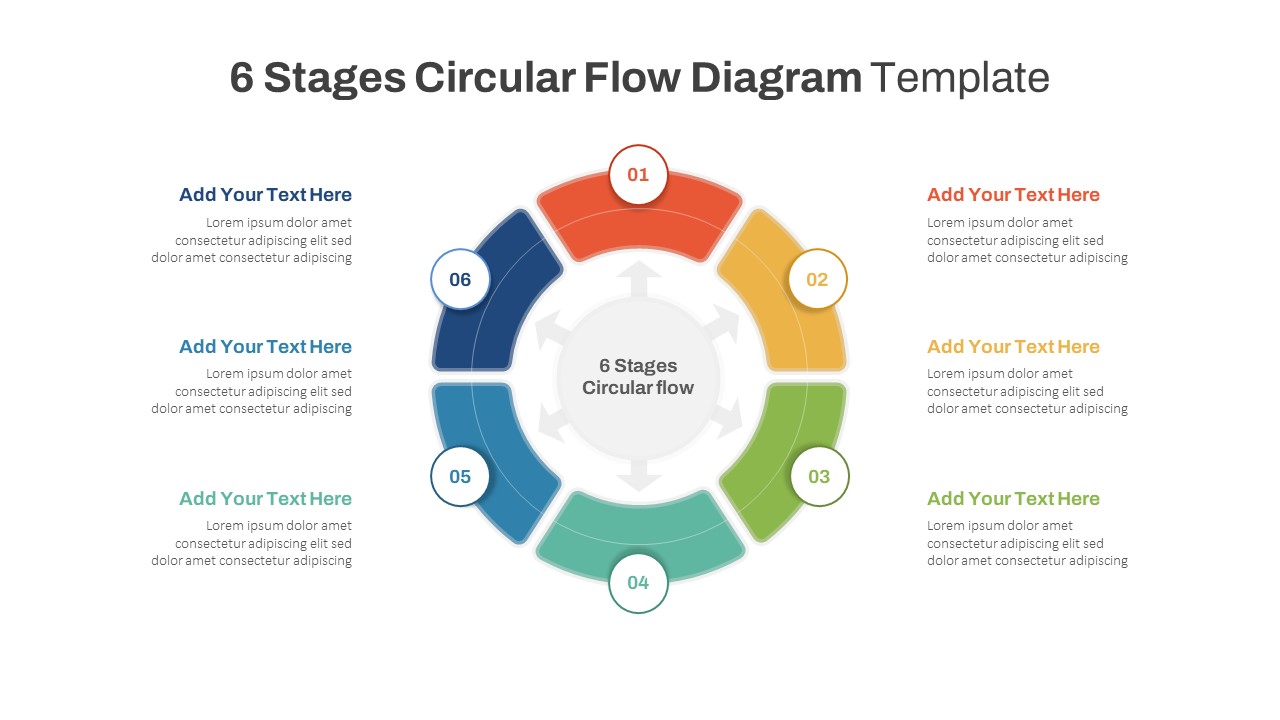
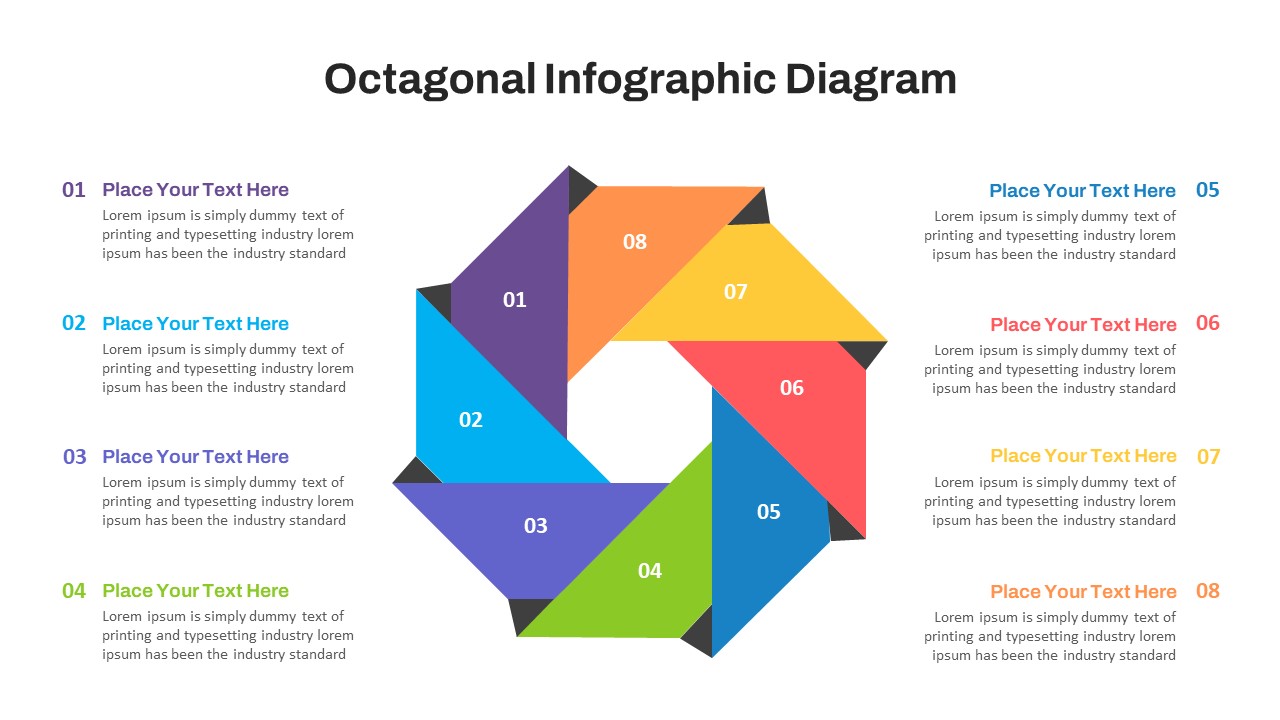
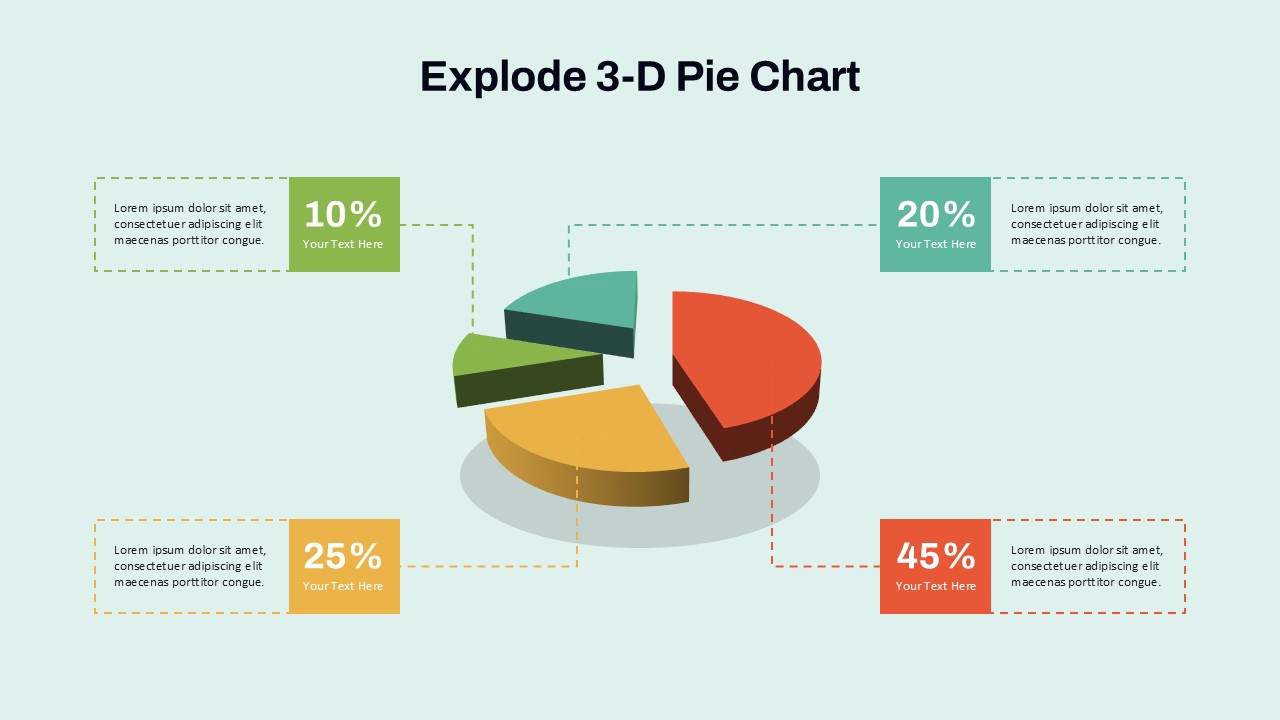
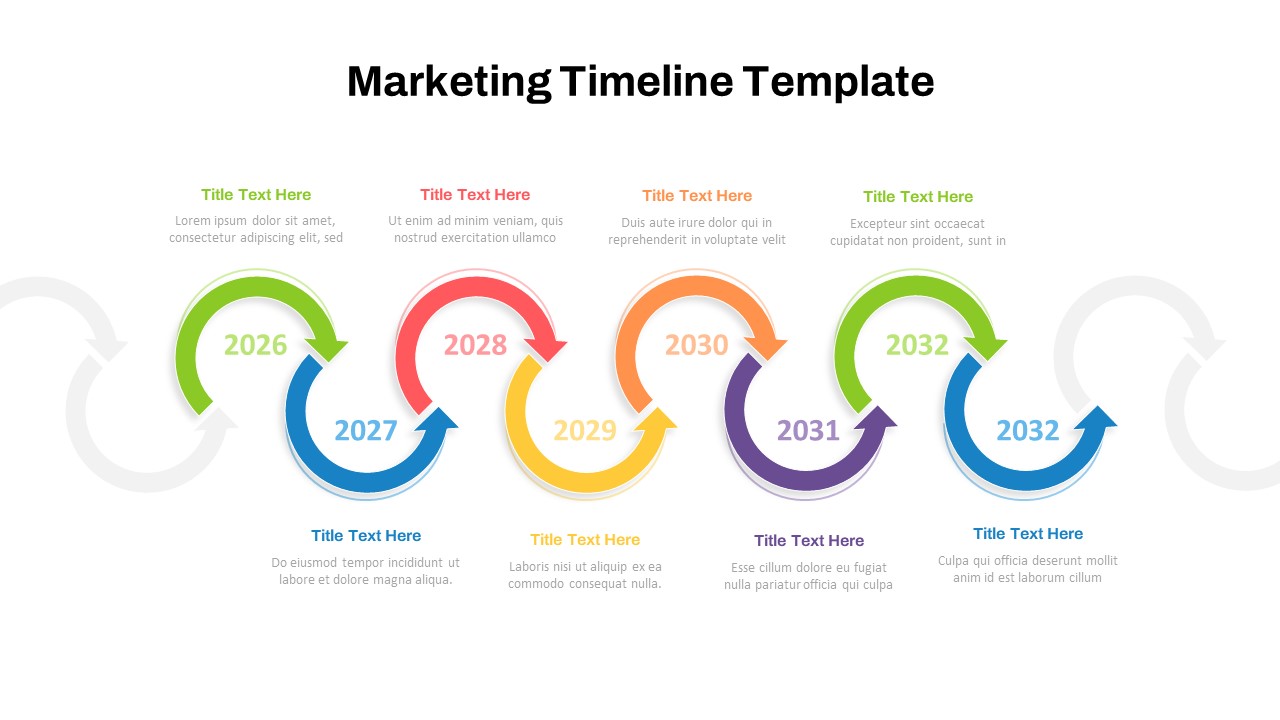
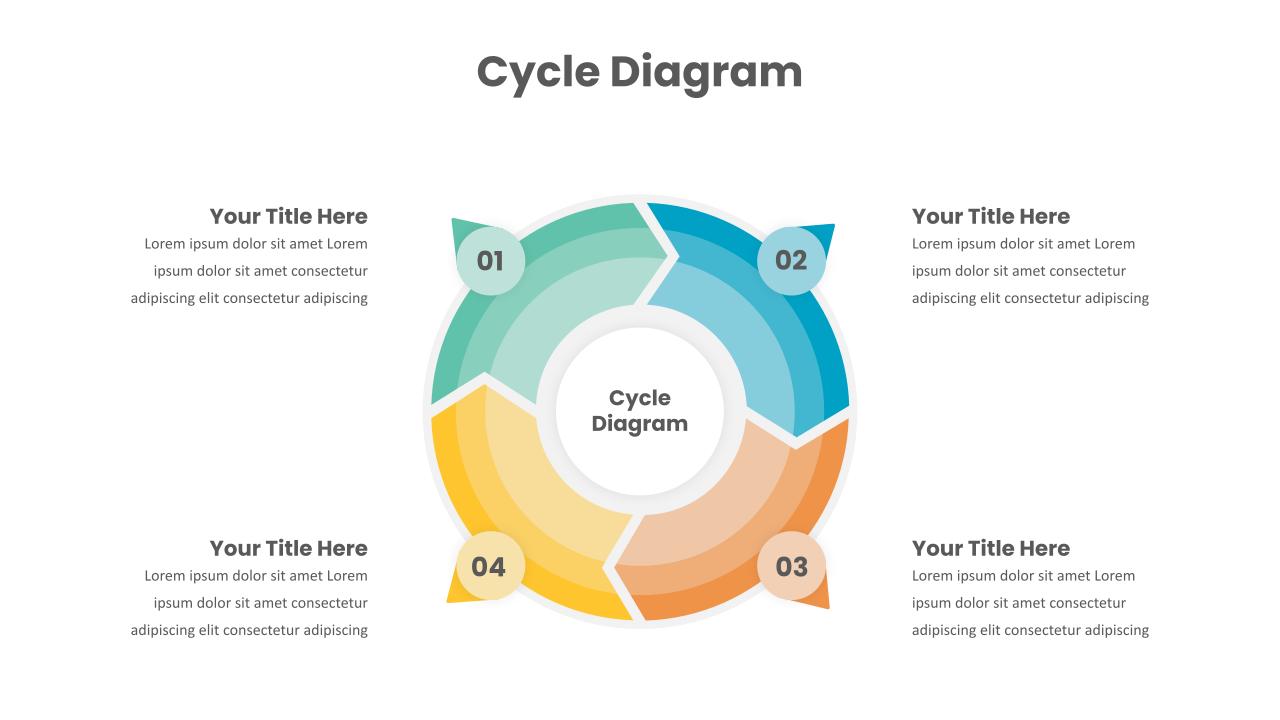
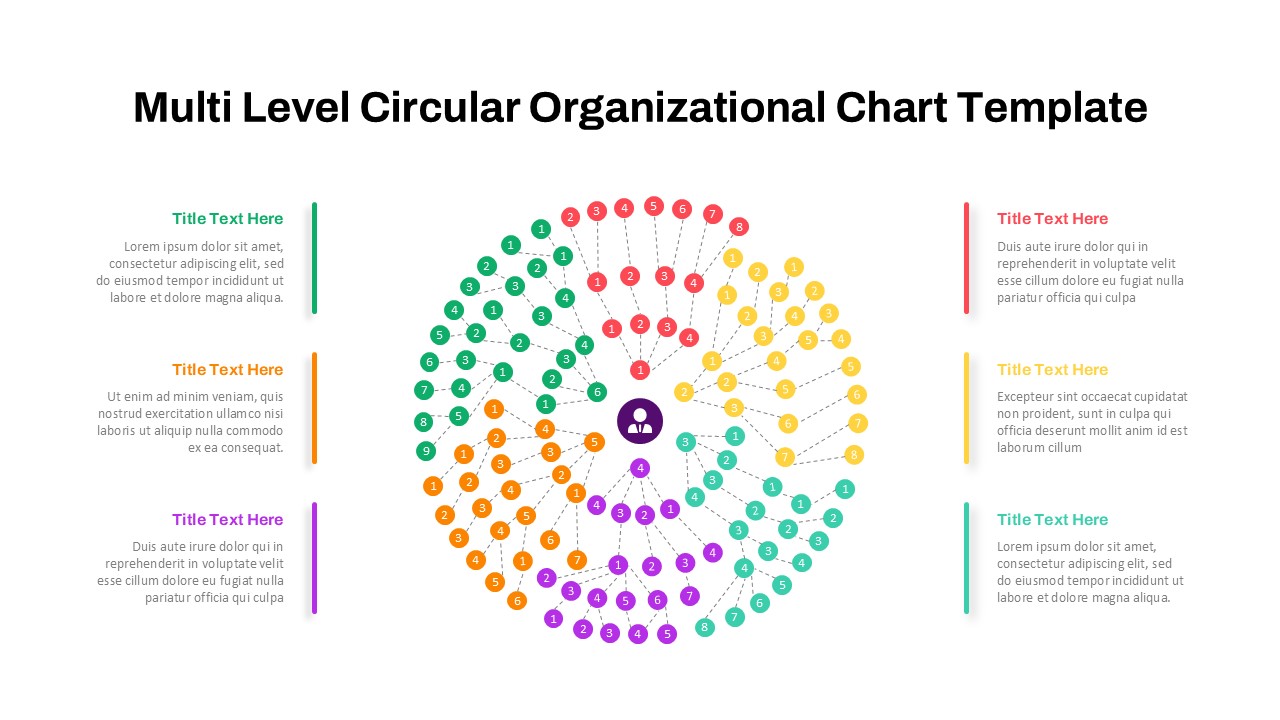
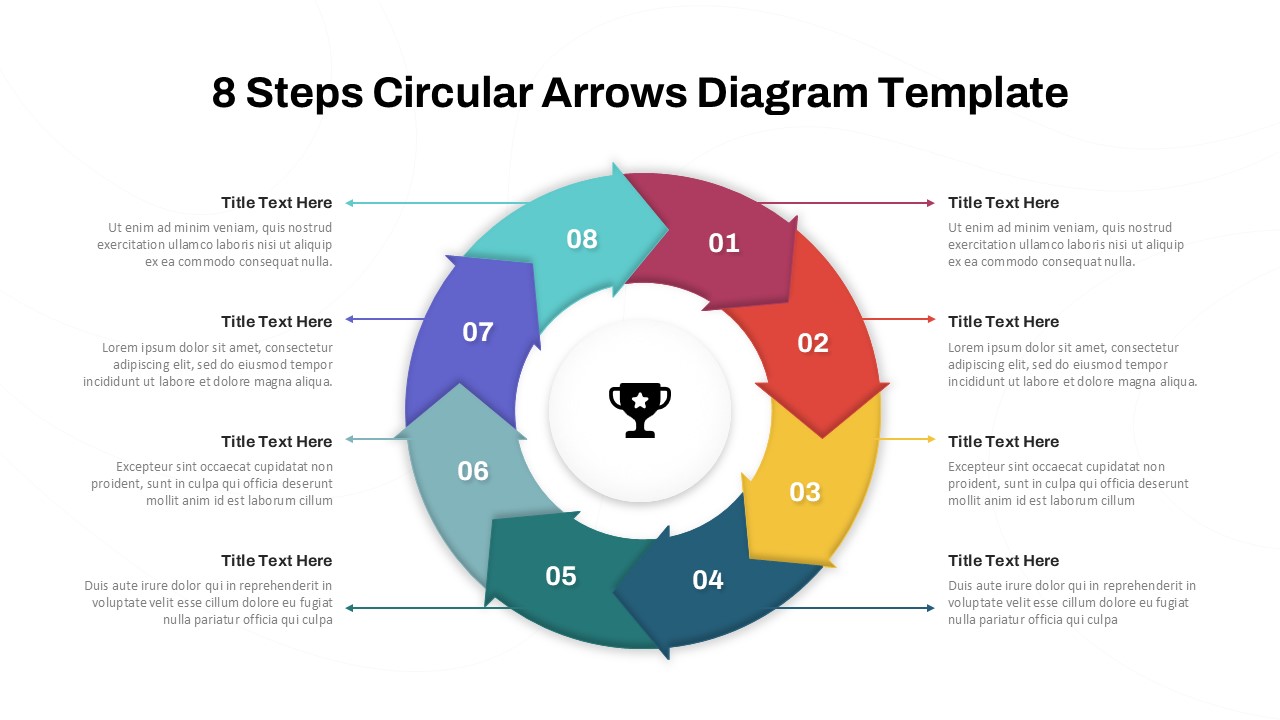
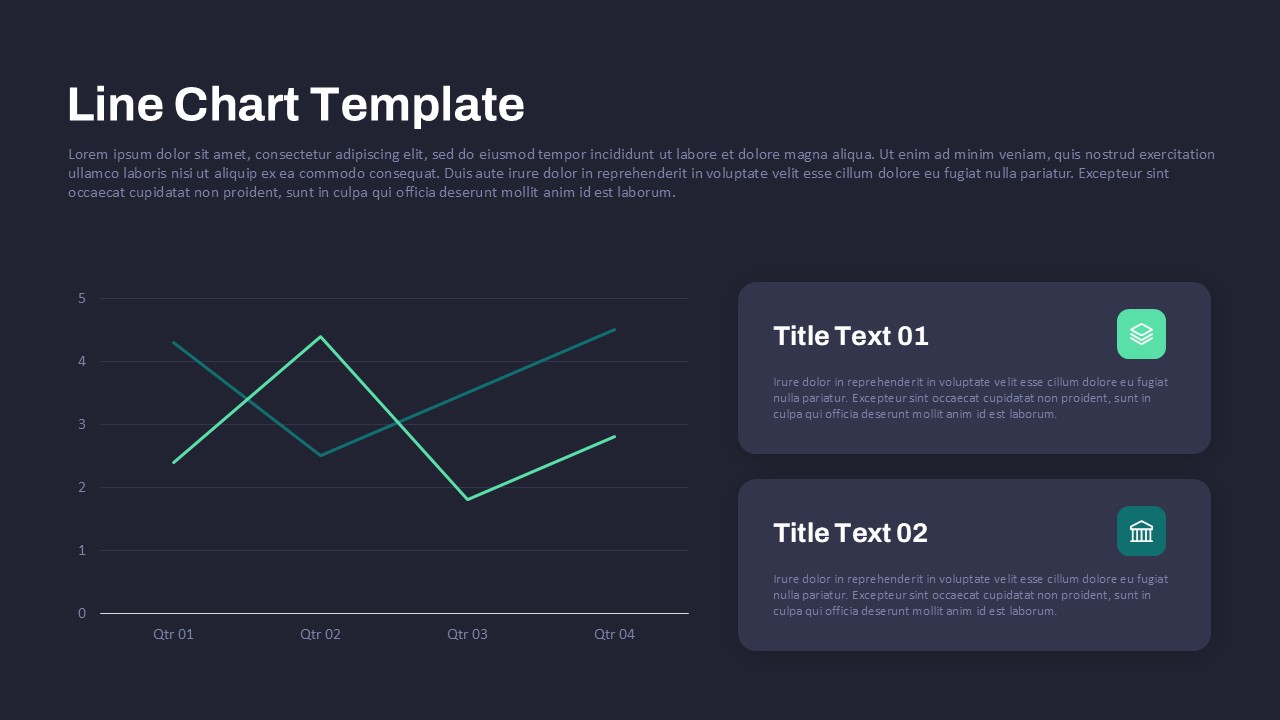
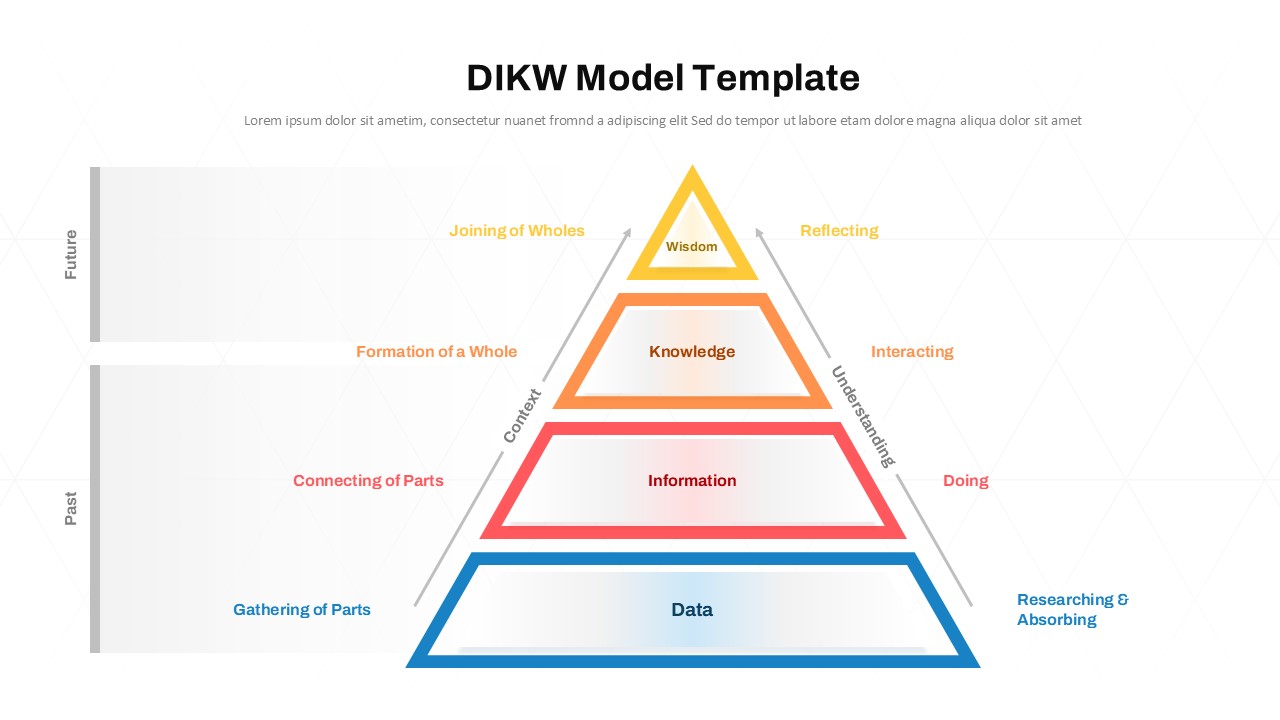
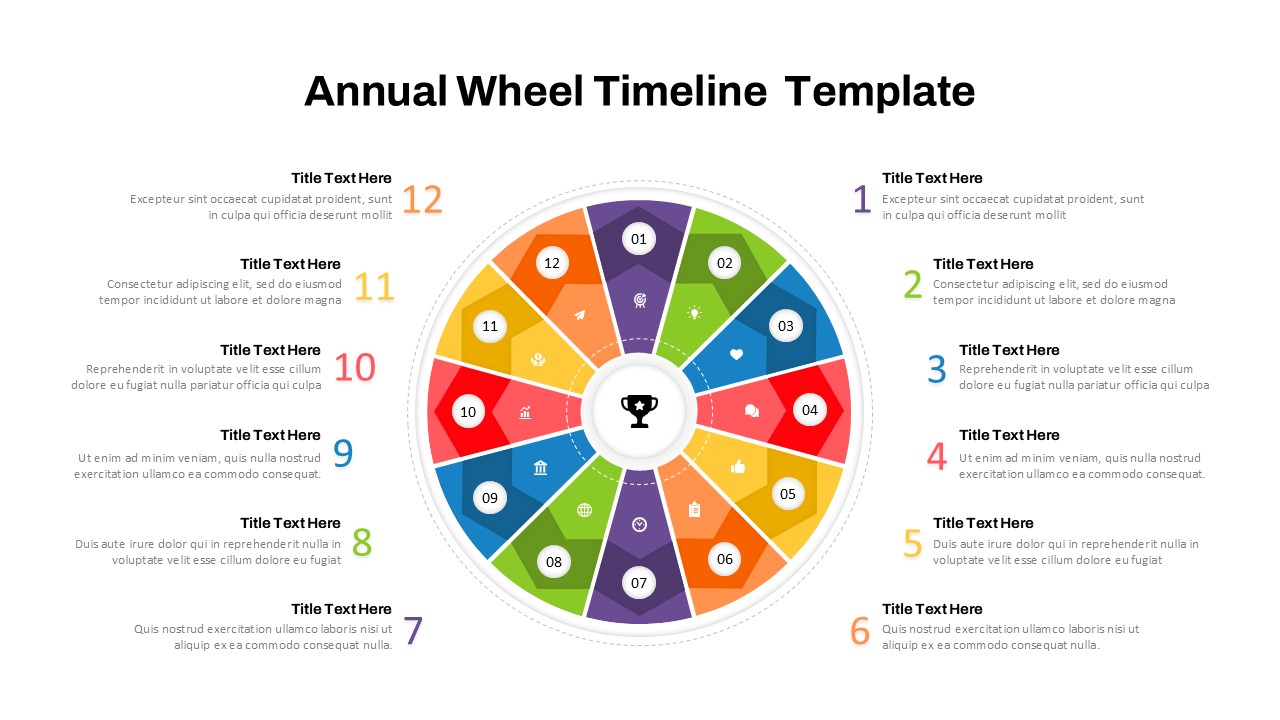
The Rose Diagram PowerPoint Template offers an engaging and visually captivating way to present data with a radial representation. Perfect for illustrating cyclical data, trends over time, or categorical comparisons, this template adds a unique, professional touch to any business or academic presentation. The dynamic design highlights key data points in a way that is easy to interpret and visually appealing, ensuring your audience grasps complex information at a glance.
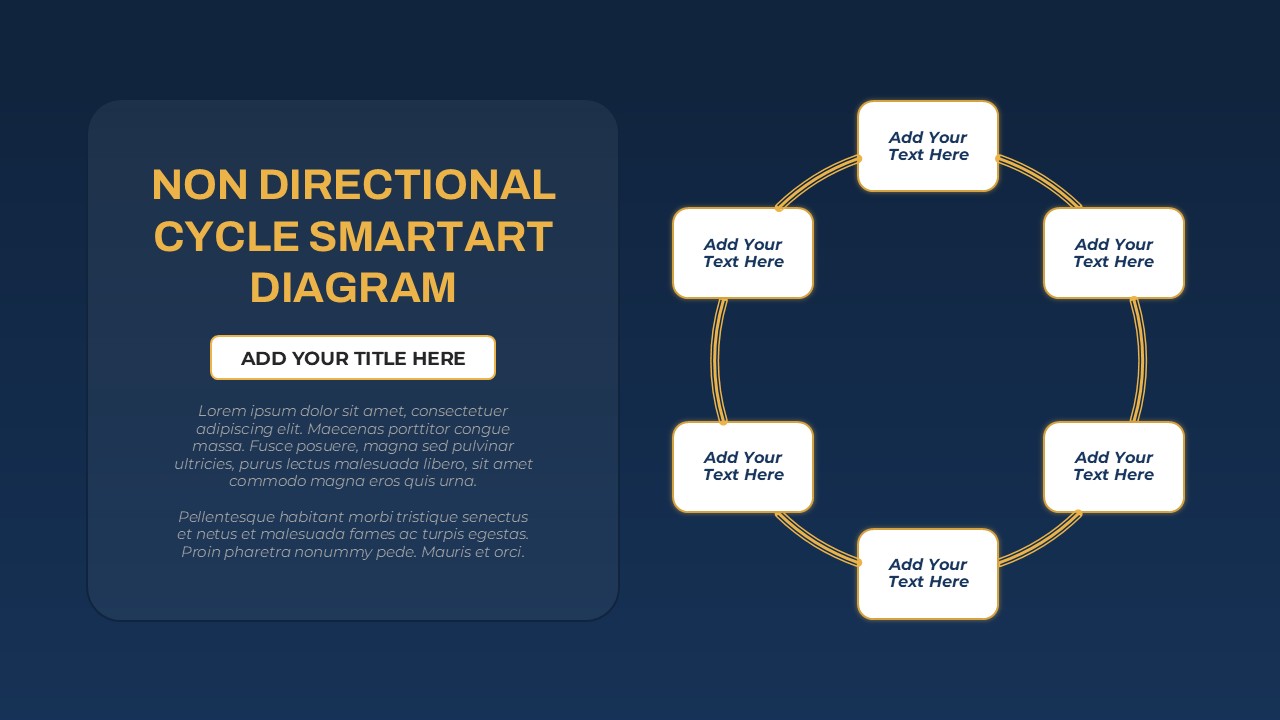
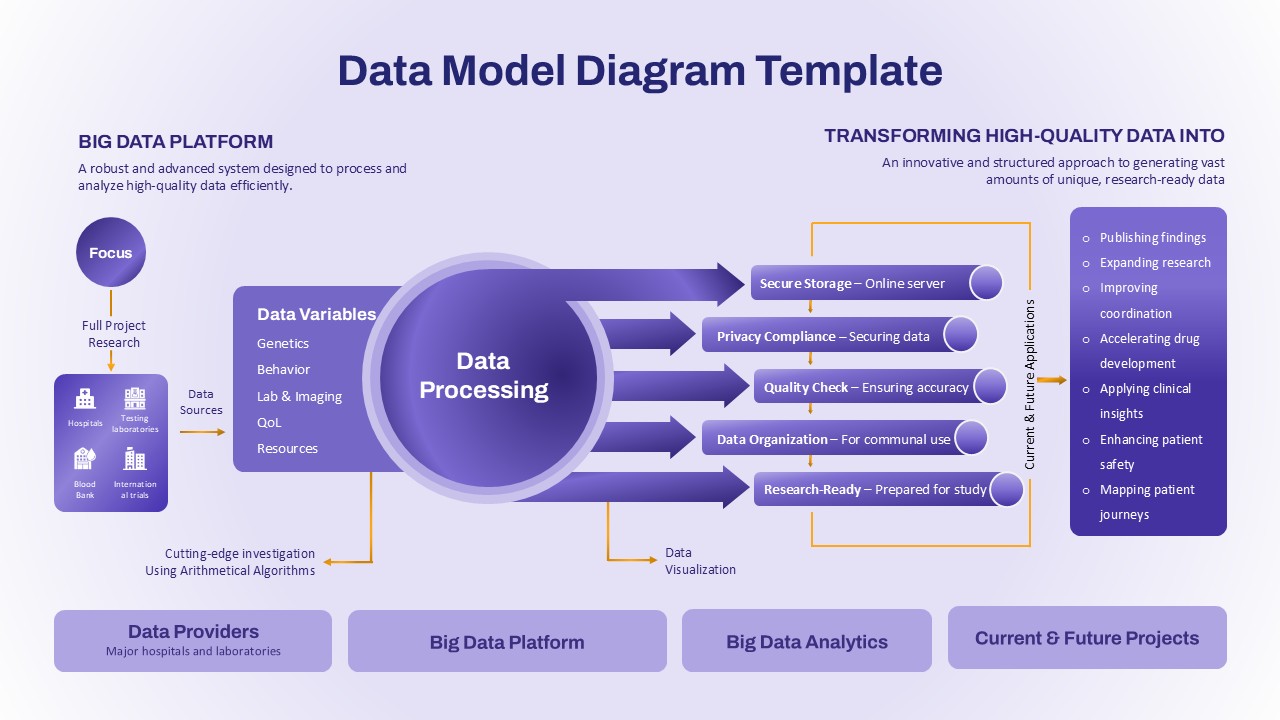
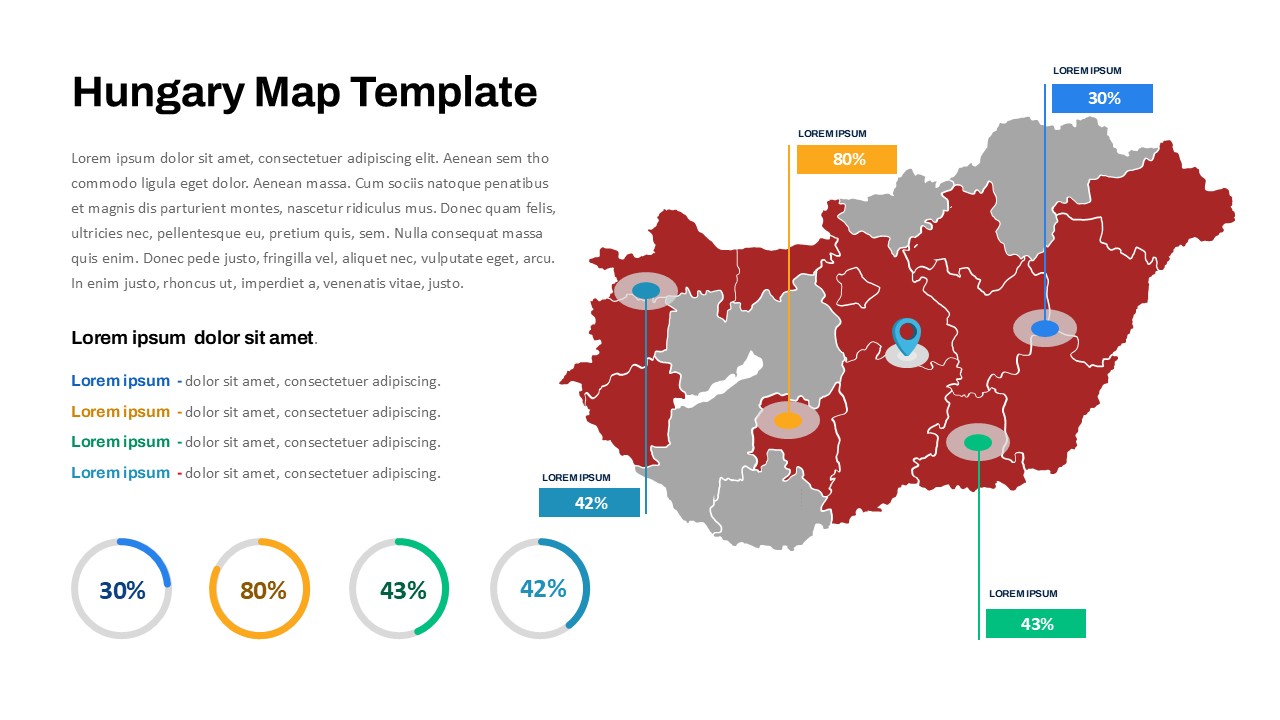
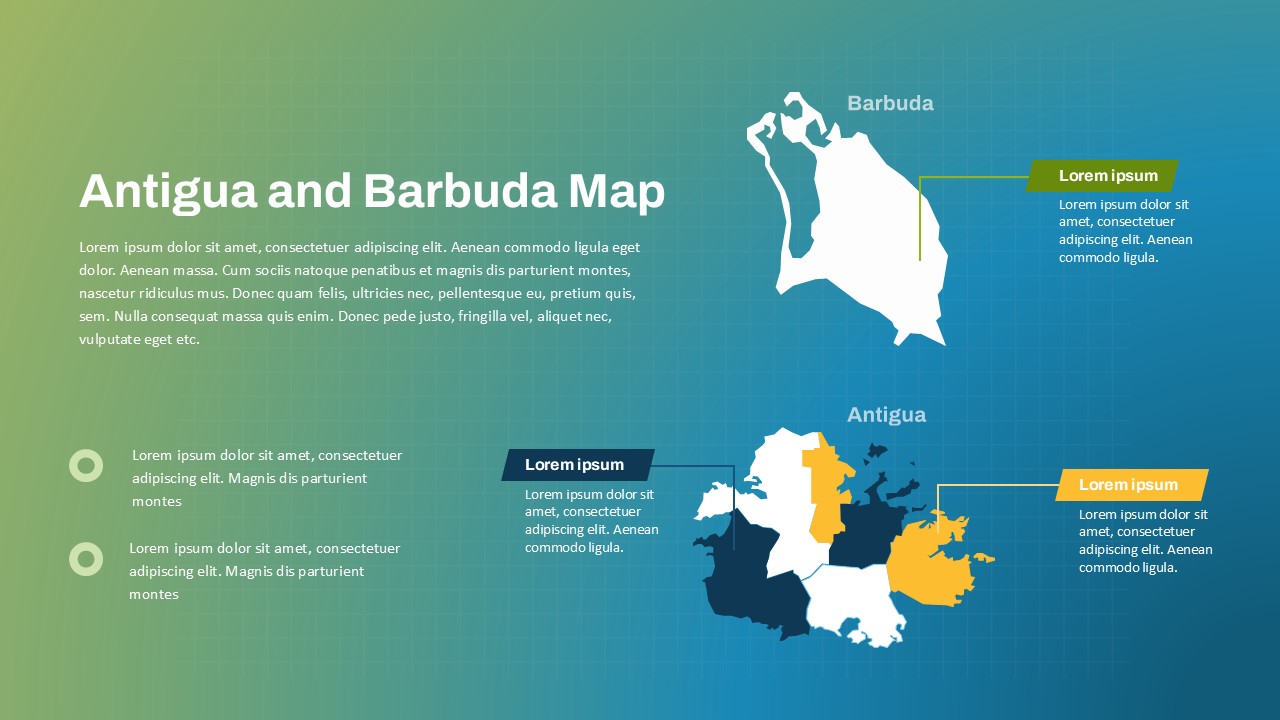
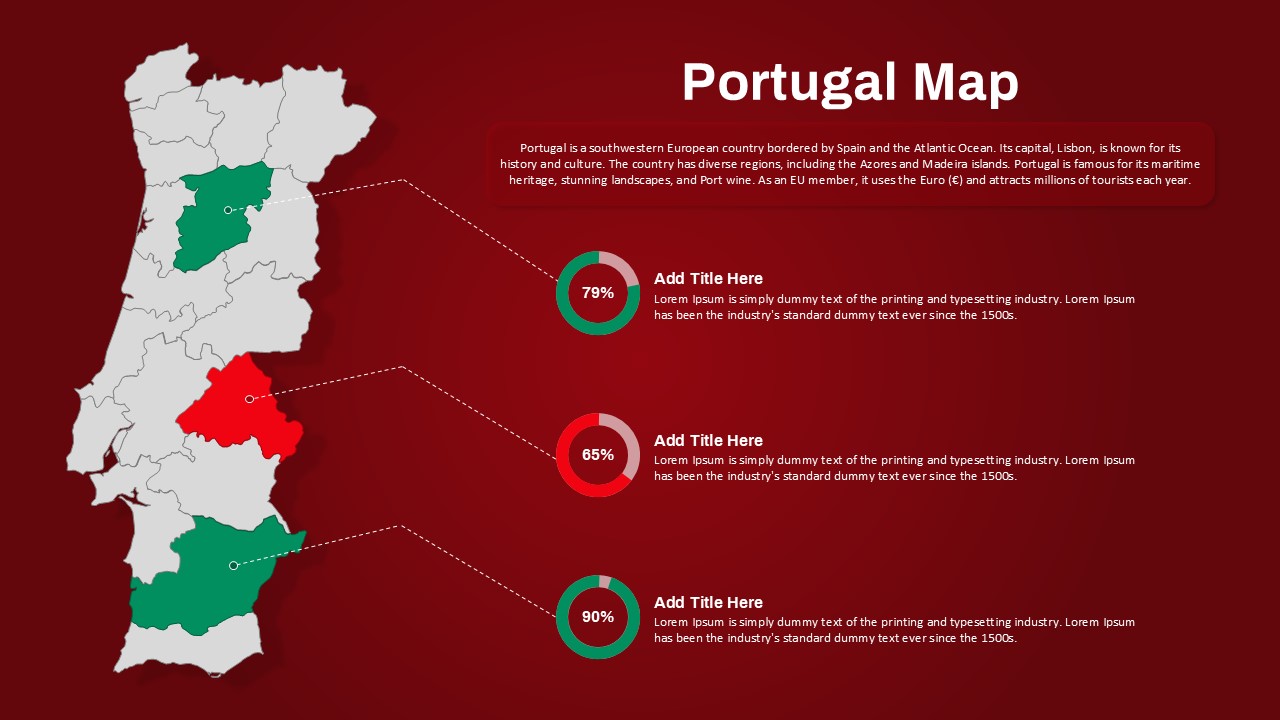
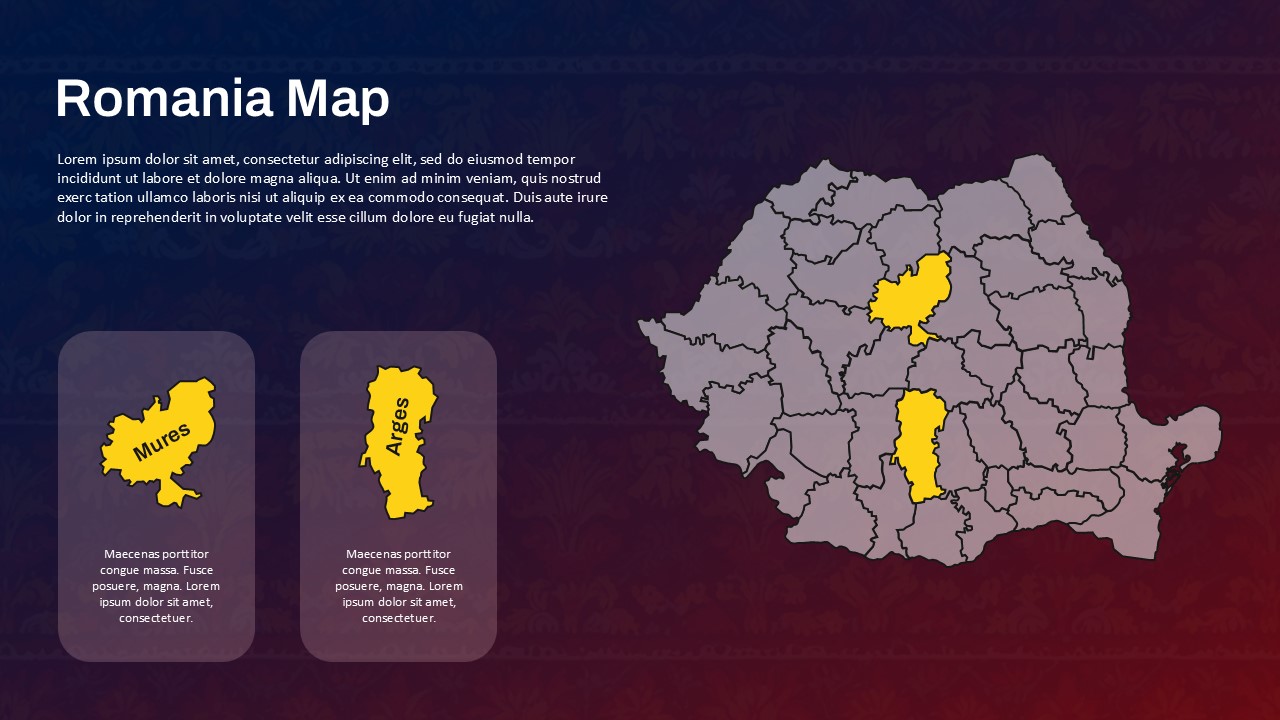
The rose diagram itself, with its clearly defined segments, allows for detailed data visualization, where each section can be customized with specific values or information. Whether you’re tracking seasonal trends, geographic data, or other variable-driven statistics, this template offers versatility and clarity. It’s designed to help presenters maintain the audience’s focus while delivering insightful content.
This template is an excellent choice for business analysts, marketers, educators, and anyone looking to present data in a more visually striking and understandable way.
See more

Aspect Ratio
16:9Item ID
SKT03533
Features of this template
Other User Cases of the Template:
Data presentations, market analysis, trend tracking, seasonal analysis, geographical data visualization, statistical reports, business analysis, academic presentations, project progress tracking, demographic data analysis.FAQs
You May Also Like These Presentation Templates


- Free
- Free


- Free

- Free
- Free

- Free
- Free
- Free