Simple Burnup Chart PowerPoint Template
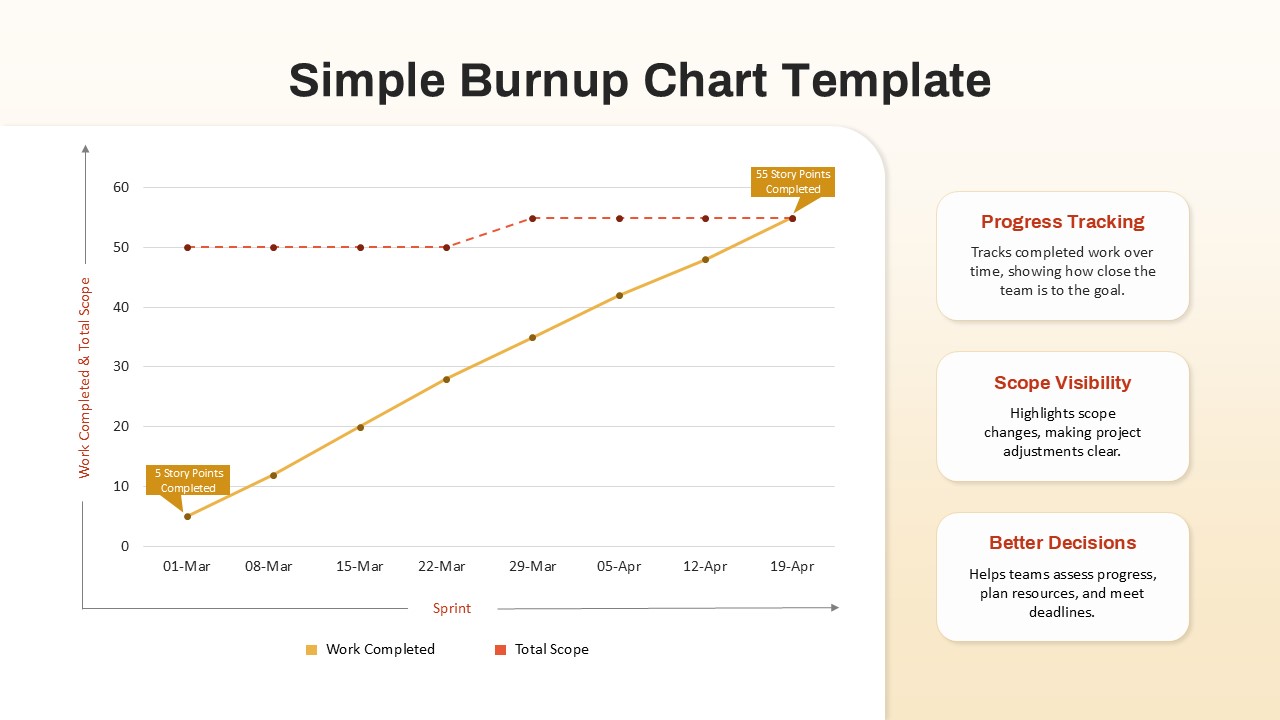
The Simple Burnup Chart Presentation Template is a clear and effective tool for visualizing project progress in Agile environments. Designed with both simplicity and functionality in mind, this template allows teams to track completed work against the total project scope over time, offering valuable insights into performance trends and sprint outcomes.
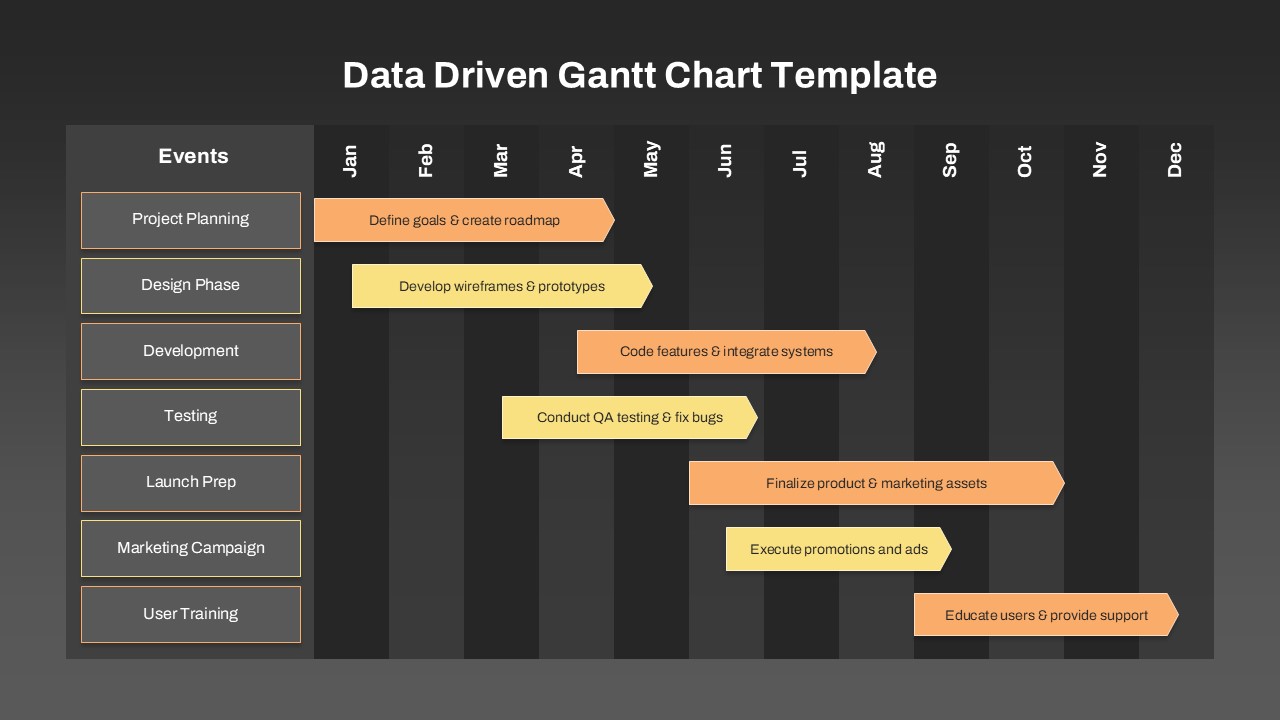
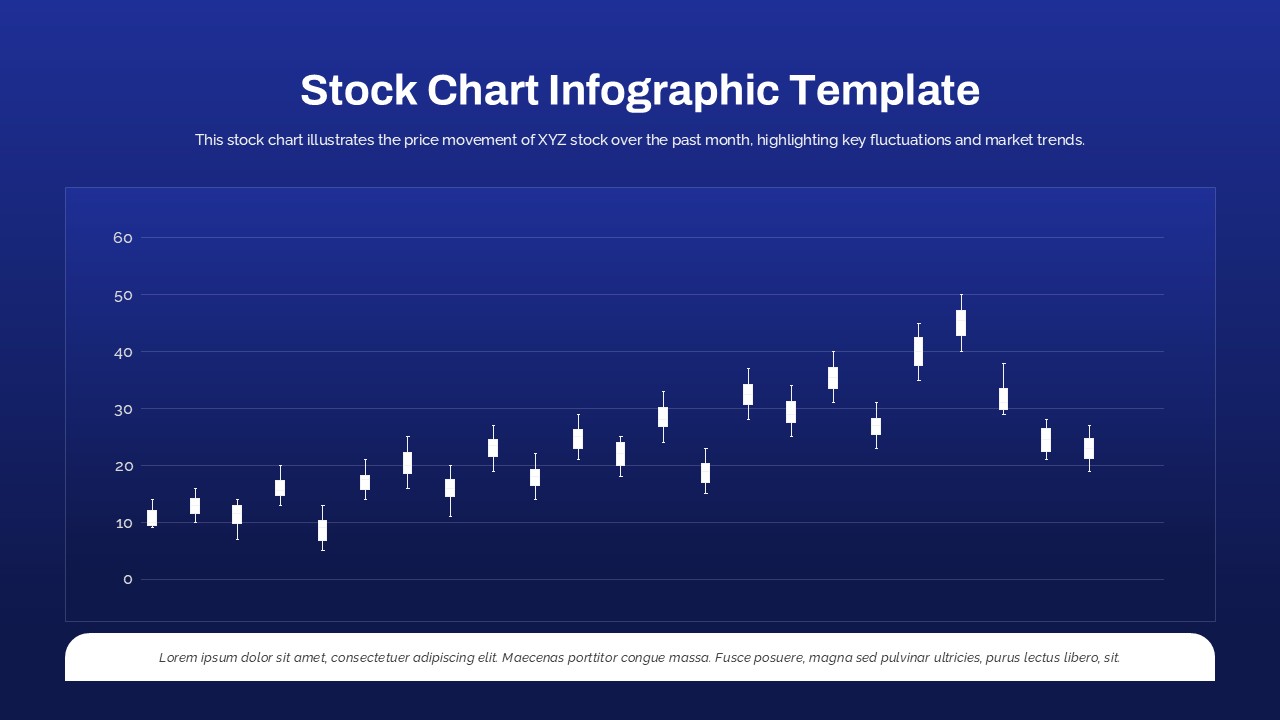
The chart displays two key metrics—Work Completed and Total Scope—mapped across a timeline of sprints. As story points accumulate, stakeholders can easily see whether the team is on track, over-committing, or adjusting to new scope changes. With annotations marking specific milestones (such as “5 Story Points Completed” and “55 Story Points Completed”), this layout is perfect for sprint reviews, planning meetings, and executive updates.
Supporting panels on the right explain the chart’s value: Progress Tracking, Scope Visibility, and Better Decisions. These elements highlight how burnup charts help teams assess work velocity, manage scope creep, and stay aligned with delivery goals.
Ideal for Scrum Masters, product owners, and project managers, this template is fully editable in PowerPoint and Google Slides. Users can adjust date ranges, chart values, colors, and annotations to reflect real project data. Whether you’re managing software development, marketing workflows, or business process improvements, this template turns complex tracking into a visual narrative.
See more

Aspect Ratio
16:9Item ID
SKT03433
Features of this template
Other User Cases of the Template:
Agile sprint reviews, product backlog tracking, software development progress, project scope management, team performance reporting, stakeholder updates, Kanban board analysis, capacity planning, velocity tracking, milestone retrospectives
FAQs
You May Also Like These Presentation Templates

- Free

- Free
- Free
- Free
- Free

- Free
- Free