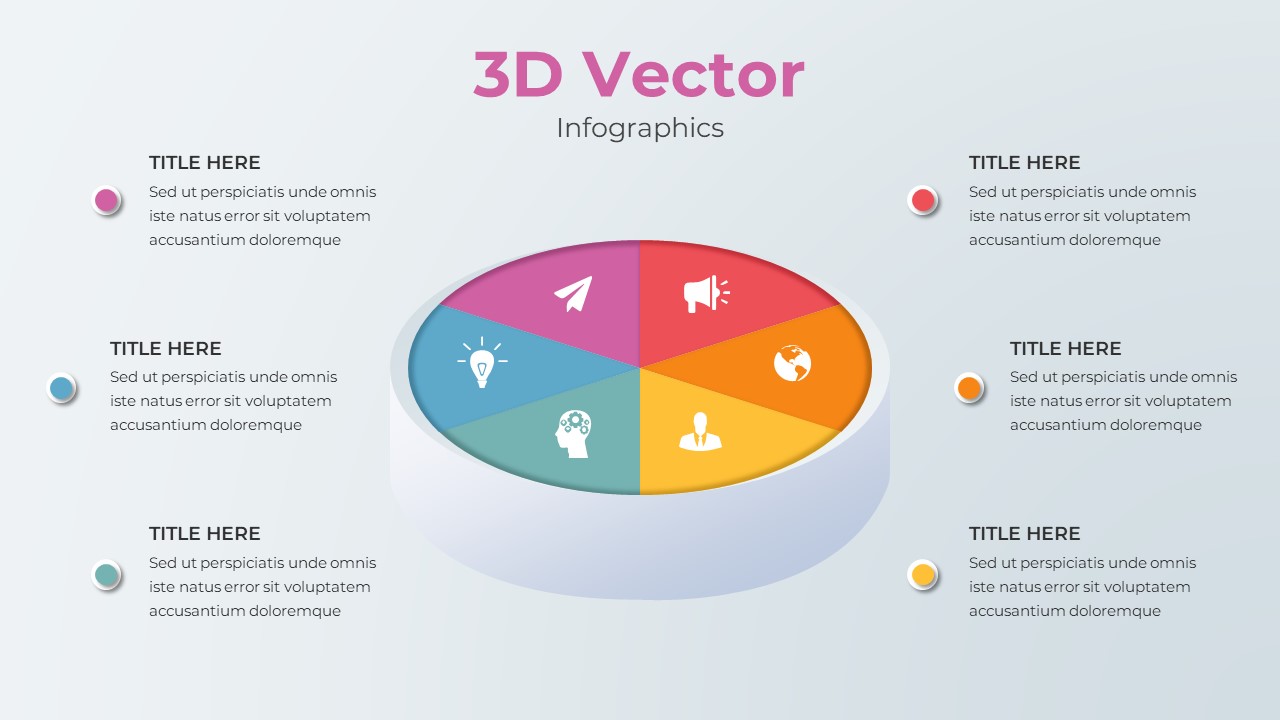
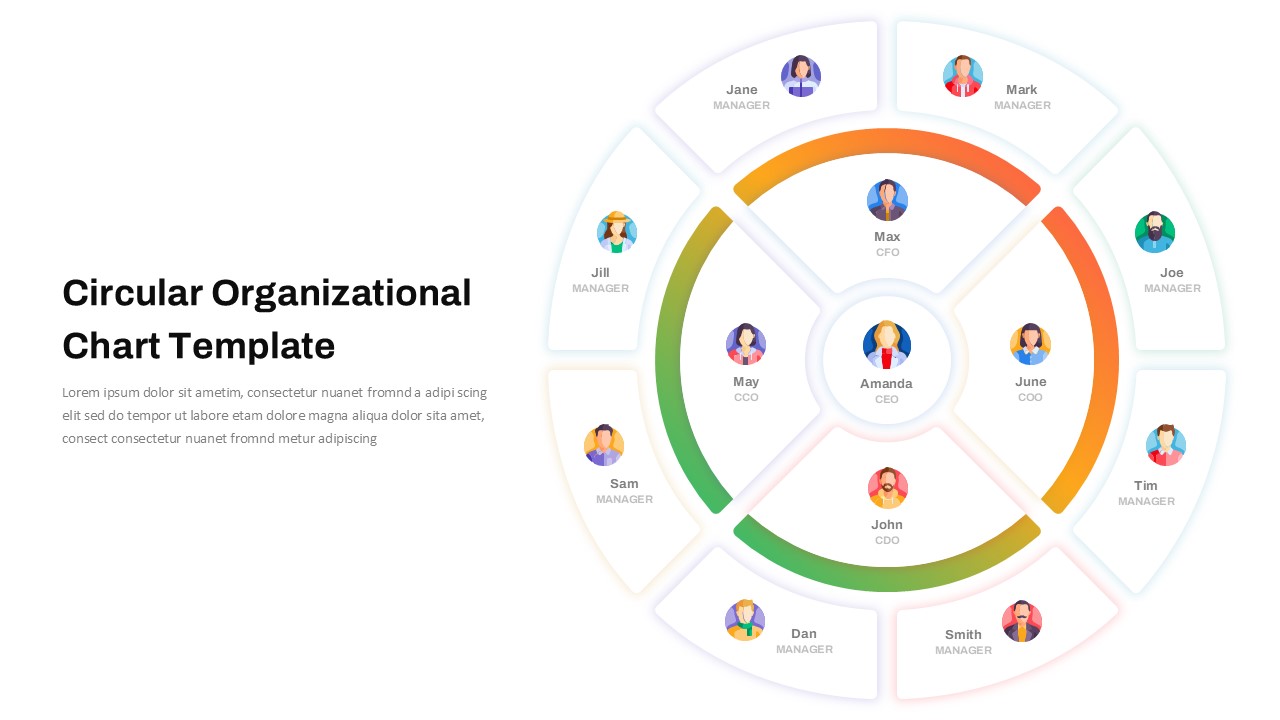
Simple Donut Chart Presentation Template

The Donut Chart Presentation Template is an effective tool for visually representing segmented data in a clear, professional format. Donut charts are widely used to display proportional data while offering an aesthetically pleasing alternative to traditional pie charts. This Donut Chart PowerPoint template features a multi-color donut chart with four sections, each clearly labeled with color-coded text and accompanying space for detailed descriptions. It allows users to present key insights or comparisons for quarterly reports, market share, financial metrics, survey results, and more.
The design is modern and clean, ensuring your data remains the focal point of the presentation. The color scheme, with bold tones of blue, green, red, and light cyan, allows for immediate recognition of data categories. The template also includes editable placeholders where you can easily insert text or further explanations for each section of the chart, providing context to the numbers.
This template is ideal for corporate meetings, business reviews, financial updates, or academic research presentations. Its versatility makes it applicable to almost any field, including sales, marketing, finance, healthcare, and education. The chart’s format offers a concise yet impactful way to convey complex data, making your presentation more memorable and engaging.
See more

Aspect Ratio
16:9Item ID
SKT01611
Features of this template
Other User Cases of the Template:
Quarterly business reviews, market share analysis, financial reporting, sales performance analysis, customer segmentation, survey results, educational data breakdowns, project progress updates, marketing campaign results.
FAQs
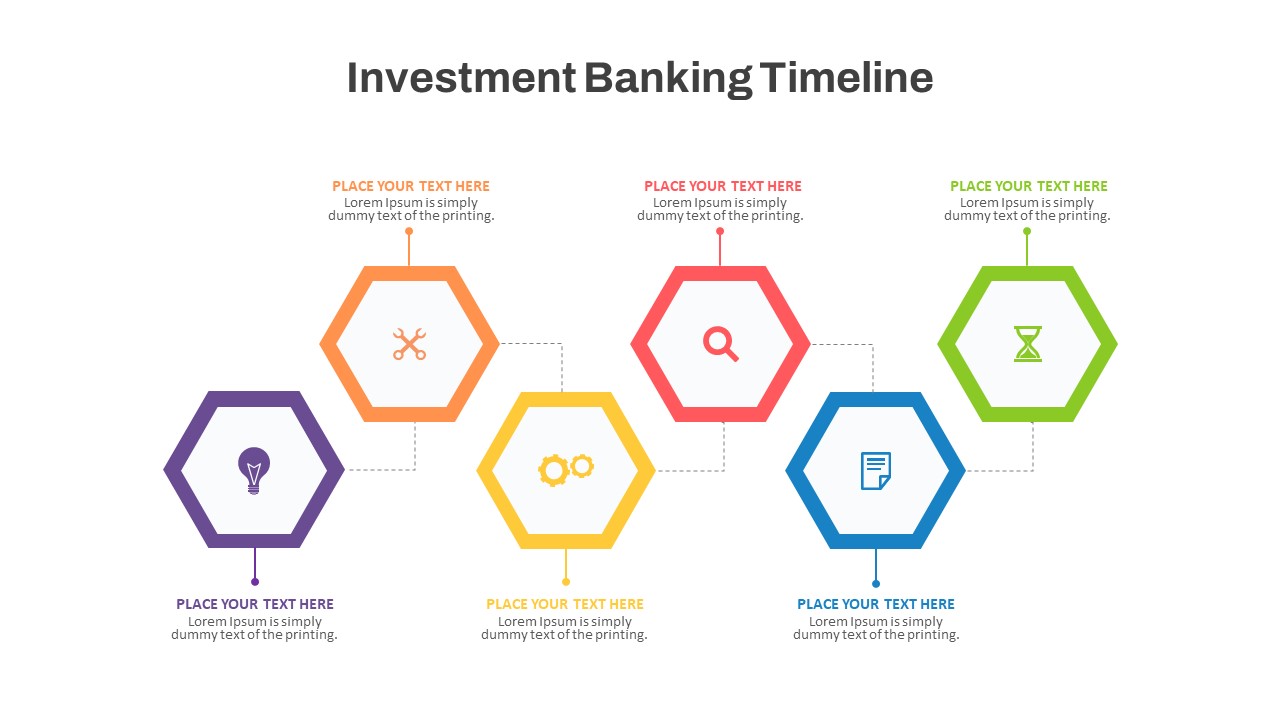
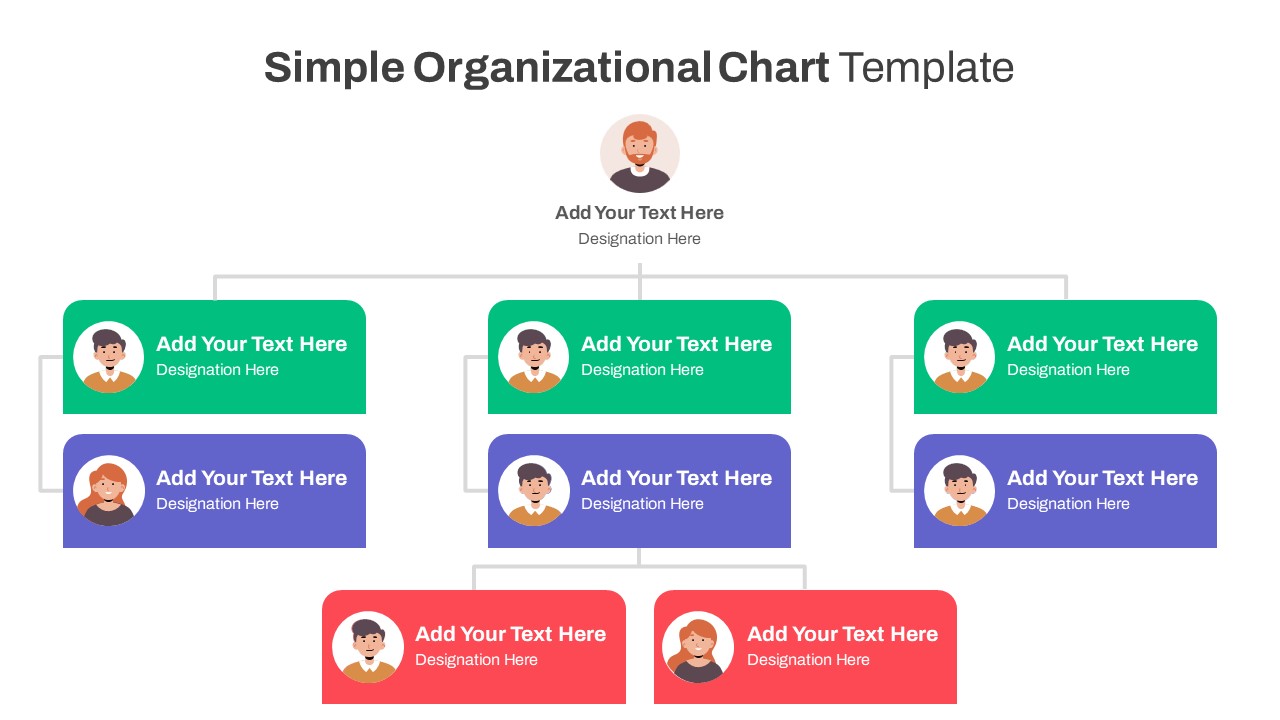
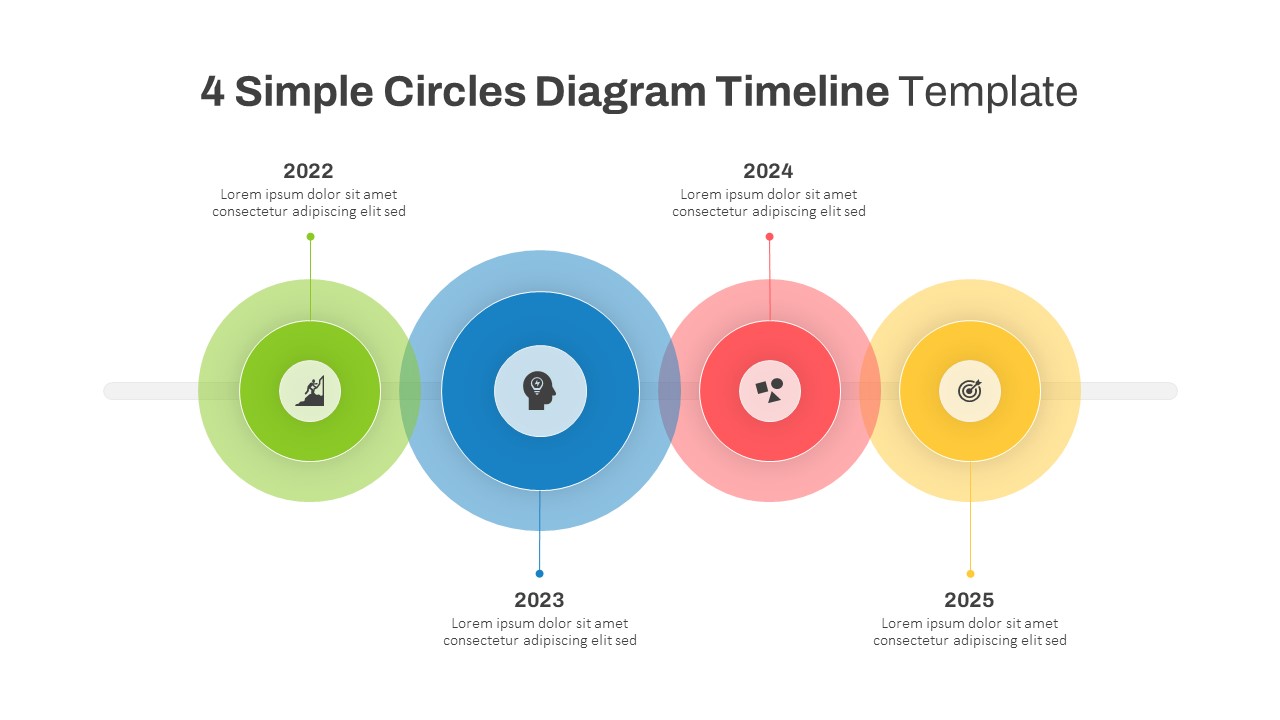
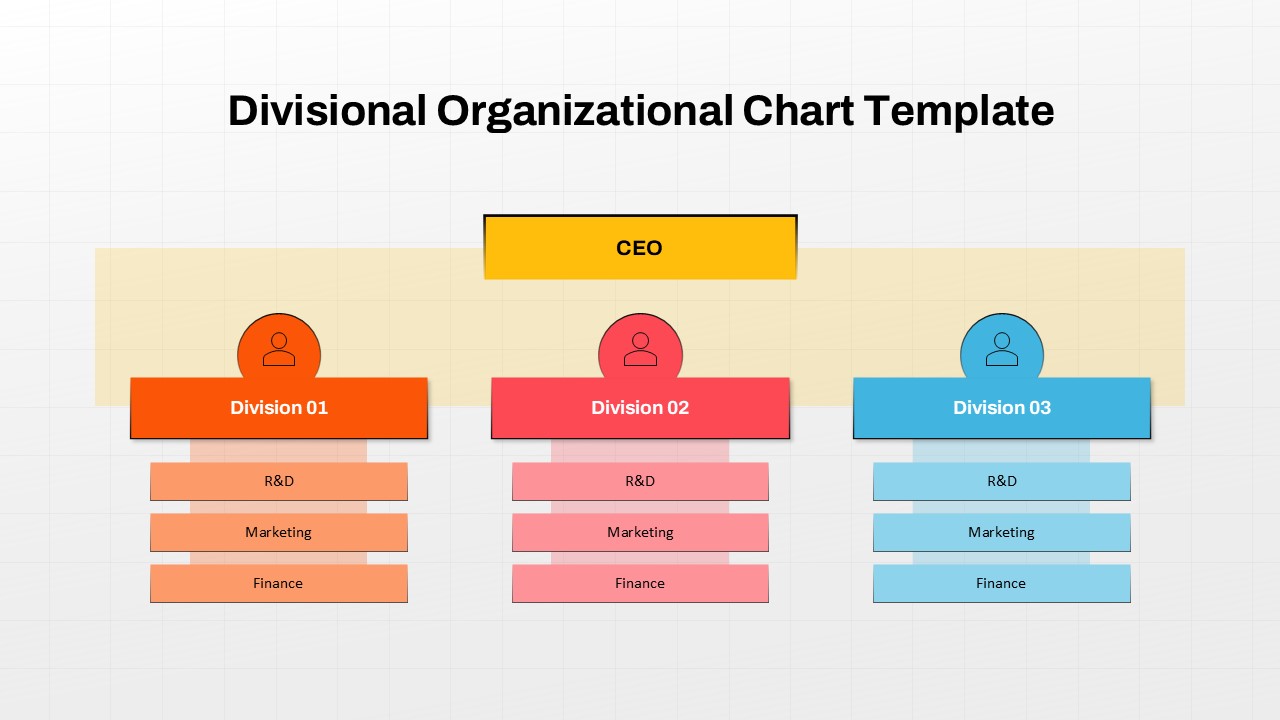
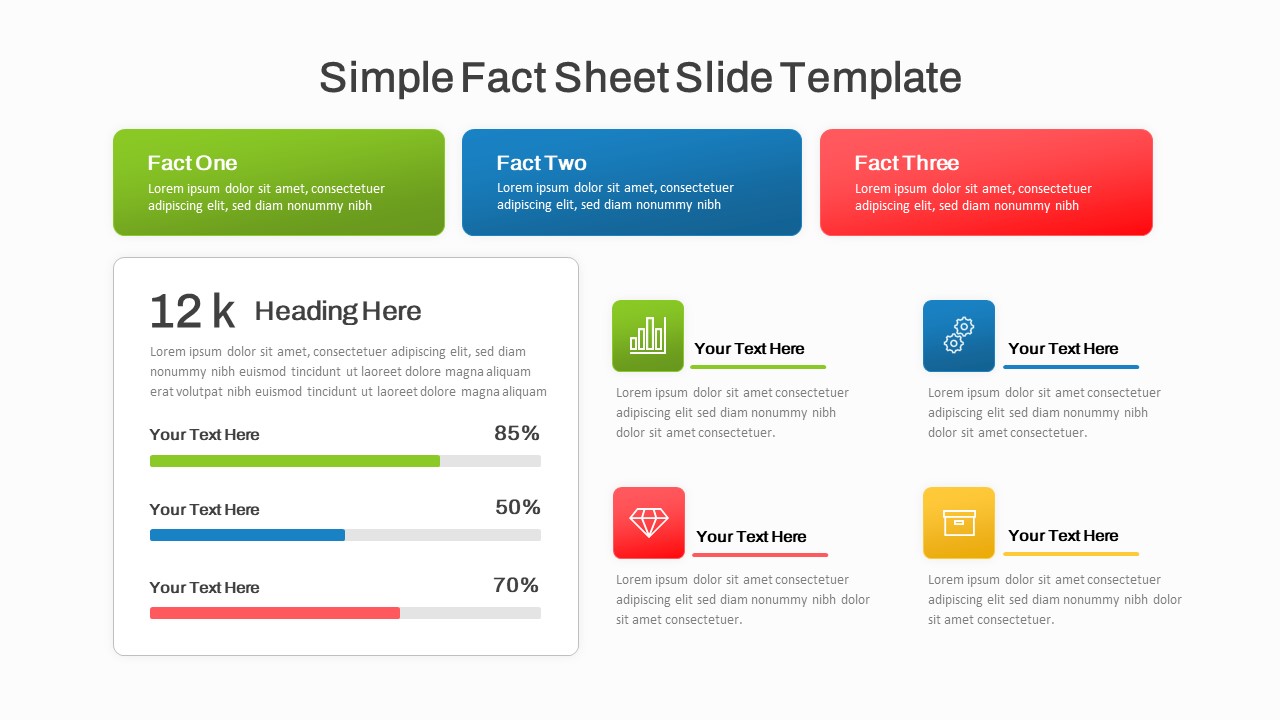
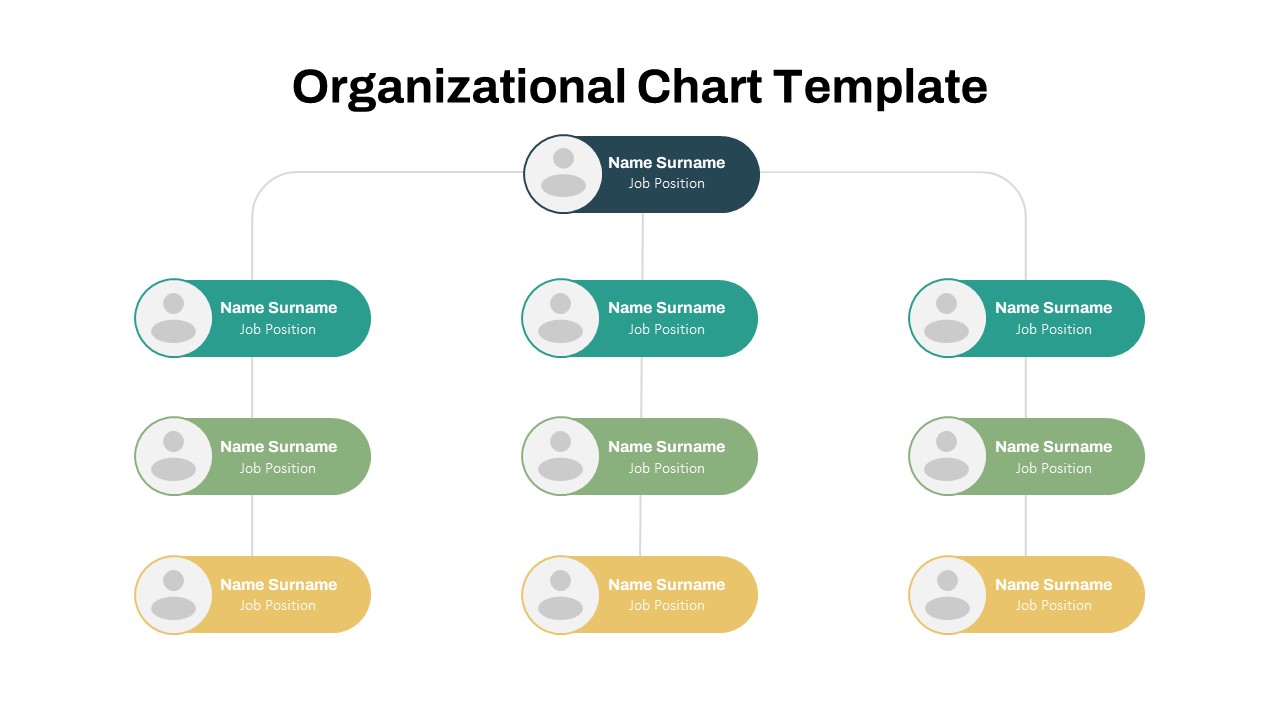
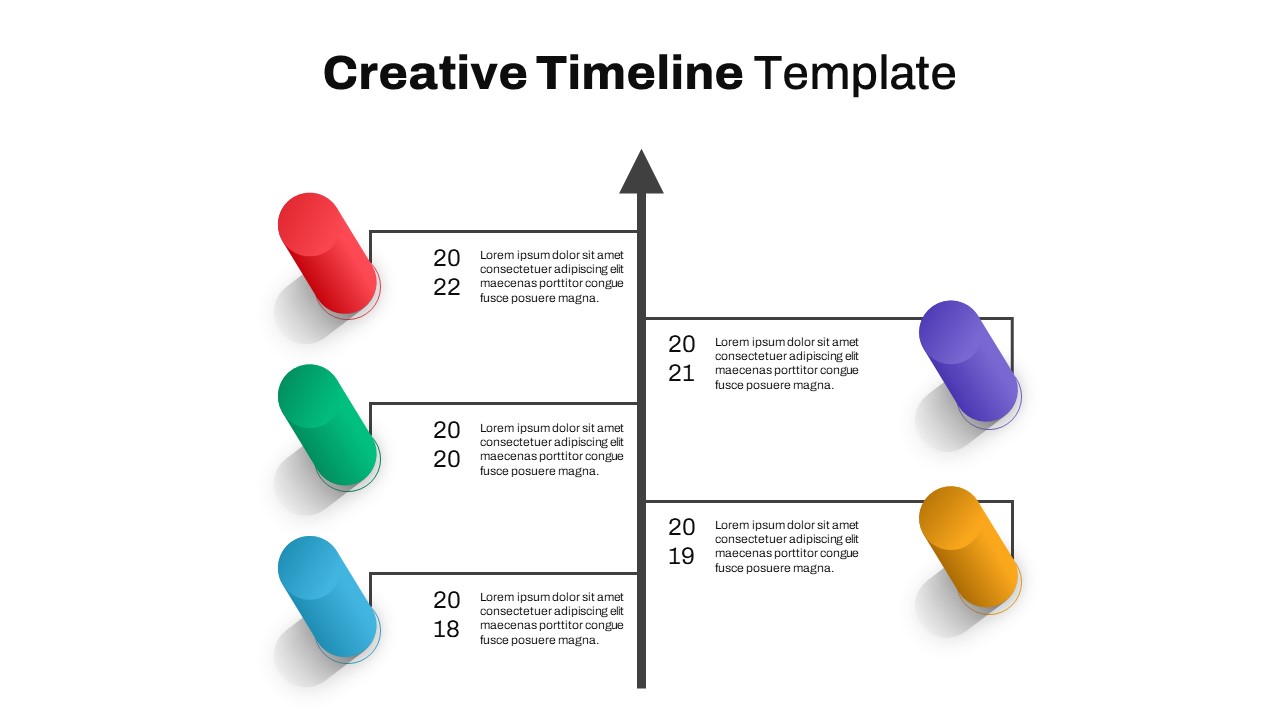
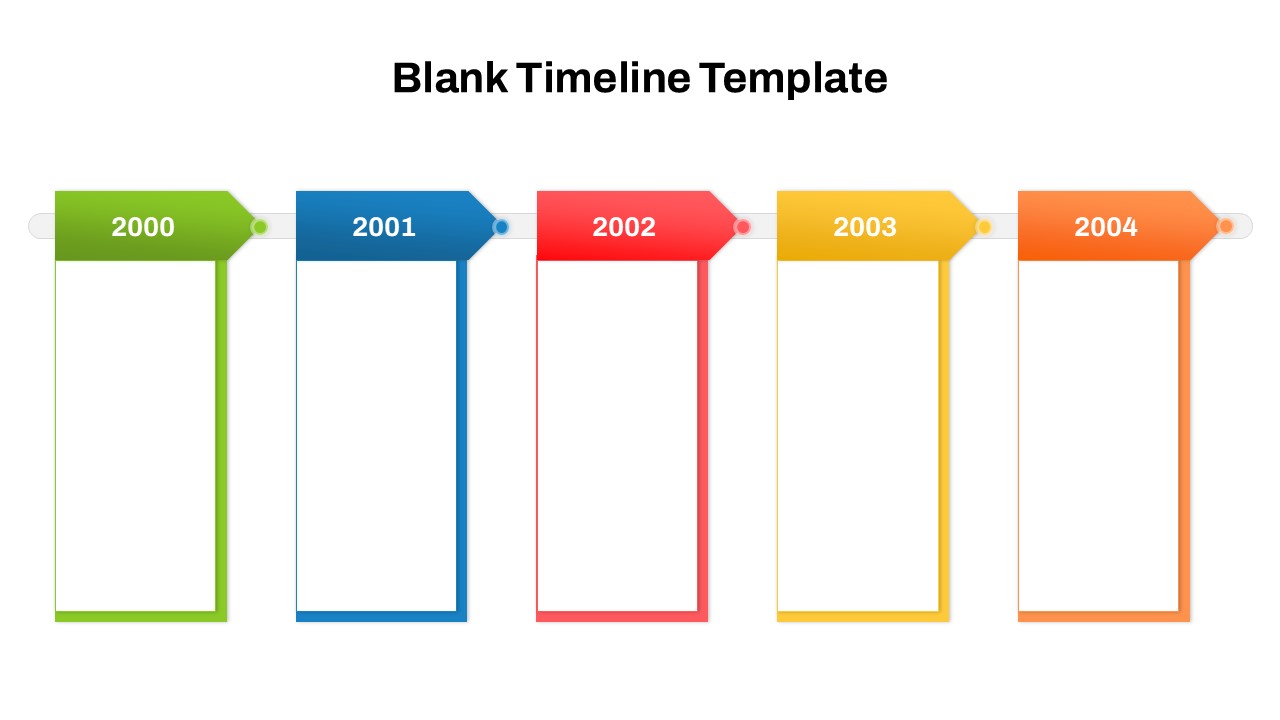
You May Also Like These Presentation Templates


- Free
- Free


- Free
- Free
- Free

- Free
- Free
- Free
- Free
- Free
- Free
- Free
- Free
- Free
- Free